概述
本策略的核心是利用EMA和MACD这两个指标来识别趋势方向和入场时机。当价格突破EMA时认为趋势发生转变,而MACD的离散指标则进一步确认趋势信号。根据价格与EMA和MACD的关系可以判断买入和卖出的时机。
策略原理
该策略主要依靠20周期的EMA线和MACD指标来判断趋势方向。具体交易信号生成规则如下:
买入信号:当价格低于20EMA而MACD指标线在0轴下方时,等待价格突破向上跨过20EMA,同时检查MACD指标线是否同时由负转正或刚刚由负转正,如果满足则在20EMA上方10点钱价格发出买入信号。
卖出信号:当价格高于20EMA而MACD指标线在0轴上方时,等待价格突破向下跨过20EMA,同时检查MACD指标线是否同时由正转负或刚刚由正转负,如果满足则在20EMA下方10点钱价格发出卖出信号。
该策略结合趋势判断和指标过滤,可以有效识别趋势的变化点,避免在盘整区域出现虚假信号。
优势分析
该策略最大的优势在于利用EMA判断大趋势方向的同时,又用MACD指标进行双重确认,从而过滤掉部分噪音交易信号。EMA线能较好地判断主要趋势方向,而MACD则可进一步判定是否蓄势待发。所以这种组合过滤方式使得策略信号较为可靠。
另一方面,该策略也提供了风险控制机制。采用固定止损和止盈的方式,可控有效地管理风险。此外部分仓位迎合保本离场,另一部分则试图跟踪趋势获利。这种方式平衡了风险和收益。
风险分析
该策略最大的风险在于EMA和MACD所判断的趋势信号不一定完全可靠。价格可能出现一定程度的反转,导致止损被触发。另外在盘整之中也可能出现错误信号。这需要通过参数优化来尽量避免。
另一方面,固定止损止盈设置也存在一定风险。当行情出现剧烈波动时,固定值的止损止盈难以完全适应市场,容易被套住或过早离场。这需要根据当时的波动性和流动性来调整止损止盈参数。
优化方向
该策略可以从以下几个方面进行优化:
测试不同参数的EMA周期,寻找最优参数组合
优化MACD的参数,使其更符合所交易品种的特点
尝试变化止损止盈的设置方式,如采用ATR止损等
添加其他指标进行信号过滤,提高信号质量
评估不同品种的交易效果,选择最佳适配品种
通过参数和模型的优化,可以进一步提升策略的稳定性和盈利能力。同时也要控制优化过程的过度拟合风险。
总结
该策略整体来说较为稳健,利用双重指标结合判断趋势信号,可以在一定程度上过滤噪音交易。风险控制也较为妥当。通过进一步优化参数和模型,该策略可以成为一个值得实盘验证的量化交易策略。
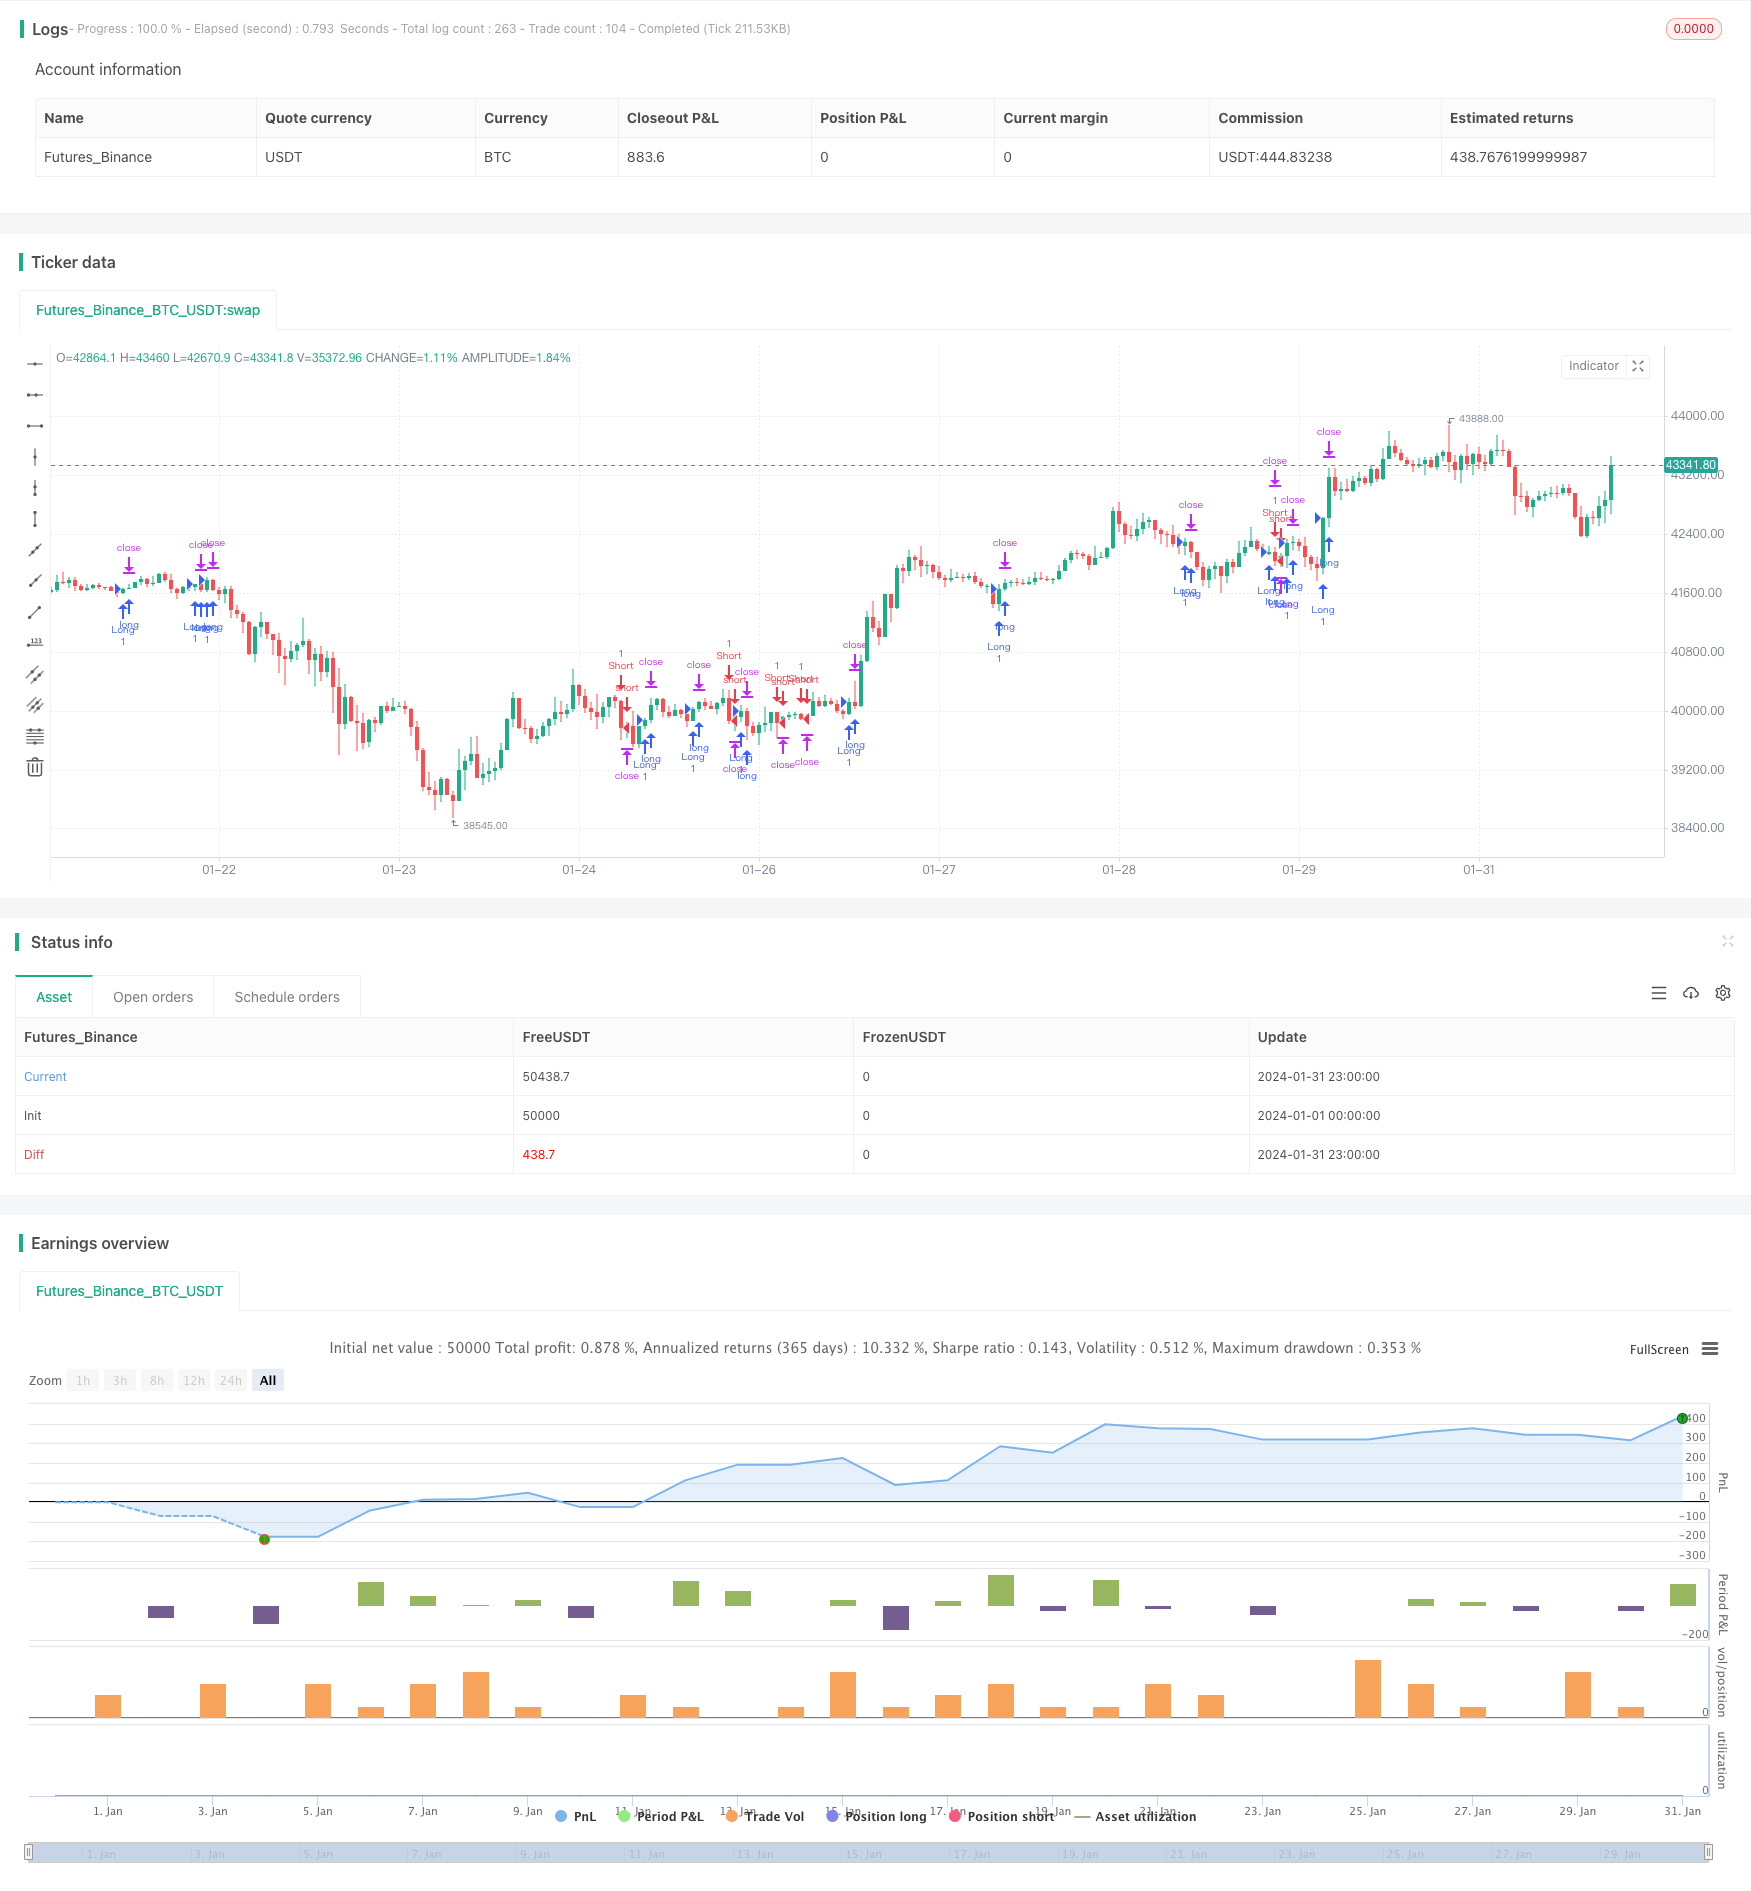
/*backtest
start: 2024-01-01 00:00:00
end: 2024-01-31 23:59:59
period: 1h
basePeriod: 15m
exchanges: [{"eid":"Futures_Binance","currency":"BTC_USDT"}]
*/

//@version=4
strategy("EMA and MACD Trading Strategy", overlay=true)

// Define inputs
emaPeriod = input(20, title="EMA Period")
macdShort = input(12, title="MACD Short Period")
macdLong = input(26, title="MACD Long Period")
macdSignal = input(9, title="MACD Signal Period")
riskAmount = input(10, title="Risk Amount (in pips)")

// Calculate indicators
ema = ema(close, emaPeriod)
[macdLine, signalLine, _] = macd(close, macdShort, macdLong, macdSignal)

// Define long trade conditions
longCondition = crossover(close, ema) and (macdLine > 0 or crossover(macdLine, signalLine)) // Removed unnecessary argument

// Define short trade conditions
shortCondition = crossunder(close, ema) and (macdLine < 0 or crossunder(macdLine, signalLine)) // Removed unnecessary argument

// Execute long trade
if (longCondition)
    stopLoss = close - riskAmount
    takeProfit = close + riskAmount
    strategy.entry("Long", strategy.long)
    strategy.exit("Exit", "Long", stop=stopLoss, limit=takeProfit)

// Execute short trade
if (shortCondition)
    stopLoss = close + riskAmount
    takeProfit = close - riskAmount
    strategy.entry("Short", strategy.short)
    strategy.exit("Exit", "Short", stop=stopLoss, limit=takeProfit)