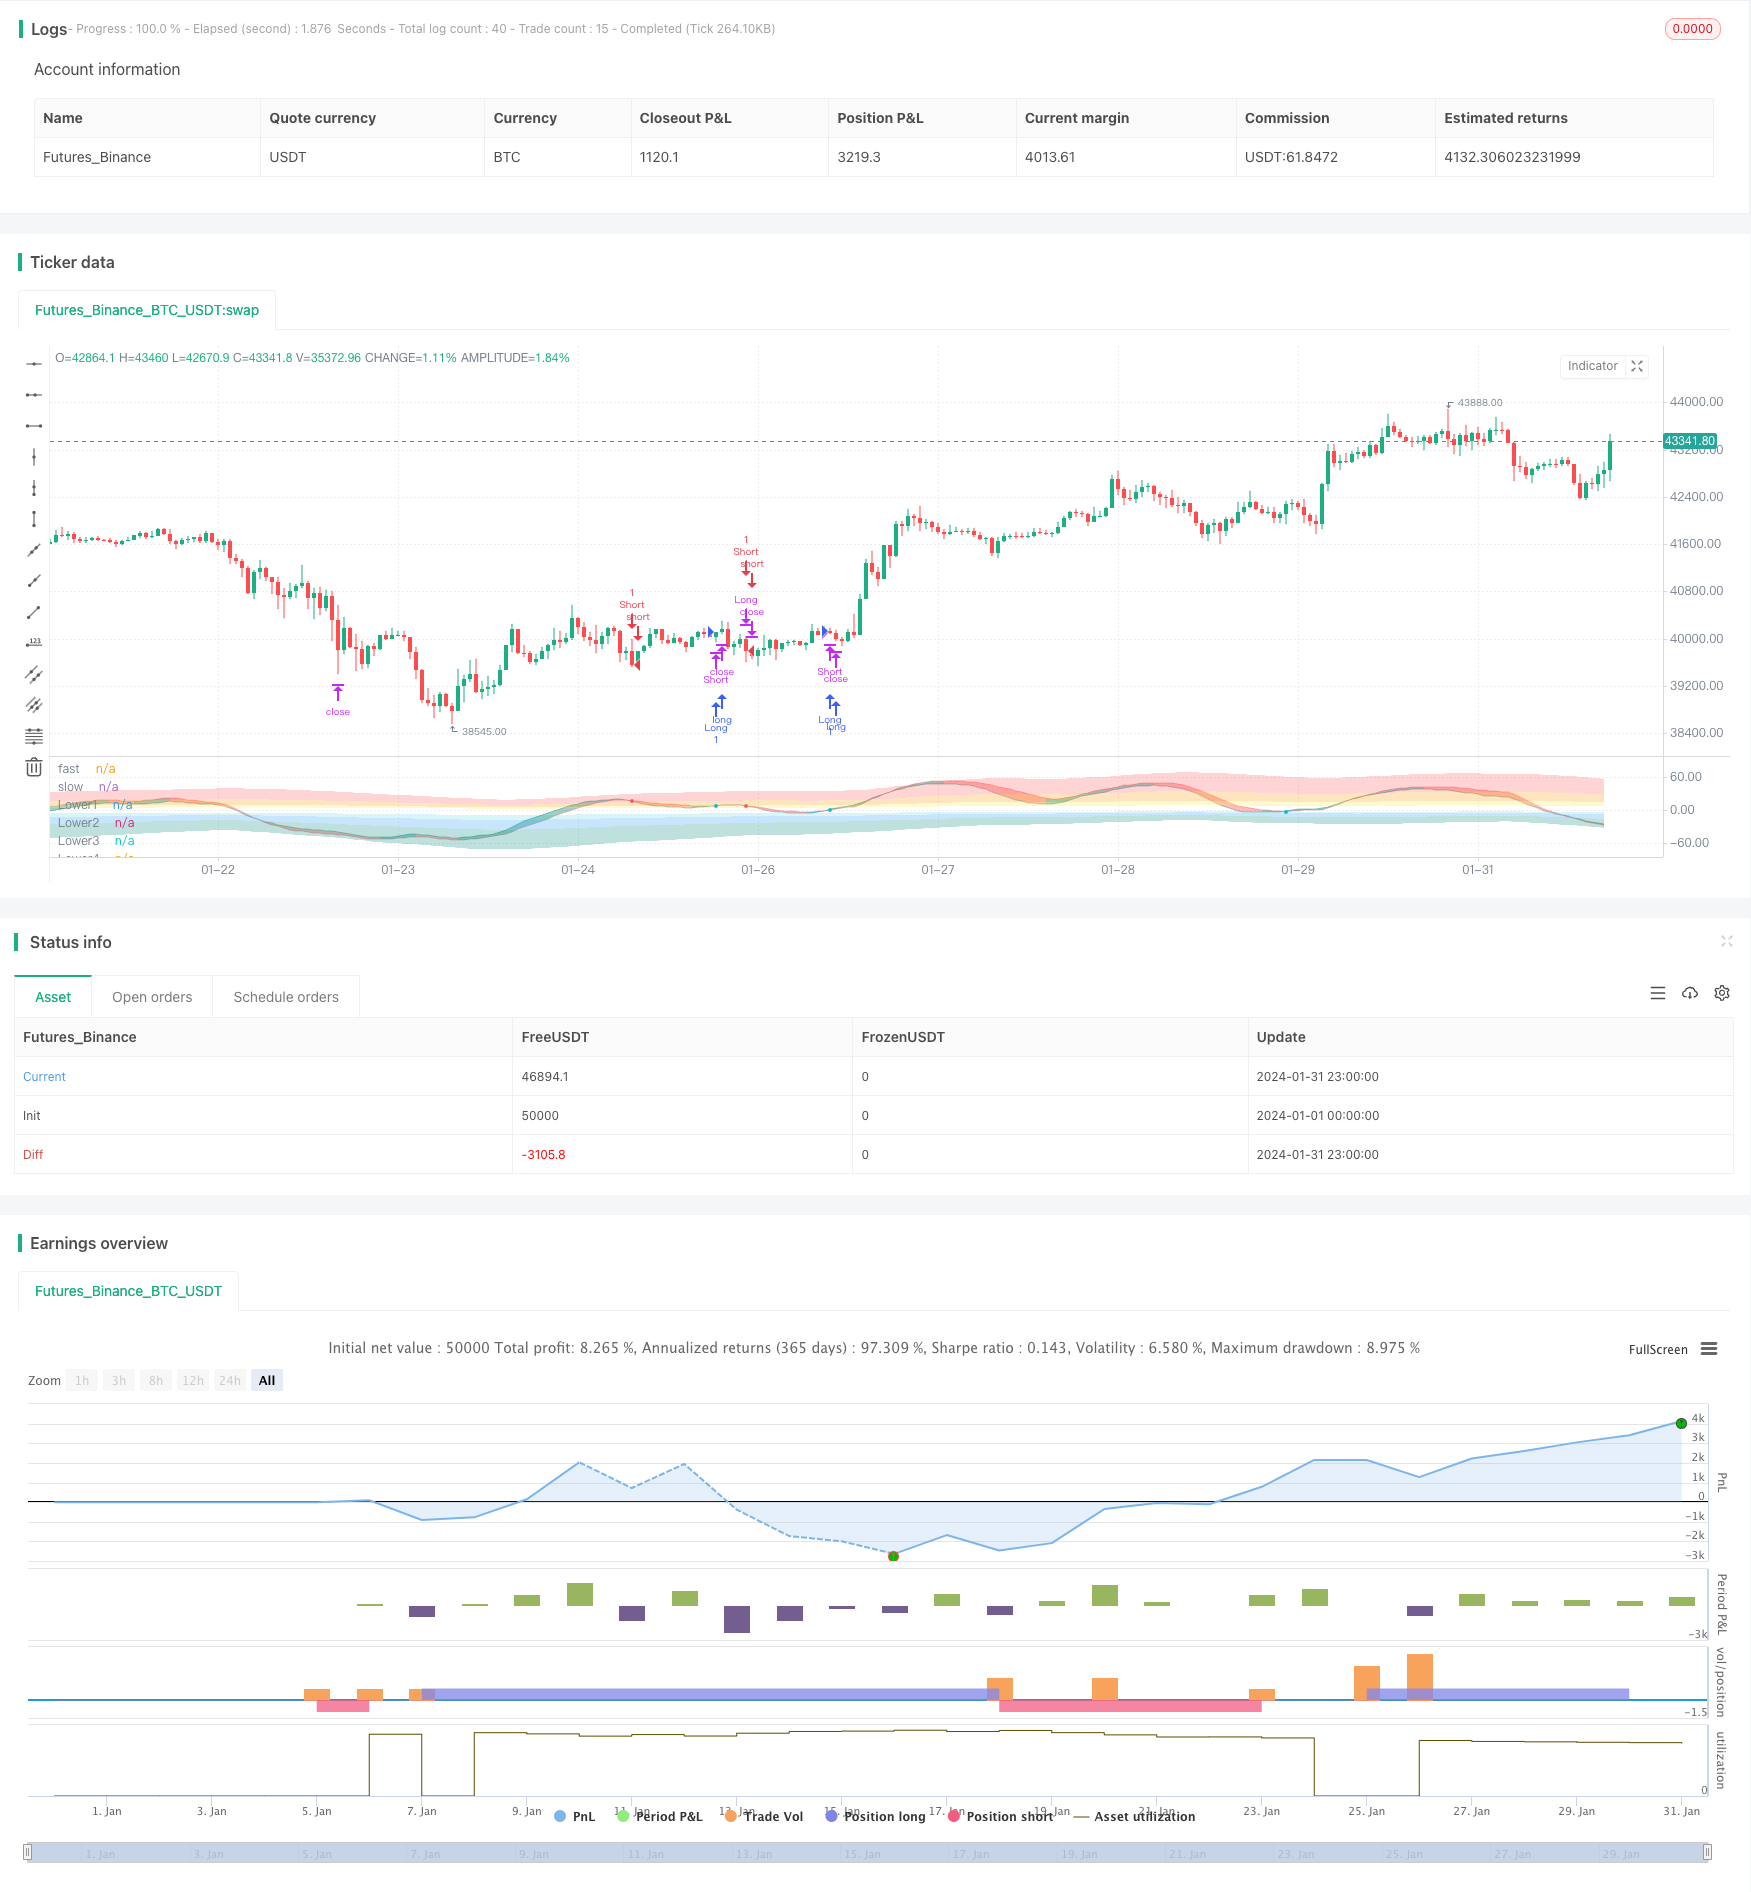
概述
彩虹震荡器交易策略主要利用多个指数平滑移动平均线和震荡指标构建多层震荡通道,形成级别明确的多空信号,属于趋势跟踪类策略。该策略综合利用RSI、CCI、Stochastic和MA组合指标判断市场总体走势和超买超卖区域,属于多因子评级型策略。
策略原理
- 计算RSI、CCI、Stochastic三个指标值的加权平均,构建综合震荡指标Magic;
- 对Magic指标做多次指数平滑处理,得到sampledMagicFast和sampledMagicSlow两条曲线;
- sampledMagicFast代表快速平均线,sampledMagicSlow代表慢速平均线;
- 当sampledMagicFast上穿sampledMagicSlow时产生买入信号;
- 当sampledMagicFast下穿sampledMagicSlow时产生卖出信号;
- 计算最后一个bar的sampledMagicFast相对于前一个bar的变化方向,判断目前趋势;
- 根据趋势方向和sampledMagicFast与sampledMagicSlow的交叉情况判断入场和出场时机。
策略优势
- 综合多个指标判断市场总体走势,提高信号准确性;
- 基于smoothed MA指标,有效抑制信号噪声;
- 震荡信号层层递进清晰,容易操作;
- 结合趋势过滤,可配置成趋势跟踪或反转操作;
- 可自定义超买超卖区域强度,适应性强。
策略风险
- 参数设置失误可能导致曲线过于平滑,错过最佳入场时机;
- 超买超卖区域设置不当可能导致空仓时间过长;
- 多因子评级中某些指标失效会削弱信号有效性。
对应解决方法:
- 优化参数,使曲线平滑度适中;
- 调整超买超卖区域强度,降低空仓率;
- 测试每个指标的预测能力,按权重调整。
策略优化方向
- 基于行情特点动态调整指标参数;
- 引入机器学习方法自动优化指标权重组合;
- 增加volume和波动率等因子过滤入场信号。
总结
彩虹震荡器策略综合多种指标信号,通过指数平滑处理提高稳定性。该策略可配置成适应趋势和震荡市,也可仅用于特定品种的震荡走势。通过参数优化和指标扩展,可进一步提升信号质量。总体来说,该策略逻辑清晰,使用简单,容易掌握。
策略源码
// This source code is subject to the terms of the Mozilla Public License 2.0 at https://mozilla.org/MPL/2.0/
// © businessduck

//@version=5
strategy("Rainbow Oscillator [Strategy]", overlay=false, margin_long=100, margin_short=100, initial_capital = 2000)

bool trendFilter = input.bool(true, 'Use trend filter')
float w1 = input.float(0.33, 'RSI Weight', 0, 1, 0.01)
float w2 = input.float(0.33, 'CCI Weight', 0, 1, 0.01)
float w3 = input.float(0.33, 'Stoch Weight', 0, 1, 0.01)
int fastPeriod = input.int(16, 'Ocillograph Fast Period', 4, 60, 1)
int slowPeriod = input.int(22, 'Ocillograph Slow Period', 4, 60, 1)
int oscillographSamplePeriod = input.int(8, 'Oscillograph Samples Period', 1, 30, 1)
int oscillographSamplesCount = input.int(2, 'Oscillograph Samples Count', 0, 4, 1)
string oscillographMAType = input.string("RMA", "Oscillograph Samples Type", options = ["EMA", "SMA", "RMA", "WMA"])
int levelPeriod = input.int(26, 'Level Period', 2, 100)
int levelOffset = input.int(0, 'Level Offset', 0, 200, 10)
float redunant = input.float(0.5, 'Level Redunant', 0, 1, 0.01)
int levelSampleCount = input.int(2, 'Level Smooth Samples', 0, 4, 1)
string levelType = input.string("RMA", "Level MA type", options = ["EMA", "SMA", "RMA", "WMA"])

perc(current, prev) => ((current - prev) / prev) * 100

smooth(value, type, period) =>
    float ma = switch type
        "EMA" => ta.ema(value, period)
        "SMA" => ta.sma(value, period)
        "RMA" => ta.rma(value, period)
        "WMA" => ta.wma(value, period)
        =>
            runtime.error("No matching MA type found.")
            float(na)

getSample(value, samples, type, period) =>
    float ma = switch samples
        0 => value
        1 => smooth(value, type, period)
        2 => smooth(smooth(value, type, period), type, period)
        3 => smooth(smooth(smooth(value, type, period), type, period), type, period)
        4 => smooth(smooth(smooth(smooth(value, type, period), type, period), type, period), type, period)

float takeProfit = input.float(5, "% Take profit", 0.8, 100, step = 0.1)  / 100
float stopLoss = input.float(2, "% Stop Loss", 0.8, 100, step = 0.1) / 100
float magicFast = w2 * ta.cci(close, fastPeriod) + w1 * (ta.rsi(close, fastPeriod) - 50) + w3 * (ta.stoch(close, high, low, fastPeriod) - 50)
float magicSlow = w2 * ta.cci(close, slowPeriod) + w1 * (ta.rsi(close, slowPeriod) - 50) + w3 * (ta.stoch(close, high, low, slowPeriod) - 50)
float sampledMagicFast = getSample(magicFast, oscillographSamplesCount, oscillographMAType, oscillographSamplePeriod)
float sampledMagicSlow = getSample(magicSlow, oscillographSamplesCount, oscillographMAType, oscillographSamplePeriod)
float lastUpperValue = 0
float lastLowerValue = 0

if (magicFast > 0)
    lastUpperValue := math.max(magicFast, magicFast[1])
else
    lastUpperValue := math.max(0, lastUpperValue[1]) * redunant


if (magicFast <= 0)
    lastLowerValue := math.min(magicFast, magicFast[1])
else
    lastLowerValue := math.min(0, lastLowerValue[1]) * redunant

float level1up = getSample( (magicFast >= 0 ? magicFast : lastUpperValue) / 4, levelSampleCount, levelType, levelPeriod) + levelOffset
float level2up = getSample( (magicFast >= 0 ? magicFast : lastUpperValue) / 2, levelSampleCount, levelType, levelPeriod) + levelOffset
float level3up = getSample( magicFast >= 0 ? magicFast : lastUpperValue, levelSampleCount, levelType, levelPeriod) + levelOffset
float level4up = getSample( (magicFast >= 0 ? magicFast : lastUpperValue) * 2, levelSampleCount, levelType, levelPeriod) + levelOffset

float level1low = getSample( (magicFast <= 0 ? magicFast : lastLowerValue) / 4, levelSampleCount, levelType, levelPeriod) - levelOffset
float level2low = getSample( (magicFast <= 0 ? magicFast : lastLowerValue) / 2, levelSampleCount, levelType, levelPeriod) - levelOffset
float level3low = getSample( magicFast <= 0 ? magicFast : lastLowerValue, levelSampleCount, levelType, levelPeriod) - levelOffset
float level4low = getSample( (magicFast <= 0 ? magicFast : lastLowerValue) * 2, levelSampleCount, levelType, levelPeriod) - levelOffset

var transparent = color.new(color.white, 100)
var overbough4Color = color.new(color.red, 75)
var overbough3Color = color.new(color.orange, 75)
var overbough2Color = color.new(color.yellow, 75)

var oversold4Color = color.new(color.teal, 75)
var oversold3Color = color.new(color.blue, 75)
var oversold2Color = color.new(color.aqua, 85)

upperPlotId1 = plot(level1up, 'Upper1', transparent)
upperPlotId2 = plot(level2up, 'Upper2', transparent)
upperPlotId3 = plot(level3up, 'Upper3', transparent)
upperPlotId4 = plot(level4up, 'Upper4', transparent)

fastColor = color.new(color.teal, 60)
slowColor = color.new(color.red, 60)
fastPlotId = plot(sampledMagicFast, 'fast', color = fastColor)
slowPlotId = plot(sampledMagicSlow, 'slow', color = slowColor)

lowerPlotId1 = plot(level1low, 'Lower1', transparent)
lowerPlotId2 = plot(level2low, 'Lower2', transparent)
lowerPlotId3 = plot(level3low, 'Lower3', transparent)
lowerPlotId4 = plot(level4low, 'Lower4', transparent)

fill(upperPlotId4, upperPlotId3, overbough4Color)
fill(upperPlotId3, upperPlotId2, overbough3Color)
fill(upperPlotId2, upperPlotId1, overbough2Color)

fill(lowerPlotId4, lowerPlotId3, oversold4Color)
fill(lowerPlotId3, lowerPlotId2, oversold3Color)
fill(lowerPlotId2, lowerPlotId1, oversold2Color)

upTrend = sampledMagicFast > sampledMagicFast[1]
buySignal = ((upTrend or not trendFilter) and ta.crossunder(sampledMagicSlow, sampledMagicFast)) ? sampledMagicSlow : na
sellSignal = ((not upTrend or not trendFilter) and ta.crossover(sampledMagicSlow, sampledMagicFast)) ? sampledMagicSlow : na
diff = sampledMagicSlow - sampledMagicFast

fill(fastPlotId, slowPlotId, upTrend ? fastColor : slowColor)
plot(buySignal, color = color.aqua, style = plot.style_circles, linewidth = 4)
plot(sellSignal, color = color.red, style = plot.style_circles, linewidth = 4)


// longCondition = upTrend != upTrend[1] and upTrend
long_take_level = strategy.position_avg_price * (1 + takeProfit)
long_stop_level = strategy.position_avg_price * (1 - stopLoss)

short_take_level = strategy.position_avg_price * (1 - takeProfit)
short_stop_level = strategy.position_avg_price * (1 + stopLoss)

strategy.close(id="Long", when=sellSignal, comment = "Exit")
strategy.close(id="Short", when=buySignal, comment = "Exit")

strategy.entry("Long", strategy.long, when=buySignal)
strategy.entry("Short", strategy.short, when=sellSignal)

strategy.exit("Take Profit/ Stop Loss","Long", stop=long_stop_level, limit=long_take_level)
strategy.exit("Take Profit/ Stop Loss","Short", stop=short_stop_level, limit=short_take_level)


// plot(long_stop_level, color=color.red, overlay=true)
// plot(long_take_level, color=color.green)