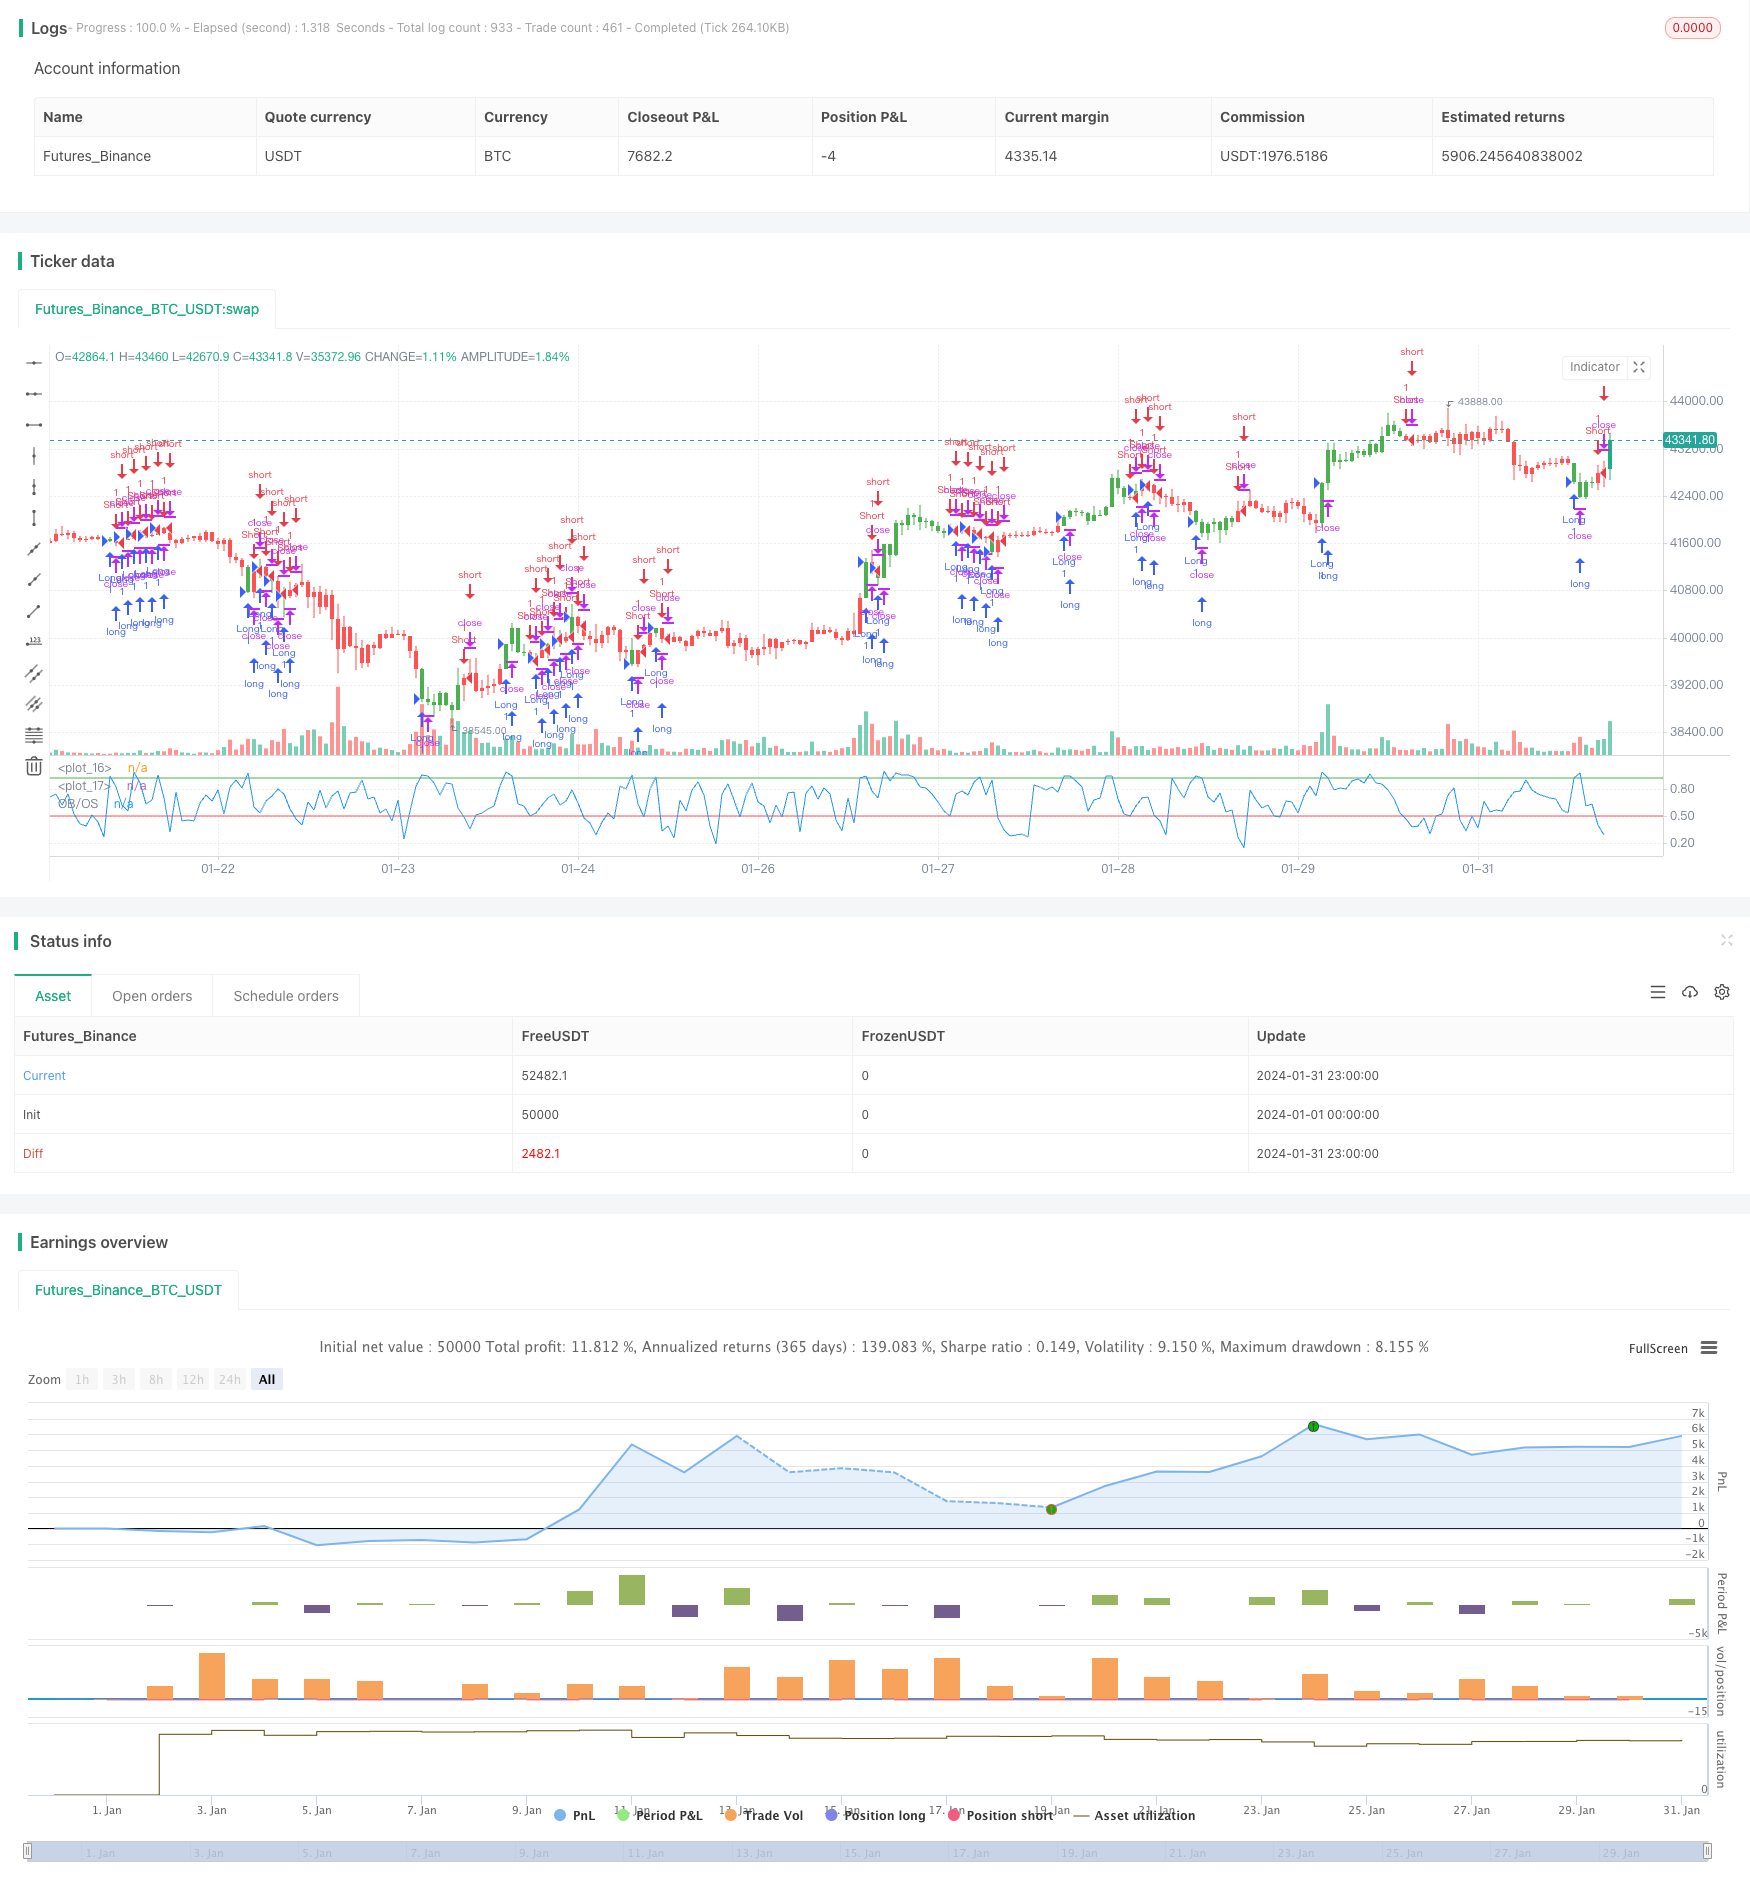
概述
移动平均线指标策略是一种根据移动平均线判断市场趋势,并进行长仓或短仓操作的量化交易策略。该策略通过计算一定周期的收盘价平均值,判断市场是否处在超买或超卖状态,以捕捉价格反转机会。
策略原理
该策略的核心指标是随机指数移动平均线(Stochastic Oscillator)。其计算方法是:
低点 = 最近N天的最低价中的最低值
高点 = 最近N天的最高价中的最高值
K值 = (当前close - 低点)/(高点 - 低点)* 100
其中,N值即为长度Length。该指标大体反映了当前收盘价相对最近N天价格范围的位置。
当K值大于超买线(BuyBand),表示股价可能超买,将发生回调;当K值小于超卖线(SellBand),表示股价可能超卖,将发生反弹。
根据这一判断规则,该策略会在超买区卖出开仓,在超卖区买入开仓。平仓条件则是指标线重新进入中间区域((SellBand, BuyBand))。
优势分析
该策略具有以下优势:
- 使用移动平均线指标判断市场趋势,回测效果较好,容易形成交易信号
- 通过调整参数,可以灵活适应不同周期和品种
- 策略思路简单清晰,容易理解和优化
风险分析
该策略也存在一些风险:
- 移动平均线容易产生错触现象,可能出现超买超卖信号被“甩”的情况
- 参数设置不当可能导致交易频繁或信号不明显
- 只考虑单一指标,可优化空间有限
可以通过适当优化指标参数,或增加过滤条件来减少这些风险。
优化方向
该策略主要可以从以下几个方面进行优化:
- 增加volume或ATR等指标过滤,确保交易信号更可靠
- 加入多个周期的Stoch指标,进行组合运算生成信号
- 增加附加判断指标,如MACD、KDJ等,实现多指标聚合
- 对交易品种、周期、参数进行遍历优化,寻找最佳配置
总结
移动平均线指标策略整体思路简单,使用广泛,回测效果较为稳定,适合作为量化交易的入门策略之一。但该策略考虑因素单一,可优化空间有限,仅适合短期操作。未来可通过多指标聚合、机器学习等手段进行升级。
策略源码
/*backtest
start: 2024-01-01 00:00:00
end: 2024-01-31 23:59:59
period: 1h
basePeriod: 15m
exchanges: [{"eid":"Futures_Binance","currency":"BTC_USDT"}]
*/

//@version=2
////////////////////////////////////////////////////////////
//  Copyright by HPotter v1.0 25/09/2017
// Simple Overbought/Oversold indicator
//
// You can change long to short in the Input Settings
// WARNING:
// - For purpose educate only
// - This script to change bars colors.
////////////////////////////////////////////////////////////
strategy(title="Overbought/Oversold", shorttitle="OB/OS")
Length = input(10, minval=1)
BuyBand = input(0.92, step = 0.01)
SellBand = input(0.5, step = 0.01)
reverse = input(false, title="Trade reverse")
hline(BuyBand, color=green, linestyle=line)
hline(SellBand, color=red, linestyle=line)
xOBOS = stoch(close, high, low, Length)
nRes = iff(close > close[Length], xOBOS / 100, (100 - xOBOS) / 100)
pos = iff(nRes < SellBand, -1,
	   iff(nRes > BuyBand, 1, nz(pos[1], 0)))
possig = iff(reverse and pos == 1, -1,
          iff(reverse and pos == -1, 1, pos))
if (possig == 1)
    strategy.entry("Long", strategy.long)
if (possig == -1)
    strategy.entry("Short", strategy.short)
barcolor(possig == -1 ? red: possig == 1 ? green : blue )
plot(nRes, color=blue, title="OB/OS")