概述
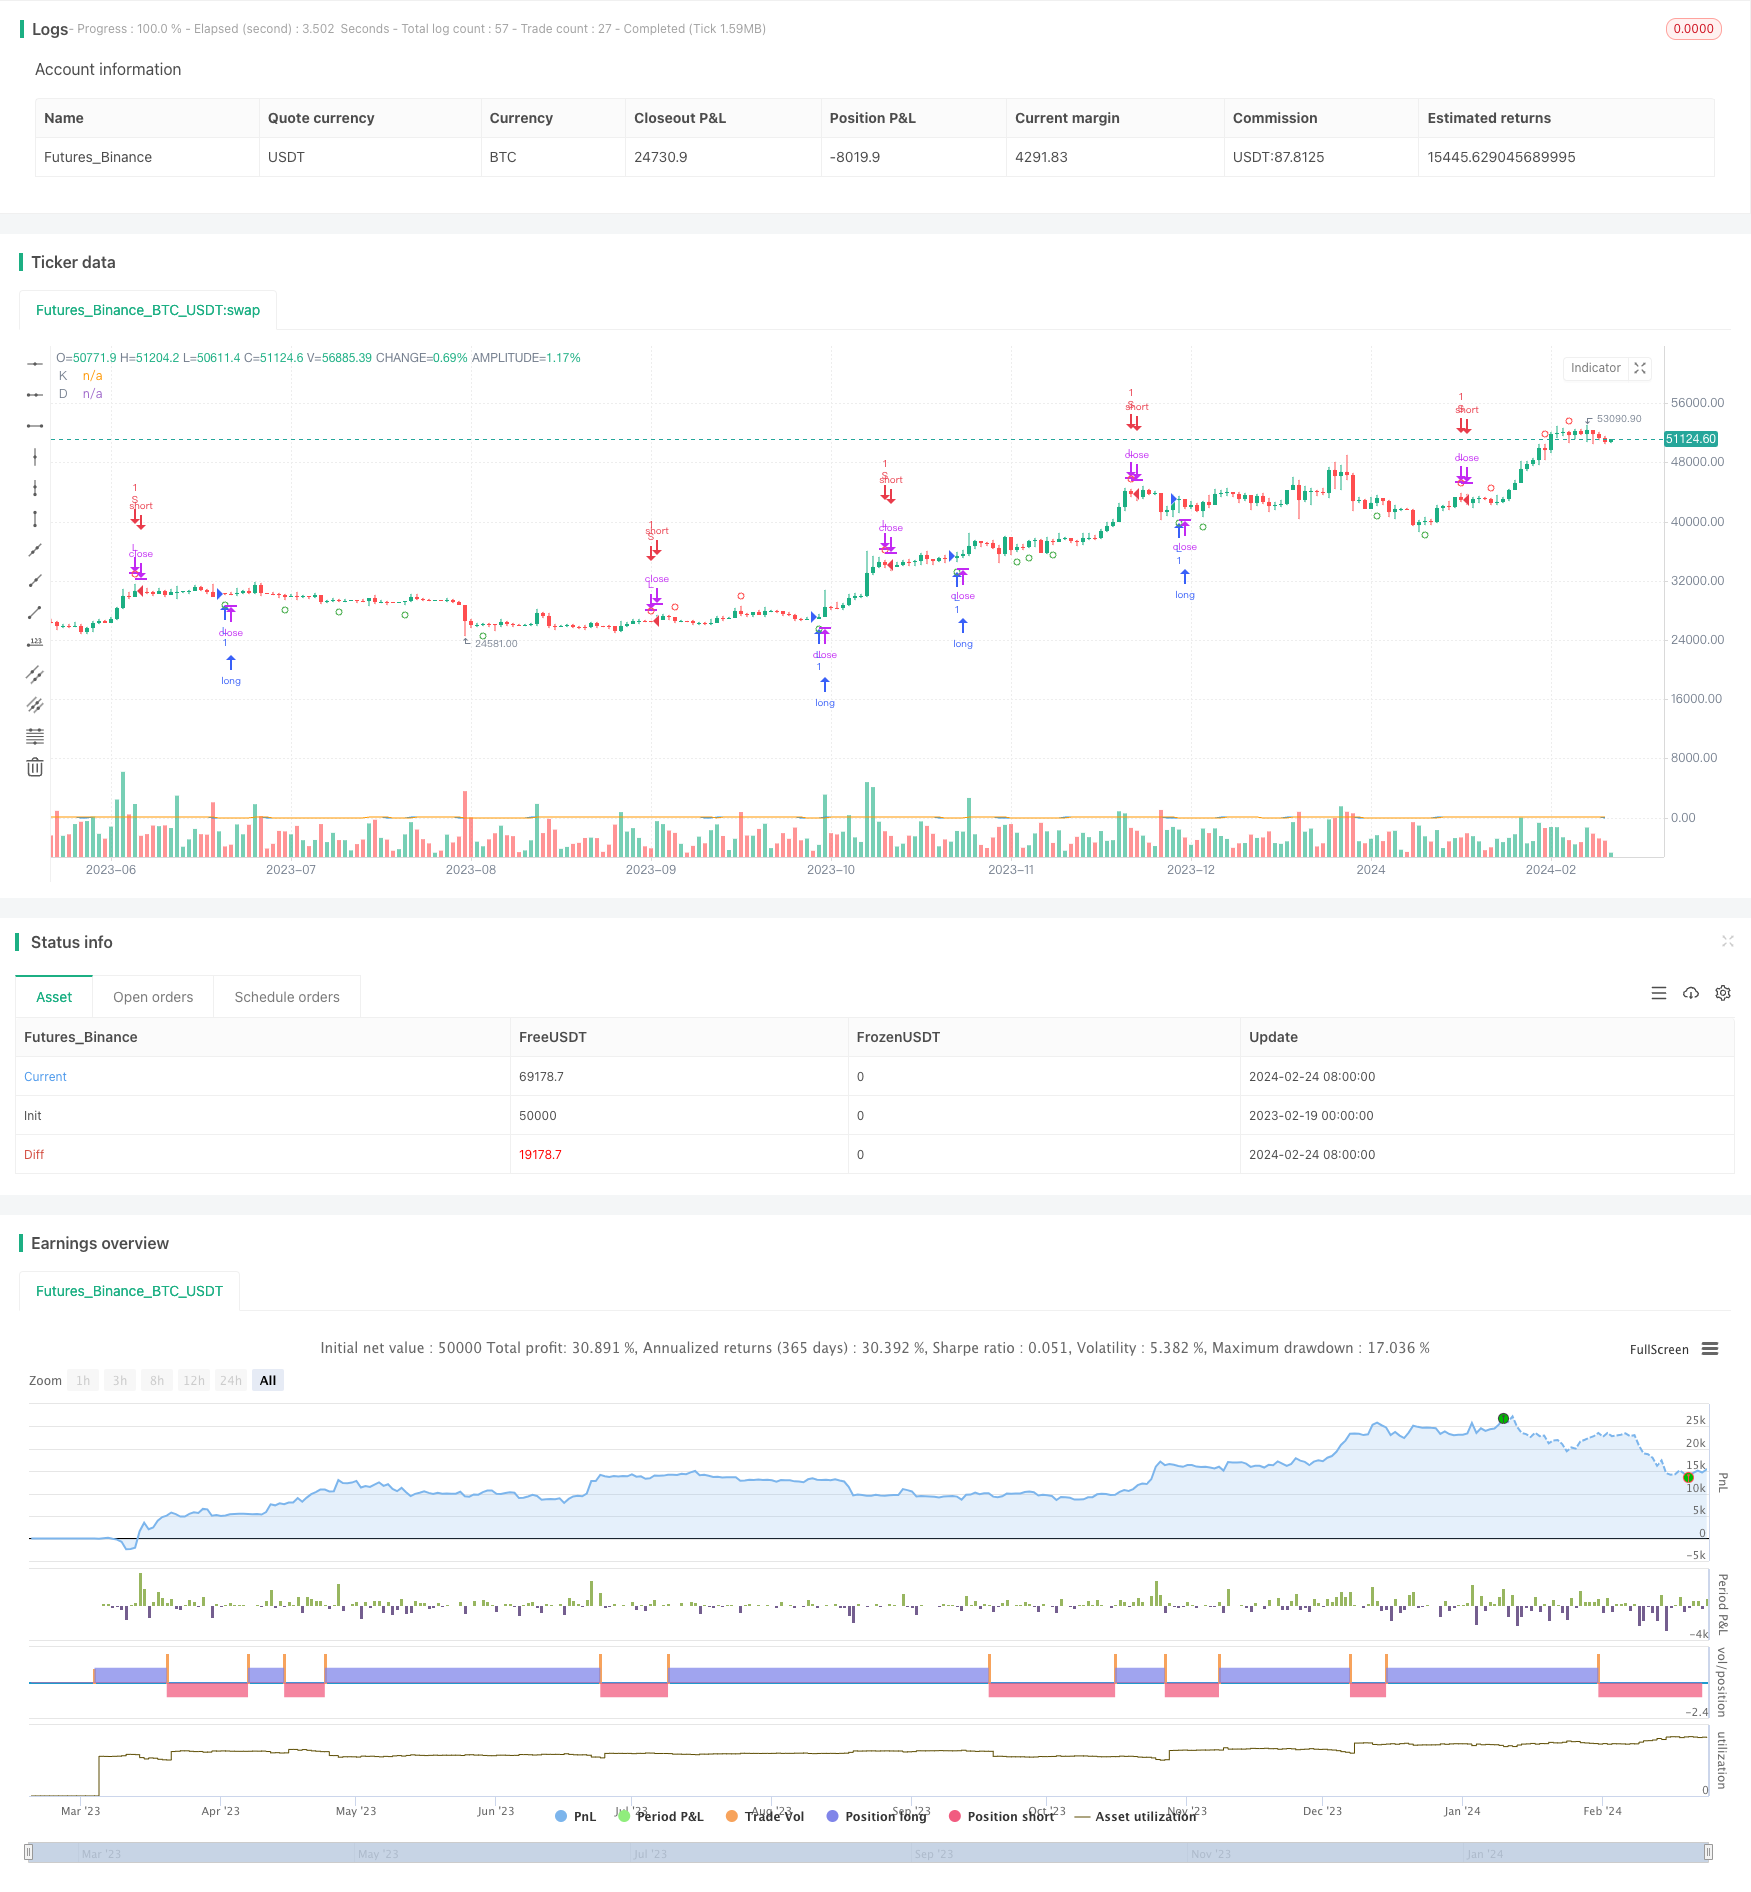
StochRSI反转交易策略是一种联合使用Stochastic RSI和RSI指标的量化交易策略。该策略通过Stochastic RSI指标识别超买超卖情况,在RSI指标反转的时候产生交易信号。
策略原理
该策略首先计算14日RSI指标。然后基于RSI指标计算Stochastic RSI,包括%K线和%D线。其中%K线参数为3日SMA,%D线参数为%K线的3日SMA。当%K线从超卖区域进入另一极端区域且上穿%D线时,产生买入信号;当%K线从超卖区域进入另一极端区域且下穿%D线时,产生卖出信号。
优势分析
这种策略联合使用Stochastic RSI和RSI指标,可以更准确地捕捉反转点位。相比单一RSI指标,有以下优势:
Stochastic RSI可以更清楚地识别超买超卖现象,滤除部分噪音。
Stochastic RSI结合RSI指标反转,可以更准确抓住反转的时机点。
通过调整Stochastic RSI的参数,可以优化指标灵敏度,适应更多市场环境。
风险分析
该策略也存在一些风险:
反转失败风险。所选指标不能完全准确预测价格反转,仍存在一定失败风险。
参数优化风险。Stochastic RSI和RSI的参数设置会影响策略表现,需要进行优化。
趋势市场表现较弱。在趋势突破市场中,跟随趋势的策略通常优于反转策略。
对策:
适当调整止损点,控制单笔损失。
借助机器学习寻找最优参数组合。
结合趋势跟随策略,在不同市场中灵活切换。
优化方向
该策略还可以从以下方向进行优化:
优化Stochastic RSI和RSI的参数,找到最佳组合。可以借助机器学习训练这些参数。
增加止损策略,如策略亏损超过3%就止损。这可以有效控制风险。
结合动量因子,在超买超卖的同时判定价格动量,避免假突破。
增加趋势判断,当处于趋势市场时停止反转交易,改为跟踪趋势。
总结
StochRSI反转交易策略通过联合Stochastic RSI和RSI指标判断超买超卖现象,在价格反转时入场,目的是捕捉中短线随机震荡获利。这种策略可以提高反转交易精确度,但也存在一定失败风险。我们可以通过参数优化、止损策略、动量判定等方式进一步完善该策略,在保持较高胜率的同时控制风险。
/*backtest
start: 2023-02-19 00:00:00
end: 2024-02-25 00:00:00
period: 1d
basePeriod: 1h
exchanges: [{"eid":"Futures_Binance","currency":"BTC_USDT"}]
*/

//@version=4
strategy("StochRSIStrategy", overlay=true)

// Define the K and D periods, RSI length, and overbought/oversold levels
K = input(3, title="%K")
D = input(3, title="%D")
rsiLength = input(14, title="RSI Length")
stochLength = input(14, title="Stoch Length")
overbought = input(80, title="Overbought Level")
oversold = input(20, title="Oversold Level")

// Calculate the RSI
rsi = rsi(close, rsiLength)

// Calculate Stochastic RSI
stochRsi = stoch(rsi, rsi, rsi, stochLength)
Kline = sma(stochRsi, K)
Dline = sma(Kline, D)

// Plot Stochastic RSI
plot(Kline, title="K", color=color.blue)
plot(Dline, title="D", color=color.orange)

// Define bullish and bearish conditions
bullCond = (Kline < oversold) and (crossover(Kline, Dline))
bearCond = (Kline > overbought) and (crossunder(Kline, Dline))

// Generate and plot signals
if (bullCond)
    strategy.entry("L", strategy.long)
if (bearCond)
    strategy.close("L")

if (bearCond)
    strategy.entry("S", strategy.short)
if (bullCond)
    strategy.close("S")

// Plot signals
plotshape(series=bullCond, title="L", location=location.belowbar, color=color.green, style=shape.circle, size=size.small)
plotshape(series=bearCond, title="S", location=location.abovebar, color=color.red, style=shape.circle, size=size.small)