概述
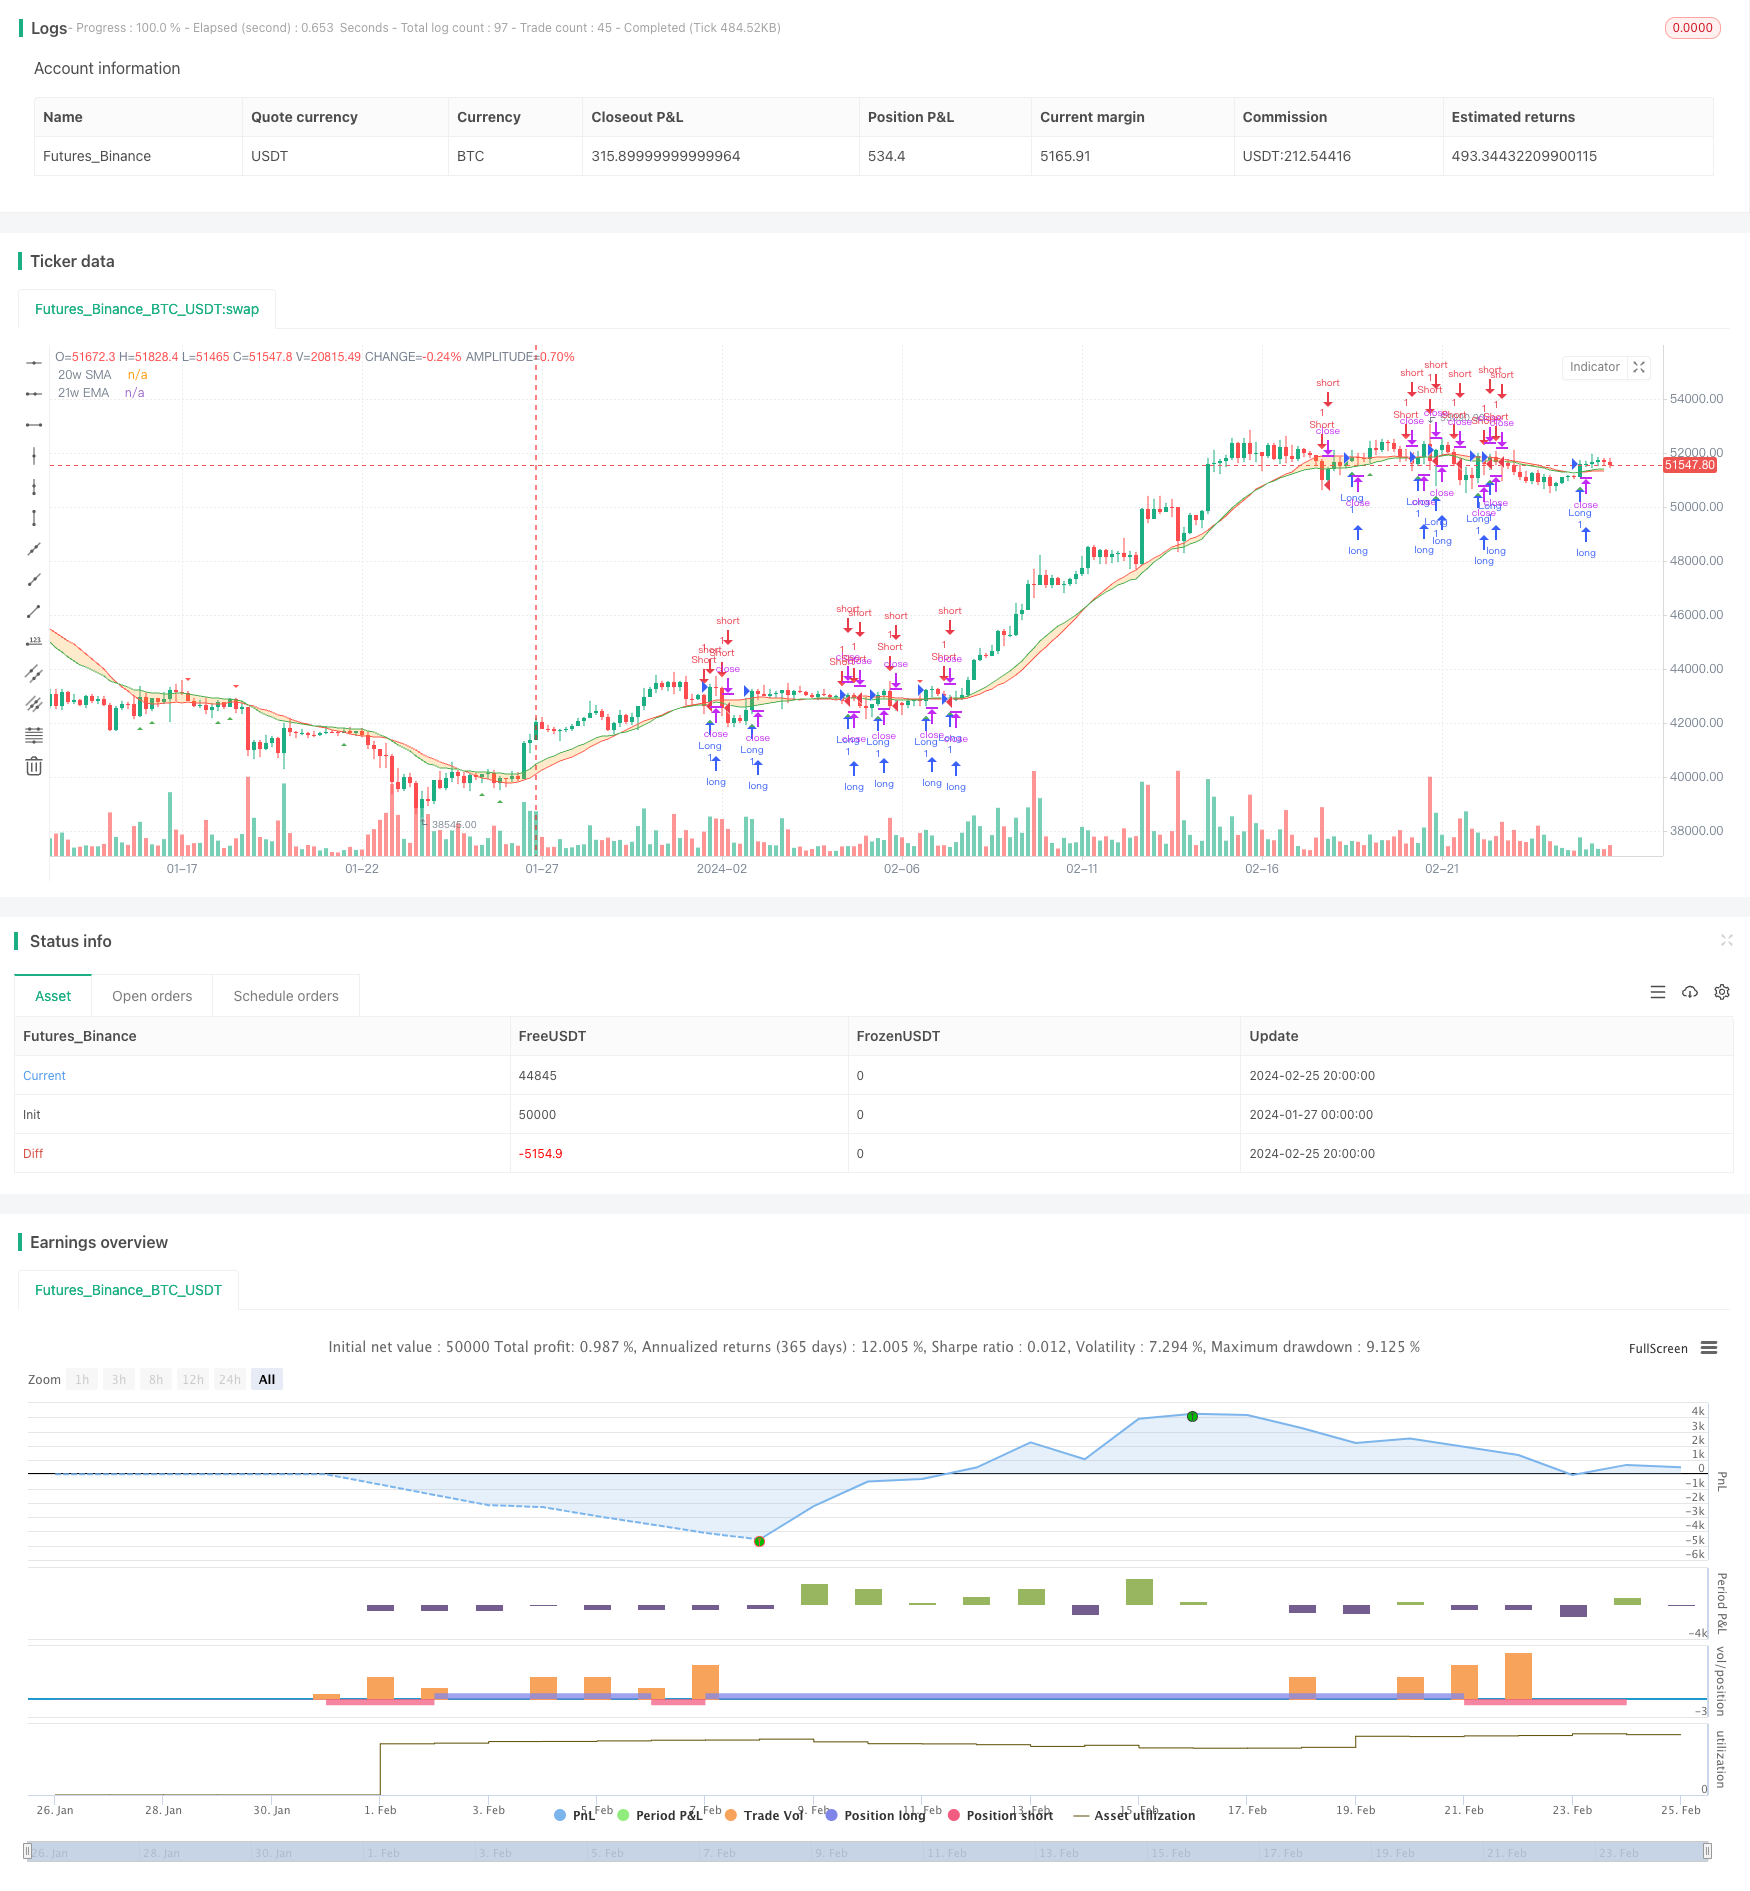
本策略通过计算并绘制 20 周期简单移动平均线(SMA)和 21 周期指数移动平均线(EMA),并在它们之间填充颜色来可视化价格波动区域。当价格上穿 20 周期 SMA 时生成买入信号;当价格下穿 21 周期 EMA 时生成卖出信号。该策略同时具有追踪止损和止盈功能。
策略原理
双移动平均线突破策略的核心思想是利用快速移动平均线和慢速移动平均线之间的交叉作为买卖信号。20 周期 SMA 相对更为灵敏,能快速响应价格变化;21 周期 EMA 的反应稍微滞后但更为平滑。当短期和长期趋势方向一致时,即两条平均线发生向上或向下交叉时,判断趋势进入较强阶段,这个时候做出的买入或卖出决策胜率较大。
具体来说,当收盘价格上穿 20 周期 SMA 时,表示短期和长期均为上升趋势,因此做多;当收盘价格下穿 21 周期 EMA 时,表示短期和长期均为下降趋势,因此做空。平仓信号则与 entry 信号相反,如价格下破 20 周期 SMA 则平多仓,价格上破 21 周期 EMA 则平空仓。
该策略同时利用fill技术在两条移动平均线之间填充颜色,形成视觉指标,辅助判断市场走势。
策略优势
双移动平均线突破策略具有以下优势:
- 原理简单,容易理解和实现;
- 通过双线交叉判断市场走势较为准确;
- 可视化指标直观显示价格波动区域;
- 具有追踪止损止盈功能,可以锁定利润、减少风险;
- 可扩展性强,可基于该策略进行各种优化。
策略风险
该策略也存在一些风险:
- 在震荡行情中容易产生错误信号;
- 止损止盈设置不当可能带来亏损或利润减少;
- 参数设定(如周期长度)不当会影响策略效果;
- 机械化交易容易引发系列亏损。
针对上述风险,可以采取以下措施加以应对:
- 增加过滤条件,在震荡期避免进场;
- 优化止损止盈参数,平衡风险收益;
- 测试参数健壮性,选择适合市场的指标参数;
- 人工干预异常情况,避免连续亏损扩大。
策略优化
该策略可以从以下几个方面进行优化:
- 增加其他技术指标过滤,例如交易量、波动度等指标,避免假突破;
- 基于机器学习方法动态优化移动平均线参数;
- 结合情绪指标、消息面等提高决策效果;
- 加入自适应止损机制,根据市场变化调整止损幅度。
总结
本策略通过快速和缓速双移动平均线的交叉来判断行情趋势变化,并相应做出买入和卖出决策。该策略具有简单、直观、容易实现等优点,也存在一定的风险。通过参数优化、增加过滤条件、人工干预等方式可以降低风险提高策略效果。该策略扩展空间大,值得深入研究与应用。
策略源码
/*backtest
start: 2024-01-27 00:00:00
end: 2024-02-26 00:00:00
period: 4h
basePeriod: 15m
exchanges: [{"eid":"Futures_Binance","currency":"BTC_USDT"}]
*/

//@version=5
strategy("BMSB Breakout Strategy", shorttitle="BMSB Breakout", overlay=true)

source = close
smaLength = 20
emaLength = 21

sma = ta.sma(source, smaLength)
ema = ta.ema(source, emaLength)

outSma = request.security(syminfo.tickerid, timeframe.period, sma)
outEma = request.security(syminfo.tickerid, timeframe.period, ema)

smaPlot = plot(outSma, color=color.new(color.red, 0), title='20w SMA')
emaPlot = plot(outEma, color=color.new(color.green, 0), title='21w EMA')

fill(smaPlot, emaPlot, color=color.new(color.orange, 75), fillgaps=true)

// Definir condiciones para la estrategia de compra y venta
buyCondition = ta.crossover(close, outSma)
sellCondition = ta.crossunder(close, outEma)

// Entrada larga (compra) y salida corta
strategy.entry("Long", strategy.long, when=buyCondition and not na(sellCondition))
strategy.close("Short", when=buyCondition)

// Entrada corta (venta) y salida larga
strategy.entry("Short", strategy.short, when=sellCondition and not na(buyCondition))
strategy.close("Long", when=sellCondition)

// Puedes ajustar la configuración de la estrategia y los valores predeterminados según tus preferencias

plotshape(series=buyCondition, location=location.belowbar, color=color.green, style=shape.triangleup, title="Buy Signal")
plotshape(series=sellCondition, location=location.abovebar, color=color.red, style=shape.triangledown, title="Sell Signal")