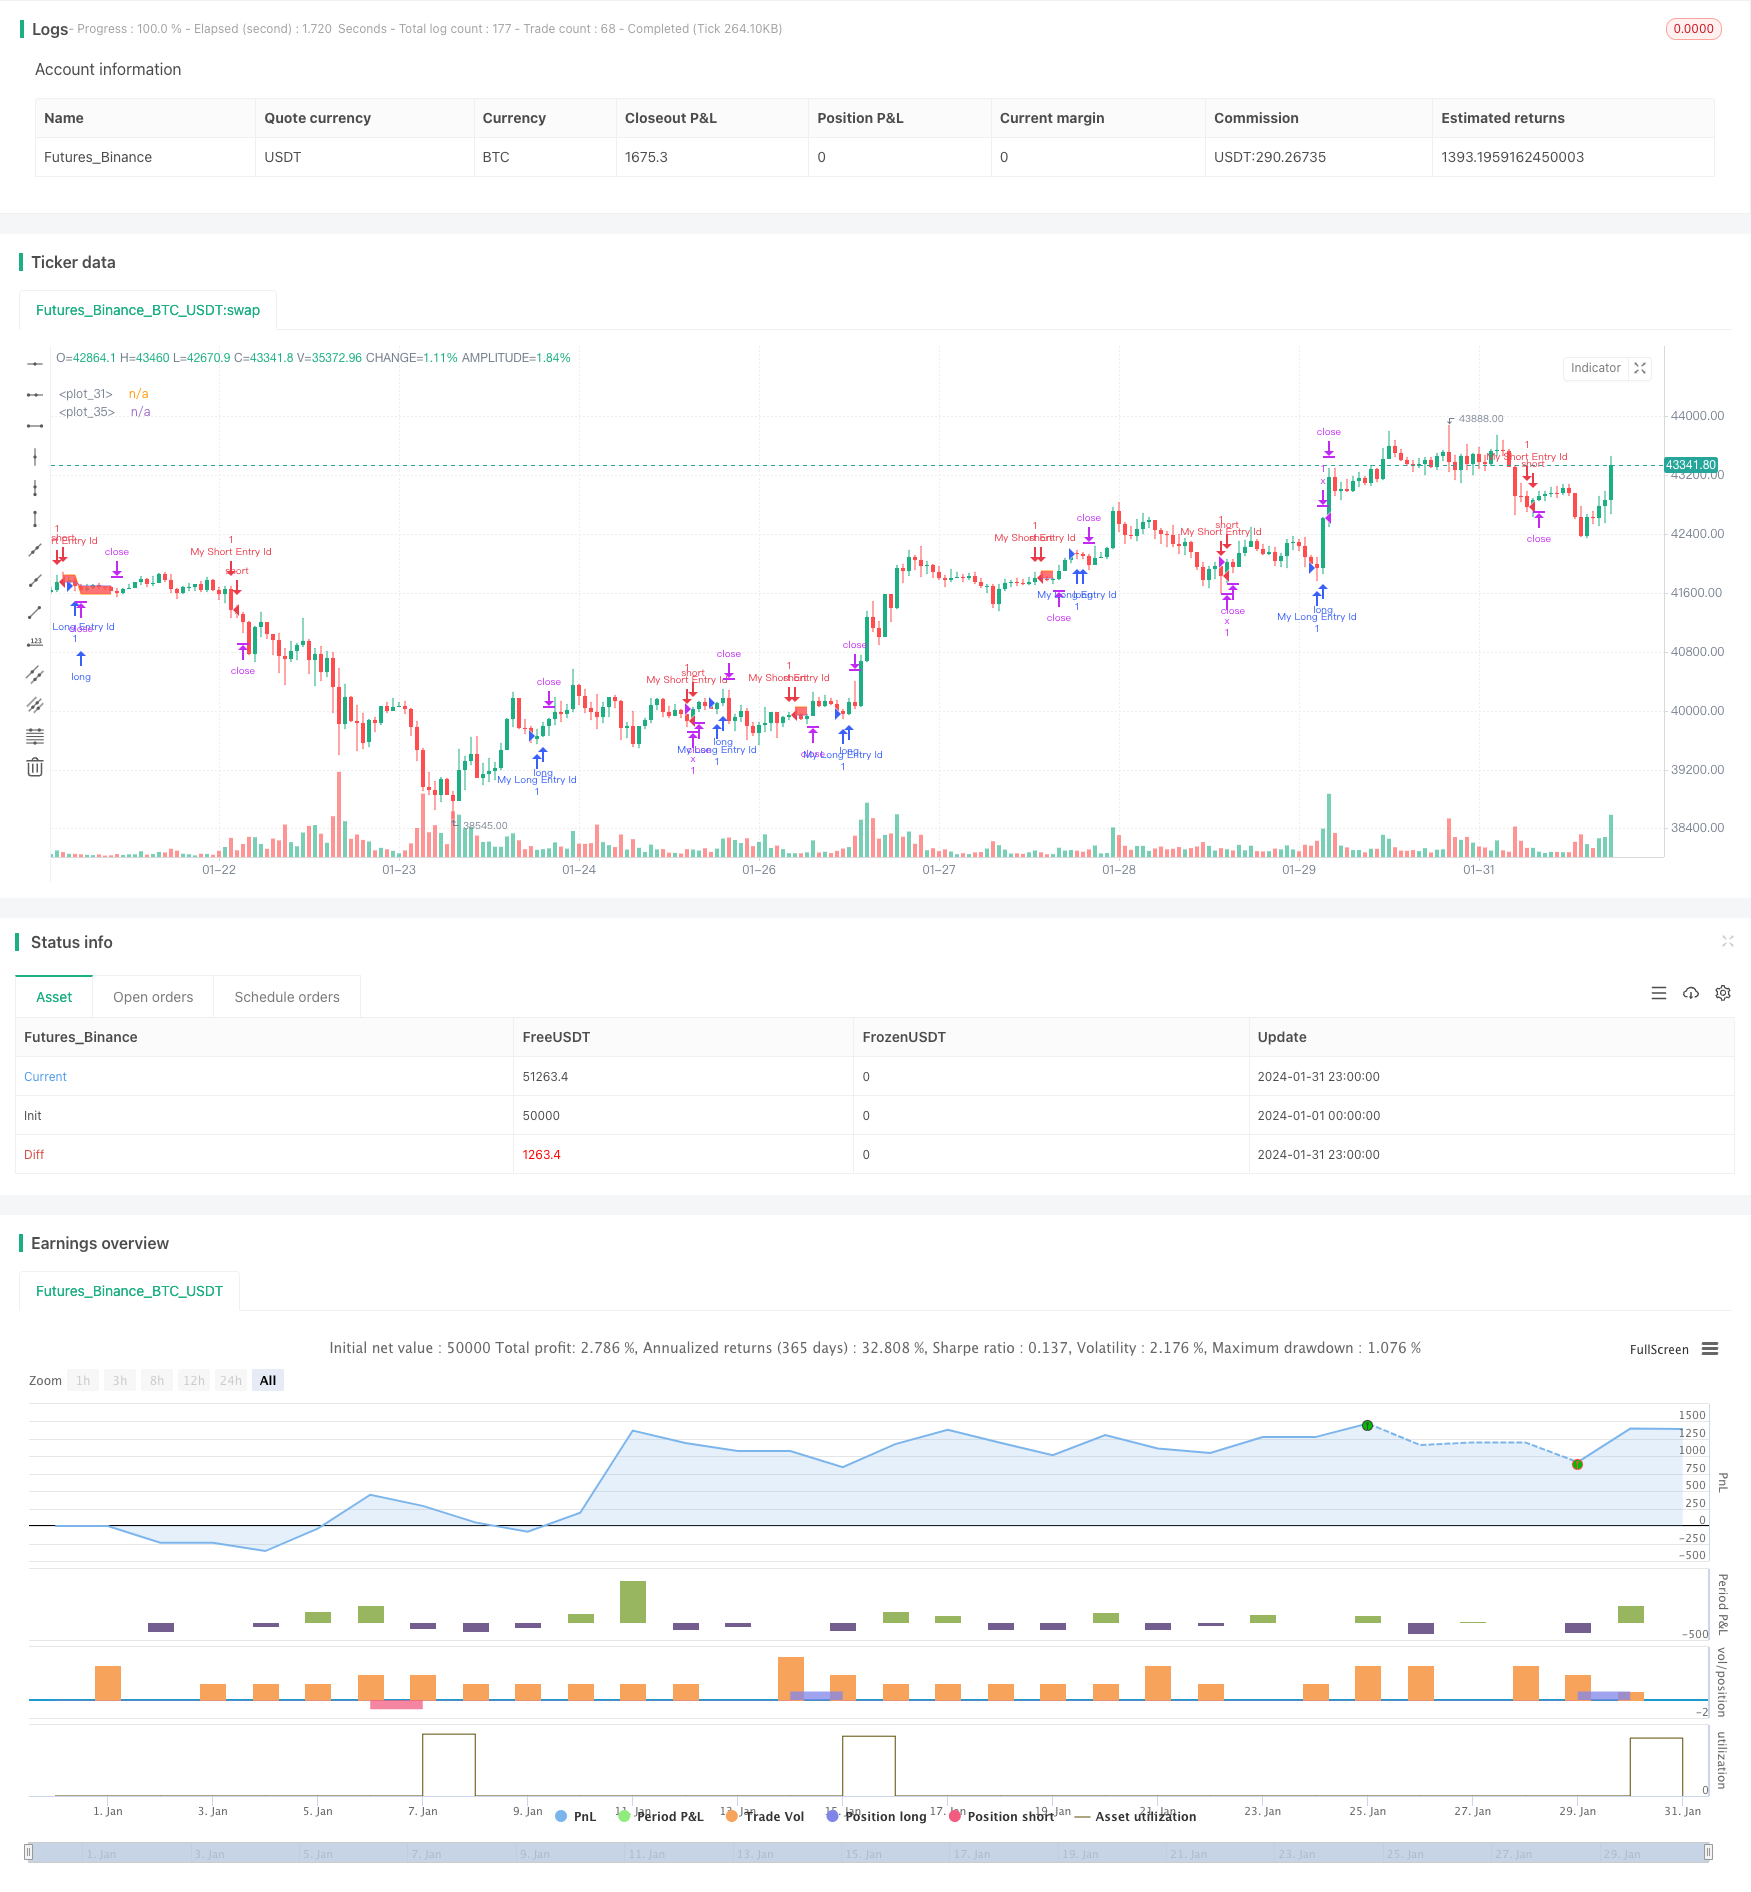
Dual Moving Average Following Strategy

Author: ChaoZhang, Date: 2024-02-27 14:49:58
Tags:

img

Overview

The dual moving average following strategy is a trend following strategy based on moving averages. It determines the trend direction by calculating moving averages of different periods and generates trading signals accordingly. It goes long when the short-term moving average crosses over the long-term one, and goes short when the short-term moving average crosses below the long-term one. The strategy follows the trend to profit.

Strategy Logic

The dual moving average following strategy judges the trend direction by calculating the 14-period and 28-period simple moving averages (SMA) of the closing price. Specifically, it calculates the 14-period SMA and 28-period SMA of close price at the end of each period. When the 14-period SMA crosses over the 28-period SMA, it sends out a long signal and opens a long position. When the 14-period SMA crosses below the 28-period SMA, it sends out a short signal and opens a short position.

After entering positions, it manages risks by setting take profit and stop loss levels. The take profit and stop loss points are converted to prices based on the input parameters. It also plots the take profit line, stop loss line and entry average price line on the chart for visual judgment of profit and risk.

Advantage Analysis

The dual moving average following strategy has the following advantages:

  1. Simple to implement and operate.
  2. Follows the trend with lower drawdown risks.
  3. Trading frequency can be controlled by adjusting the cycle parameters.
  4. Flexible take profit and stop loss settings to control risks.

Risk Analysis

The dual moving average following strategy also has some risks:

  1. Significant loss may occur if sudden events interrupt the market trend.
  2. Premature stop loss may happen if the stop loss point is set too small.
  3. Loss range could be enlarged if the stop loss point is set too big.
  4. Trading frequency may be too high or too low, impacting capital efficiency.

The risks can be managed from the following aspects:

  1. Set stop loss point dynamically based on volatility.
  2. Optimize the moving average cycle parameters.
  3. Add trend filter to avoid false signals near trend turning points.

Optimization Directions

The dual moving average following strategy can be optimized in the following ways:

  1. Add volatility indicators for dynamic stop loss point. For example, combine with ATR to expand stop loss when volatility rises to avoid premature exit.

  2. Optimize moving average cycle parameters by testing more combinations and selecting proper periods with suitable frequency of trading signals.

  3. Add trend filter indicator, such as MACD, DMI to avoid false signals near trend turning points, reducing unnecessary trades.

  4. Increase machine learning models to predict price trend and replace traditional rules. LSTM, GRU deep learning models may generate better results.

  5. Diversify trading varieties utilizing low correlation to reduce overall drawdown.

Conclusion

In conclusion, the dual moving average following strategy is a simple and practical trend following system. It moves along the trend thus having lower drawdown risks, and is easy to implement. We can optimize it by adjusting cycle parameters, setting stop loss and take profit, adding trend judging indicators, to adapt to more market environments and earn more steady returns.


/*backtest
start: 2024-01-01 00:00:00
end: 2024-01-31 23:59:59
period: 1h
basePeriod: 15m
exchanges: [{"eid":"Futures_Binance","currency":"BTC_USDT"}]
*/

// This Pine Script™ code is subject to the terms of the Mozilla Public License 2.0 at https://mozilla.org/MPL/2.0/
// © coinilandBot
// This source code is subject to the terms of the Mozilla Public License 2.0 at https://mozilla.org/MPL/2.0/
// © adolgov

// @description
// 

//@version=4
strategy("coiniland  copy trading platform", overlay=true)

// random entry condition

longCondition = crossover(sma(close, 14), sma(close, 28))
if (longCondition)
    strategy.entry("My Long Entry Id", strategy.long)

shortCondition = crossunder(sma(close, 14), sma(close, 28))
if (shortCondition)
    strategy.entry("My Short Entry Id", strategy.short)

moneyToSLPoints(money) =>
    strategy.position_size !=0 ? (money / syminfo.pointvalue / abs(strategy.position_size)) / syminfo.mintick : na

p = moneyToSLPoints(input(200, title = "Take Profit $$"))
l = moneyToSLPoints(input(100, title = "Stop Loss $$"))
strategy.exit("x", profit = p, loss = l)

// debug plots for visualize SL & TP levels
pointsToPrice(pp) =>
    na(pp) ? na : strategy.position_avg_price + pp * sign(strategy.position_size) * syminfo.mintick
    
pp = plot(pointsToPrice(p), style = plot.style_linebr )
lp = plot(pointsToPrice(-l), style = plot.style_linebr )
avg = plot( strategy.position_avg_price, style = plot.style_linebr )
fill(pp, avg, color = color.green)
fill(avg, lp, color = color.red)


More