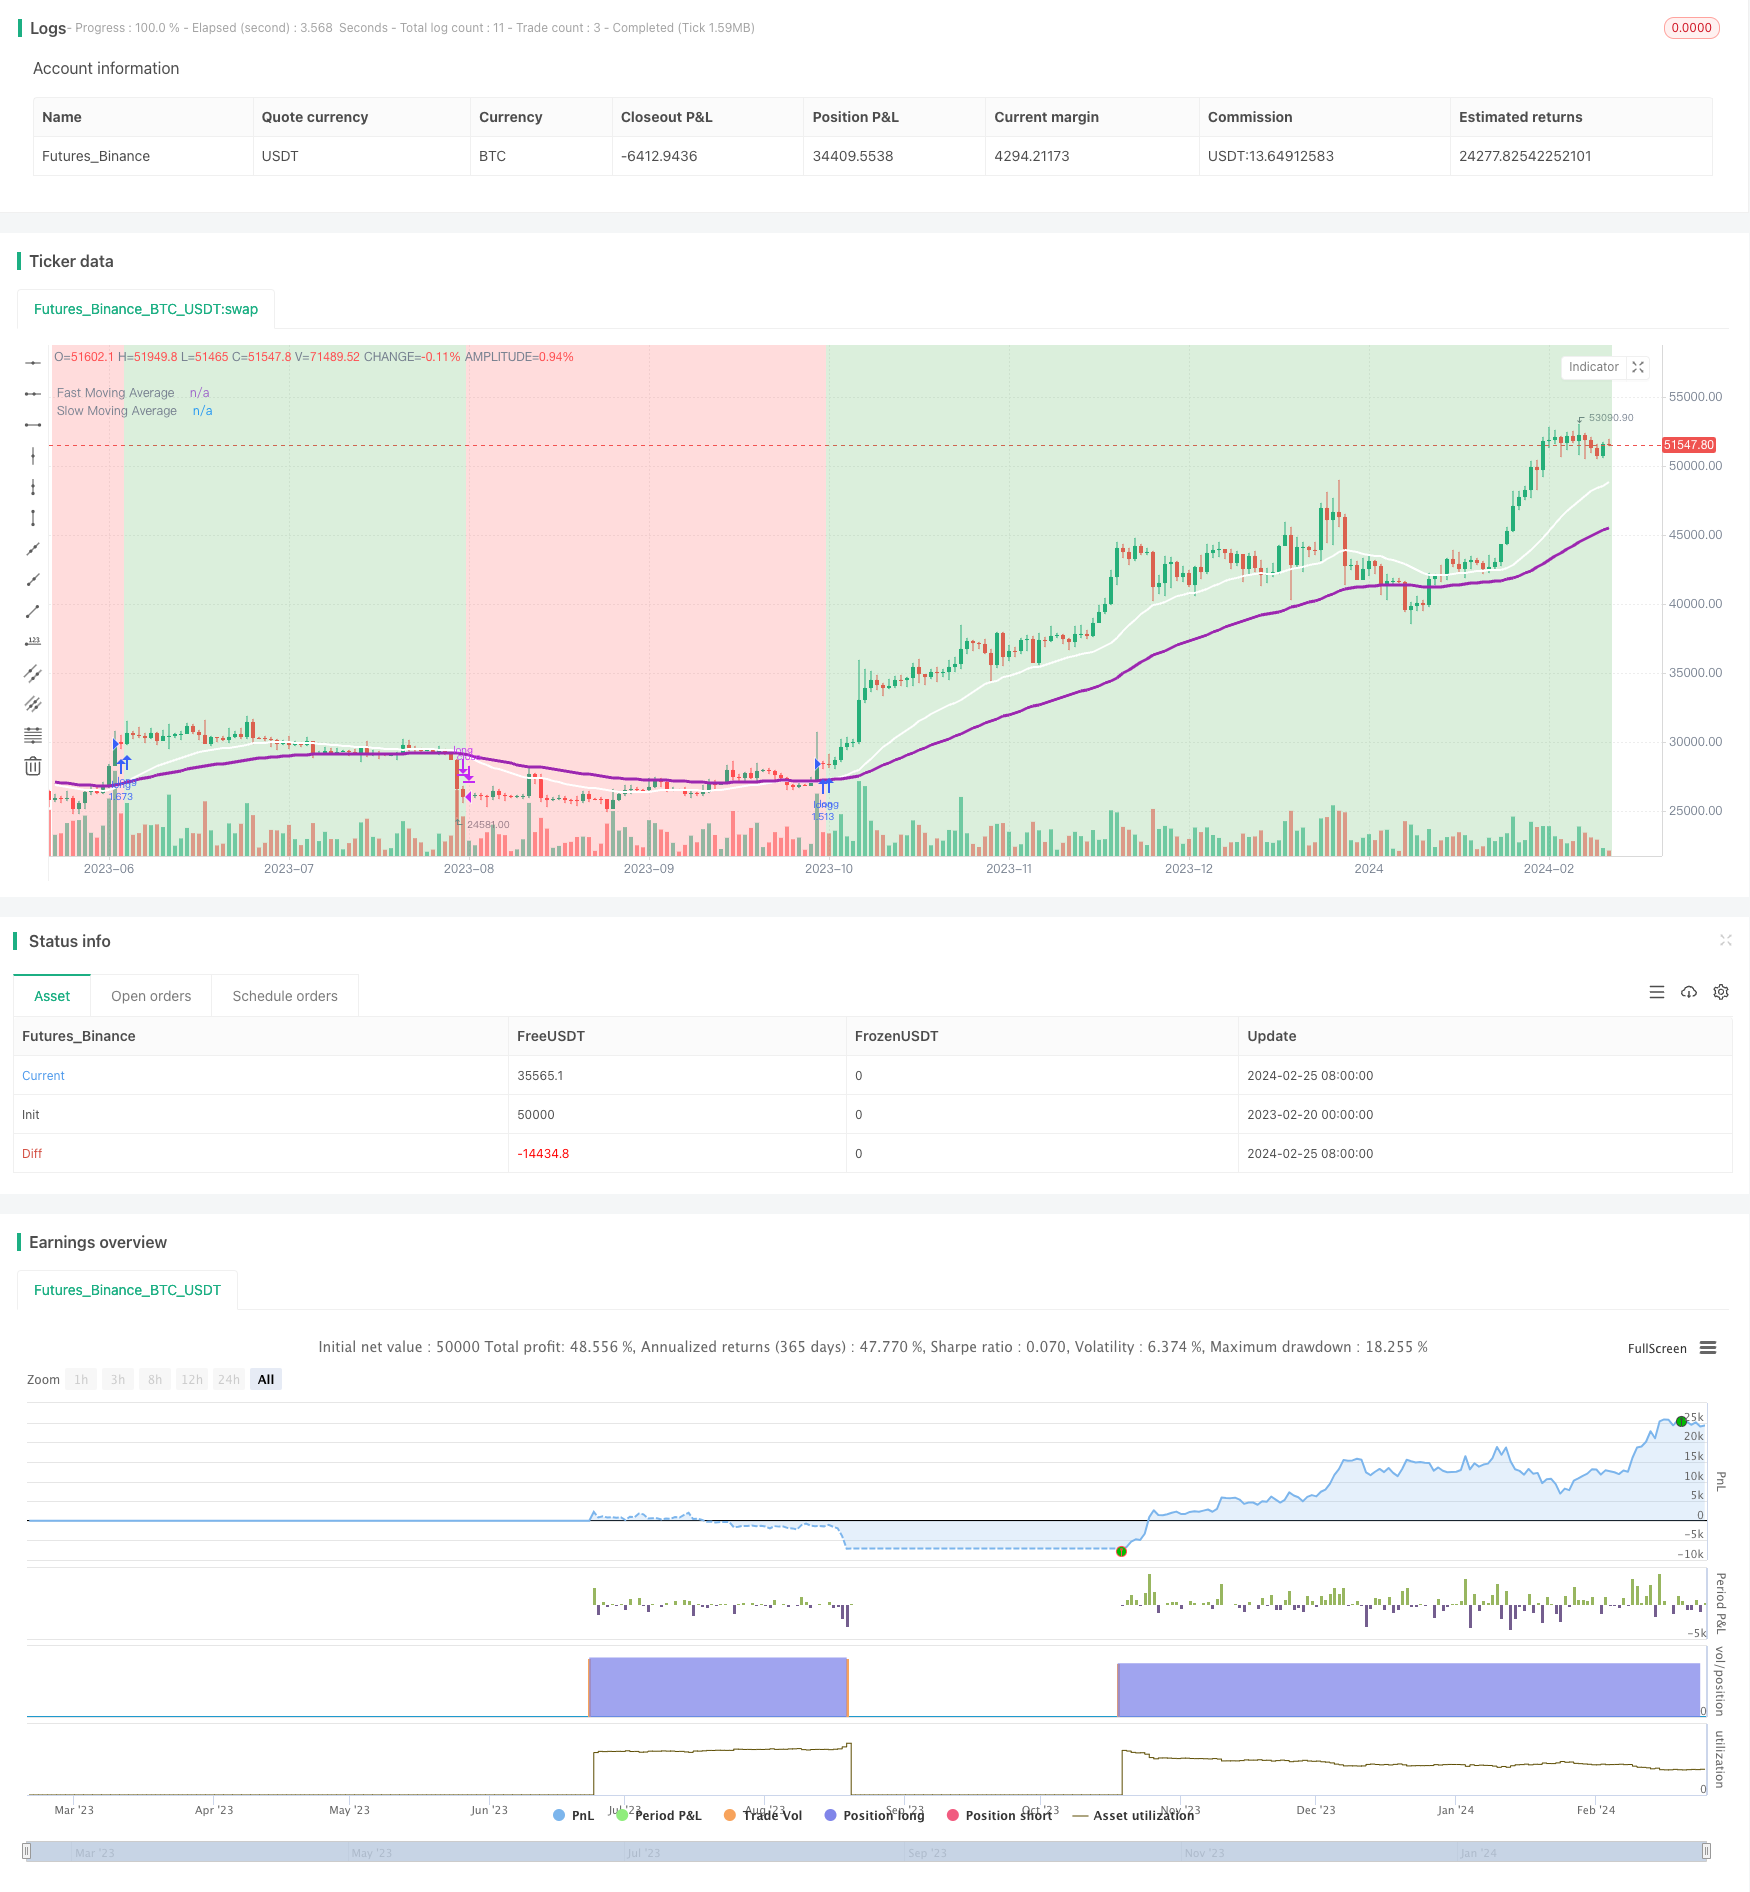
概述
快慢均线交叉策略是一种简单移动平均线策略。它使用两条移动平均线,一快一慢,当快速移动平均线从下方上穿慢速移动平均线时做多,表示价格可能上涨;当快速移动平均线从上方下穿慢速移动平均线时平仓,表示价格可能下跌。这可以作为预测未来价格行动的指标。
策略原理
该策略使用两条移动平均线,一快一慢。具体来说,快速移动平均线长度默认为25周期,慢速移动平均线长度默认为62周期。策略允许选择不同类型的移动平均线,包括SMA、EMA、WMA、RMA和VWMA。
当快速移动平均线从下方上穿越慢速移动平均线时,表示短期价格开始突破长期价格,属于典型的黄金交叉信号,预示着价格可能进入上涨通道,这时策略做多;当快速移动平均线从上方下穿慢速移动平均线时,表示短期价格开始跌破长期价格,属于死亡交叉信号,预示着价格可能进入下跌通道,这时策略平仓。
这样,通过快慢均线的交叉来判断价格趋势和方向,并相应做多或者平仓,从而实现盈利。
优势分析
该策略具有以下优势:
- 思路简单,容易理解和实现
- 参数设置灵活,可自定义快慢均线的周期和类型
- 可靠指标,快慢均线交叉对价格趋势判断准确
- 实现自动化,无需人工判断,降低心理因素影响
- 适用于多品种,可广泛运用于股指、外汇、加密货币等品种
- 容易优化,可调整参数组合寻找更佳配置
- 可扩展性强,可与其他指标或策略组合运用
总的来说,该策略以快慢均线交叉为核心交易信号,判断价格未来趋势的能力较强,基于趋势跟踪的优点,可以获得不错的盈利,值得实战应用。
风险分析
该策略也存在一些潜在风险:
- 快慢均线交叉信号可能出现误报,价格只是出现了短期的调整而非长期趋势反转
- 长短均线选取不当可能导致交易频繁或错过良机
- 价格剧烈波动时,快慢均线交叉信号可能不明显
- 交易费用较高品种,交叉信号交易次数过于频繁则损耗收益
- 可扩展性较强也带来过度优化的风险
针对这些风险,可以通过以下方法加以控制和改进:
- 结合其他指标进行过滤,避免误报,例如量价背离指标
- 调整均线参数,找到最佳组合,降低错误交易概率
- 在剧烈行情中暂停策略,避开大的波动
- 适当放宽停损幅度,减少不必要的损失
- 多品种回测,评估风险,防止过优化
优化方向
该策略主要可优化的方向包括:
快速均线和慢速均线的周期选取:当前默认参数可能不是最优,可以尝试不同周期参数寻找最佳配置
移动平均线类型的选择:当前提供了多种移动平均线可选择,可以测试哪种类型对特定品种效果最好
与其他指标或策略的组合:可尝试与波动率指标、量价指标或趋势跟踪策略组合,提高效果
参数自适应优化:让均线周期参数根据市场波动率和流动性自动调整,提高稳定性
AI模型辅助:使用机器学习算法分析大量数据,自动寻找最优交易规则
通过这些优化手段,有望进一步提升策略的收益表现和稳定性。
总结
快慢均线交叉策略整体而言是一种非常实用的趋势跟踪策略。它把握住了价格在不同时间尺度上的变化规律,通过快速均线突破慢速均线判断价格可能的未来趋势和方向。策略思路简单清晰,容易理解和实现,参数可定制灵活,同时可靠性较高,自动化程度高,适用范围广,可扩展性强。当然也存在一定的误报风险,需要与其他指标组合使用以发挥最大效果。通过不断测试和优化,该策略有望在实盘中取得较好的稳定盈利。
/*backtest
start: 2023-02-20 00:00:00
end: 2024-02-26 00:00:00
period: 1d
basePeriod: 1h
exchanges: [{"eid":"Futures_Binance","currency":"BTC_USDT"}]
*/

//@version=5
//Author @divonn1994

initial_balance = 100
strategy(title='Fast v Slow Moving Averages Strategy', shorttitle = 'Fast v Slow', overlay=true, pyramiding=0, default_qty_value=100, default_qty_type=strategy.percent_of_equity, precision=7, currency=currency.USD, commission_value=0.1, commission_type=strategy.commission.percent, initial_capital=initial_balance)

//Input for number of bars for moving average, Switch to choose moving average type, Display Options and Time Frame of trading----------------------------------------------------------------

fastBars = input.int(25, "Fast moving average length", minval=1)
slowBars = input.int(62, "Slow moving average length", minval=1)
strategy = input.string("EMA", "MA type", options = ["EMA", "VWMA", "SMA", "RMA", "WMA"])

redOn = input.string("On", "Red Background Color On/Off", options = ["On", "Off"], group='Display')
greenOn = input.string("On", "Green Background Color On/Off", options = ["On", "Off"], group='Display')
maOn = input.string("On", "Moving Average Plot On/Off", options = ["On", "Off"], group='Display')

startMonth = input.int(title='Start Month 1-12 (set any start time to 0 for furthest date)', defval=1, minval=0, maxval=12, group='Beginning of Strategy')
startDate = input.int(title='Start Date 1-31 (set any start time to 0 for furthest date)', defval=1, minval=0, maxval=31, group='Beginning of Strategy')
startYear = input.int(title='Start Year 2000-2100 (set any start time to 0 for furthest date)', defval=2011, minval=2000, maxval=2100, group='Beginning of Strategy')

endMonth = input.int(title='End Month 1-12 (set any end time to 0 for today\'s date)', defval=0, minval=0, maxval=12, group='End of Strategy')
endDate = input.int(title='End Date 1-31 (set any end time to 0 for today\'s date)', defval=0, minval=0, maxval=31, group='End of Strategy')
endYear = input.int(title='End Year 2000-2100 (set any end time to 0 for today\'s date)', defval=0, minval=0, maxval=2100, group='End of Strategy')

//Strategy Calculations-----------------------------------------------------------------------------------------------------------------------------------------------------------------------

inDateRange = true

maMomentum = switch strategy
    "EMA" => (ta.ema(close, fastBars) >= ta.ema(close, slowBars)) ? 1 : -1
    "SMA" => (ta.sma(close, fastBars) >= ta.sma(close, slowBars)) ? 1 : -1
    "RMA" => (ta.rma(close, fastBars) >= ta.rma(close, slowBars)) ? 1 : -1
    "WMA" => (ta.wma(close, fastBars) >= ta.wma(close, slowBars)) ? 1 : -1
    "VWMA" => (ta.vwma(close, fastBars) >= ta.vwma(close, slowBars)) ? 1 : -1
    =>
        runtime.error("No matching MA type found.")
        float(na)

fastMA = switch strategy
    "EMA" => ta.ema(close, fastBars)
    "SMA" => ta.sma(close, fastBars)
    "RMA" => ta.rma(close, fastBars)
    "WMA" => ta.wma(close, fastBars)
    "VWMA" => ta.vwma(close, fastBars)
    =>
        runtime.error("No matching MA type found.")
        float(na)

slowMA = switch strategy
    "EMA" => ta.ema(close, slowBars)
    "SMA" => ta.sma(close, slowBars)
    "RMA" => ta.rma(close, slowBars)
    "WMA" => ta.wma(close, slowBars)
    "VWMA" => ta.vwma(close, slowBars)
    =>
        runtime.error("No matching MA type found.")
        float(na)

//Enter or Exit Positions--------------------------------------------------------------------------------------------------------------------------------------------------------------------

if ta.crossover(maMomentum, 0)
    if inDateRange
        strategy.entry('long', strategy.long, comment='long')
if ta.crossunder(maMomentum, 0)
    if inDateRange
        strategy.close('long')

//Plot Strategy Behavior---------------------------------------------------------------------------------------------------------------------------------------------------------------------

plot(series = maOn == "On" ? fastMA : na, title = "Fast Moving Average", color = color.new(color.white,0), linewidth=2, offset=1)
plot(series = maOn == "On" ? slowMA : na, title = "Slow Moving Average", color = color.new(color.purple,0), linewidth=3, offset=1)
bgcolor(color = inDateRange and (greenOn == "On") and maMomentum > 0 ? color.new(color.green,75) : inDateRange and (redOn == "On") and maMomentum <= 0 ? color.new(color.red,75) : na, offset=1)