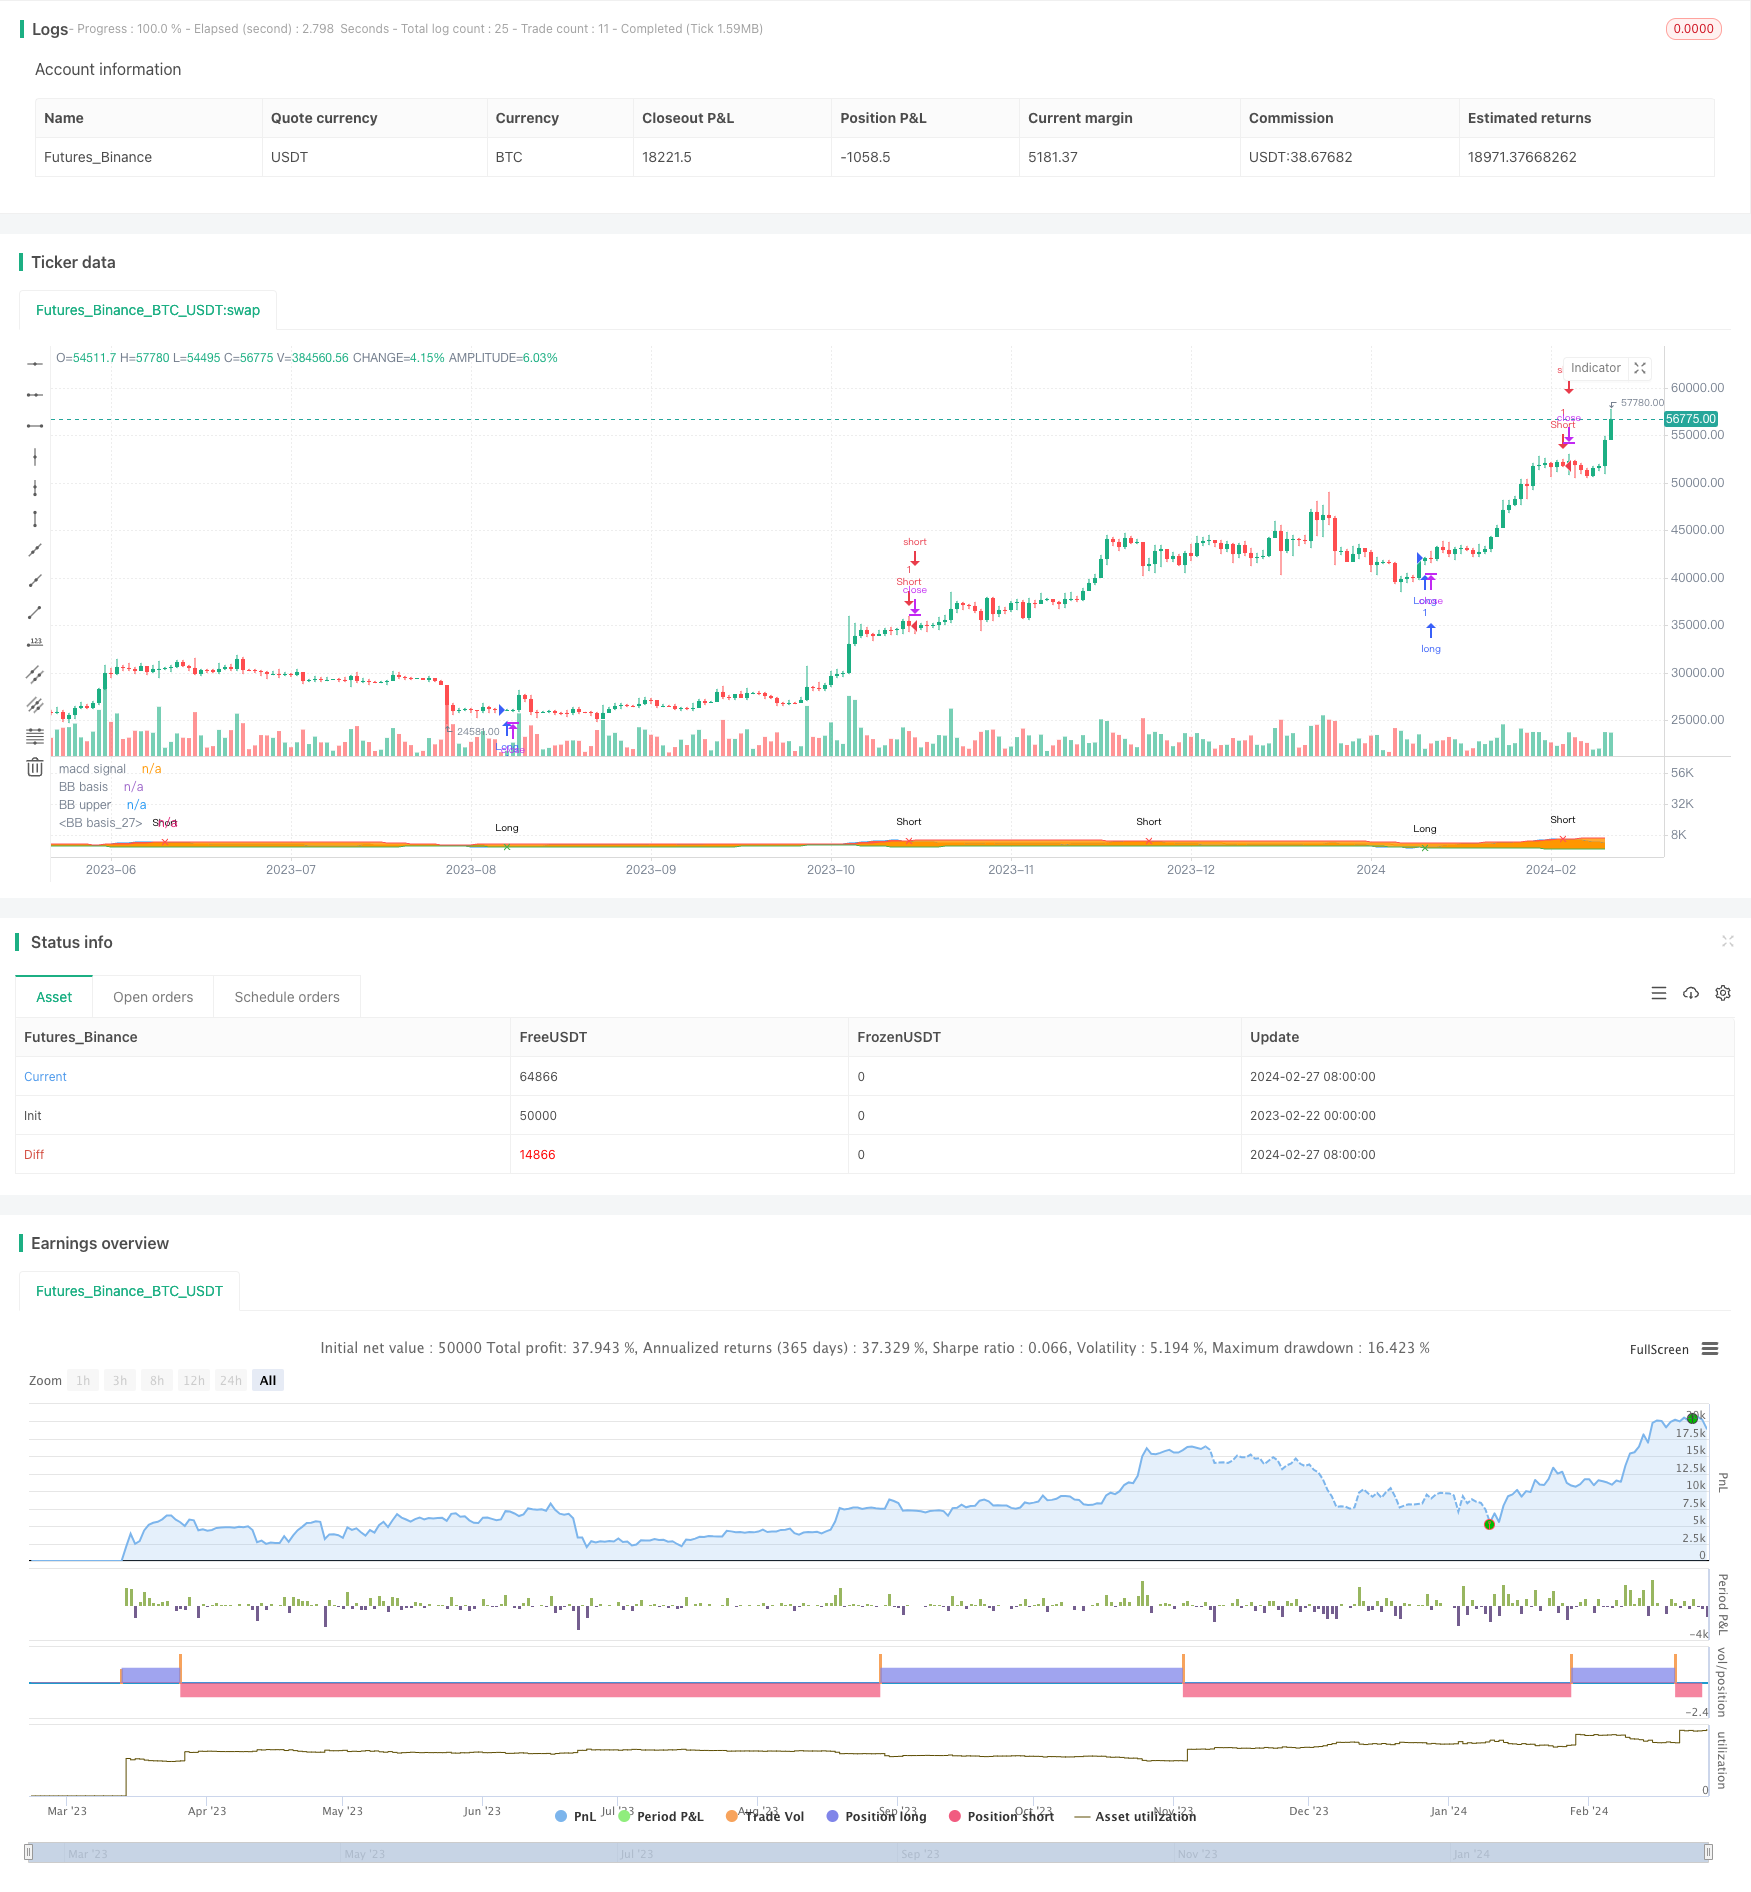
概述
本策略名称为“Momentum Trend”,它结合了MACD指标和布林带指标的优势,实现了一个趋势跟踪策略。该策略使用MACD的快线和慢线构建布林带,布林带的中线为MACD的信号线。当价格突破布林带上轨时看空,当价格突破布林带下轨时看多。它等待价格回调测试布林带中线附近再入场,以追踪中长线趋势。
策略原理
该策略的核心指标为MACD和布林带。其中,MACD指标由快线、慢线和MACD差值组成。快线一般取12日EMA,慢线取26日EMA。它们的差值就是MACD柱子。该策略则利用快线和慢线的差值作为布林带的基础中线,中线周围设定上下轨,并绘制布林带。
当价格从下向上突破布林带下轨时产生买入信号;当价格从上向下突破布林带上轨时产生卖出信号。为了减少被套和错失反转机会的可能性,本策略并不在轨道突破时立即入场,而是等待价格回调测试布林带中线时再入场。
此外,布林带上轨和下轨也可作为阻力位和支撑位来利用。当价格上涨时上轨是阻力,下轨是支撑;当价格下跌时上轨是支撑,下轨是阻力。
优势分析
该策略结合MACD和布林带两个指标的优势实现了趋势追踪,具有如下优势:
MACD具有较强的趋势判断能力,布林带带有自适应性调整,两者组合可以有效判断趋势转折点。
回调入场可以有效规避止损风险,追踪中长线趋势。
利用布林带上的阻力和支撑可以进一步锁定获利。
MACD和布林带参数可以灵活调整,适用于多种市场环境。
风险分析
该策略也存在一些风险需要注意:
在震荡趋势中,MACD和布林带可能出现多次失效信号。这时需要降低仓位规模避免巨额亏损。
回调入场时需要设定止损,避免回调过深导致亏损扩大。
布林带参数需要根据市场波动率调整,如果参数设置不当则会增加假突破概率。
良好的风险管理和仓位控制是该策略取得持续盈利的关键。单纯依赖策略信号容易忽视总体风险。
优化方向
该策略还可从以下几个方向进行优化:
优化MACD的参数,改为8日快线,20日慢线,根据不同品种和周期调整,提高指标灵敏度。
增加向上向下趋势判断,优化布林带参数,降低震荡市假信号率。
增加止损策略,利用布林带上下轨位设置止损线,控制风险。
结合其他指标框架进行验证,提高策略稳定性。
总结
基于MACD和布林带的Momentum Trend策略,通过指标组合追踪中长线趋势,回调入场降低风险。它优化了参数设置,控制了风险,在趋势品种中表现较佳。但任何策略都无法完美,需要我们从多个角度不断优化和改进,使之适应多变的市场环境。
/*backtest
start: 2023-02-22 00:00:00
end: 2024-02-28 00:00:00
period: 1d
basePeriod: 1h
exchanges: [{"eid":"Futures_Binance","currency":"BTC_USDT"}]
*/

//@version=4
//Simple strategy based on MACD and Bollinger Bands, where BBs are calculatend from macd signal.
strategy("Strategy MACD vs BB", overlay=false)

fast_length = input(title="Fast MA period", type=input.integer, defval=8)
slow_length = input(title="Slow MA period", type=input.integer, defval=21)
src = input(close,"Source")


// ----------MA calculation - ChartArt-------------
smoothinput = input(1, minval=1, maxval=4, title='Moving Average Calculation: (1 = SMA), (2 = EMA), (3 = WMA), (4 = Linear)')

fast_ma = smoothinput == 1 ? sma(src, fast_length):smoothinput == 2 ? ema(src, fast_length):smoothinput == 3 ? wma(src, fast_length):smoothinput == 4 ? linreg(src, fast_length,0):na
slow_ma = smoothinput == 1 ? sma(src, slow_length):smoothinput == 2 ? ema(src, slow_length):smoothinput == 3 ? wma(src, slow_length):smoothinput == 4 ? linreg(src, slow_length,0):na
//----------------------------------------------
macd = fast_ma - slow_ma
p1=plot(macd,"macd signal",color=color.blue)
length = input(40, minval=1)
mult = input(2.0,"BB multiplier")

basis = sma(macd, length)
dev = mult * stdev(macd, length)
plot(basis,"BB basis",color=color.orange)
upper = basis + dev
lower = basis - dev
p2=plot(upper,"BB upper",color=color.red)
p3=plot(lower,"BB basis",color=color.green)

longCondition = crossover(macd, lower)
shortCondition = crossunder(macd, upper)

plotshape(longCondition?lower:na, title="Long", style=shape.xcross, location=location.absolute, text="Long", color=color.green, transp=0, size=size.tiny)
plotshape(shortCondition?upper:na, title="Short", style=shape.xcross, location=location.absolute, text="Short", color=color.red, transp=0, size=size.tiny)
fill(p1,p3,color=macd<lower?color.green:na,transp=90,title="support")
fill(p1,p2,color=macd>upper?color.red:na,transp=90,title="resistance")

if longCondition
    strategy.entry("Long",strategy.long)
if shortCondition
    strategy.entry("Short",strategy.short)