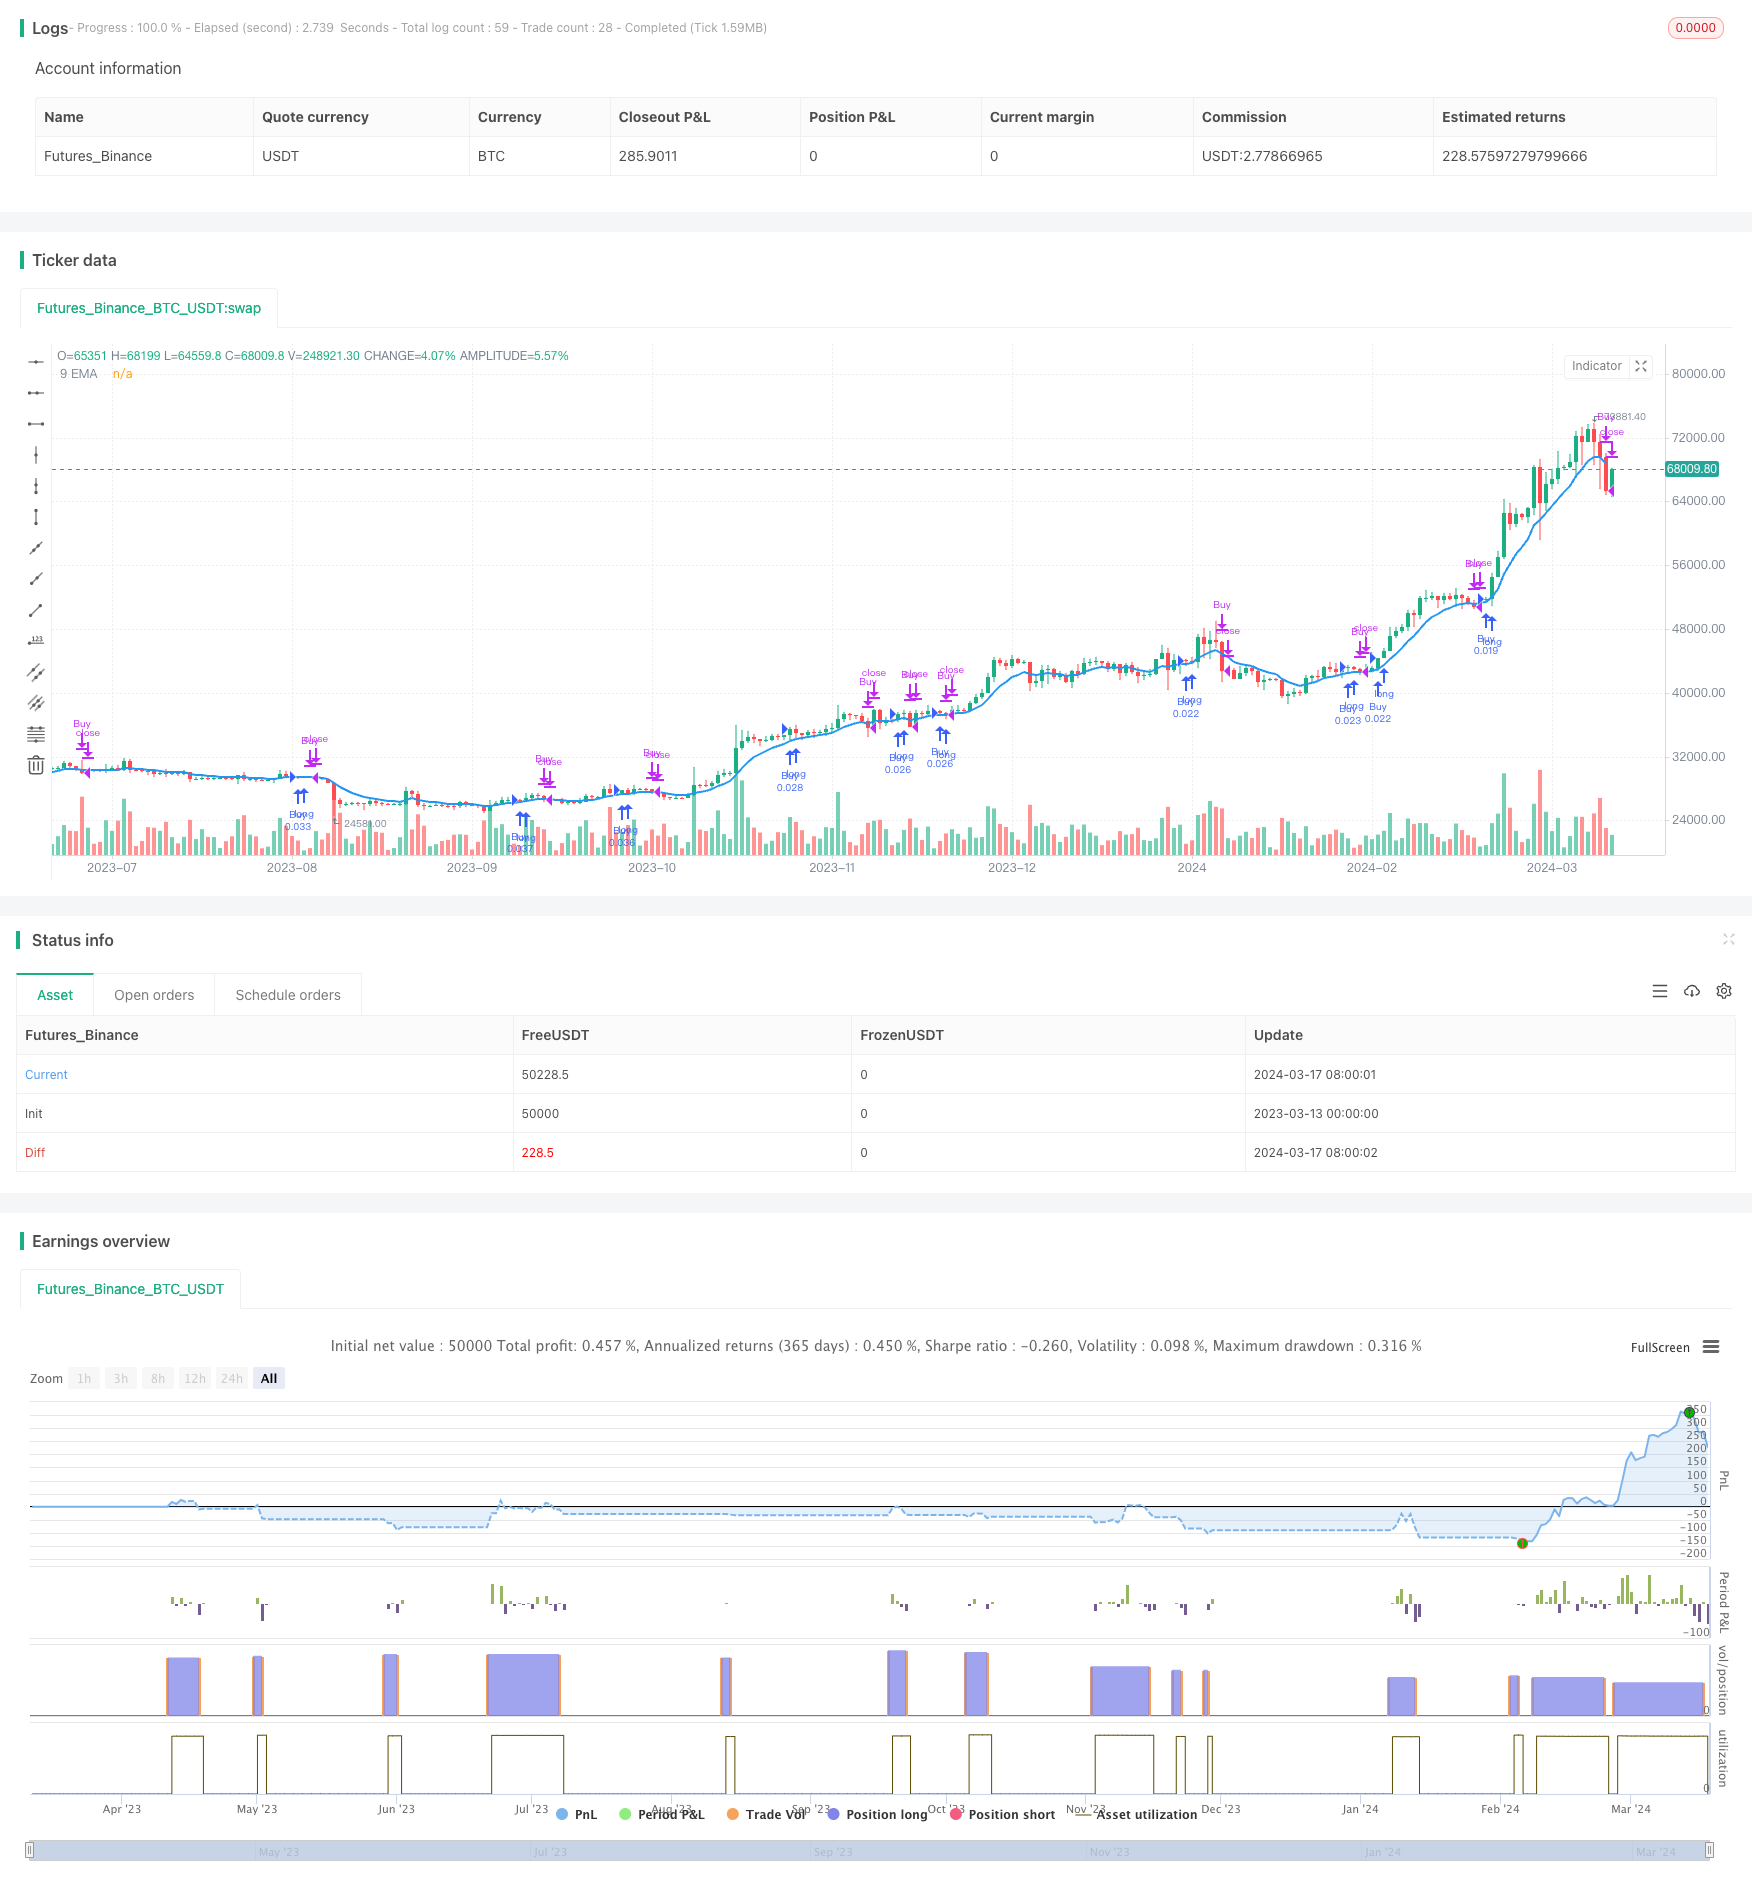
9EMA Dynamic Position Sizing Strategy with Two 5-Minute Close Breakouts

Author: ChaoZhang, Date: 2024-03-19 15:03:56
Tags:

img

Strategy Overview

This strategy uses the 9-period Exponential Moving Average (9EMA) as the basis for trend determination. Within the first 10 minutes of the trading day, if there are two consecutive 5-minute candles with closing prices very close to the high (greater than or equal to 99% of the high) and above the 9EMA, it is considered a strong breakout signal. At this point, the position size is calculated based on the current closing price, and a long position is opened. The position is held until the first 5-minute candle with a close below the 9EMA, at which point the position is closed.

Strategy Principles

This strategy is based on the following principles:

  1. During the opening stage of a trading day, if the market shows a strong breakout trend, it usually indicates that the upward trend is likely to continue.
  2. The 9EMA is a relatively sensitive indicator for trend determination, and prices above the 9EMA often indicate bullish dominance.
  3. Two consecutive candles with closing prices very close to the high indicate strong bullish momentum and high buying enthusiasm.
  4. After a strong trend emerges, using a fixed monetary amount to determine position size can both control risk and fully utilize the trend.
  5. When the price falls below the 9EMA, it often indicates a reversal of the trend. Closing the position at this point can protect profits to the greatest extent.

This strategy aims to capture strong breakout moves during the opening period of a trading day and participates with dynamic position sizing, seeking to achieve high returns with low risk. At the same time, the strategy also employs strict stop-loss conditions, promptly closing positions once the trend reverses to control drawdowns.

Strategy Advantages

  1. Trading is concentrated within the first 10 minutes of the opening, capturing early market moves with low trading frequency and strong operability.
  2. Using two consecutive candles to confirm the trend can effectively filter out false breakouts and improve signal reliability.
  3. Position size is dynamically adjusted based on the price level at the breakout point, automatically adapting to the characteristics of different market periods with controllable risk.
  4. Stop-loss conditions are clear and strictly executed, effectively controlling the maximum loss of a single trade.
  5. The strategy logic is simple and easy to understand and execute, suitable for most traders to use.

Strategy Risks

  1. Although trending opportunities often emerge during the opening period, there can also be significant fluctuations and reversals at times, facing a certain risk of false breakouts.
  2. The strategy enters a position when two consecutive candles meet the conditions. If the market quickly reverses after entry, there is still a possibility of facing certain losses.
  3. Although the fixed monetary amount position sizing method is simple, the strategy’s return volatility may also be relatively large when the market fluctuates dramatically.
  4. This strategy can only capture unilateral upward trends and is not suitable for ranging markets or downward trending markets.

To address the above risks, the following aspects can be considered for optimization and improvement:

  1. Incorporate the relationship between the opening price and the previous day’s closing price as a filtering condition to improve the accuracy of trend determination.
  2. Optimize stop-loss conditions, such as adding trailing stops or conditional stops, to further reduce the risk exposure of a single trade.
  3. Consider using a pyramid approach to add positions during the trend continuation phase to increase overall returns.
  4. Try combining this strategy with other strategies suitable for ranging or downward trending markets to improve the adaptability of the strategy.

Optimization Directions

  1. Introduce more effective trend determination indicators, such as MACD, Bollinger Bands, etc., to confirm trend signals based on multiple indicators, improving the reliability of entry signals and reducing the risk of false breakouts.
  2. Optimize the entry time window. Consider shortening the time window from 10 minutes to 5 minutes or extending it to 15 minutes. Through backtesting comparisons, find the optimal entry time. This can capture trends while minimizing the impact of initial fluctuations.
  3. In terms of position sizing, consider introducing a volatility factor. For example, dynamically adjust the percentage of funds for each entry based on the Average True Range (ATR). Decrease position size when volatility is high and increase position size when volatility is low, allowing the strategy to better adapt to different market rhythms.
  4. Optimize stop-loss conditions. While maintaining the original 9EMA stop-loss logic, a trailing stop strategy can be added. That is, after the price moves in a favorable direction by a certain percentage, move the stop-loss level to near the cost price or entry price, thereby reducing drawdowns and locking in partial profits.
  5. Consider adding some filtering conditions, such as trading volume, volatility, etc. When an entry signal appears, determine whether these indicators are simultaneously favorable to further confirm the validity of the trend. This can help the strategy avoid some traps and false signals.

Through the above optimizations, the strategy is expected to better control risks while capturing trends, improving the stability and sustainability of strategy returns. Of course, any optimization needs to be validated through rigorous backtesting and dynamically adjusted based on actual conditions.

Summary

This strategy uses the 9EMA as the core and captures strong upward trends within the first 10 minutes of a trading day by having two consecutive 5-minute candles with closing prices strongly breaking above the 9EMA. It trades using a fixed monetary amount to dynamically adjust position size. The strategy logic is simple and straightforward, easy to understand and execute, and suitable for most traders to use. At the same time, the strategy also has certain limitations and risks, such as insufficient adaptability to ranging markets and downward trending markets, as well as the risk of rapid reversals after opening positions. To address these issues, improvements and optimizations can be made in terms of trend determination, position sizing, stop-loss optimization, filtering conditions, etc., to enable the strategy to better capture market opportunities and control risks. Overall, this strategy has a clear thought process and strong plasticity, and is worth further exploration and practice.


/*backtest
start: 2023-03-13 00:00:00
end: 2024-03-18 00:00:00
period: 1d
basePeriod: 1h
exchanges: [{"eid":"Futures_Binance","currency":"BTC_USDT"}]
*/

//@version=5
strategy("Two 5min Closes Above 9EMA Strategy with Dynamic Position Size", overlay=true)

// Define the fixed amount for position sizing
fixedAmount = 1000

// Calculate the 9-period EMA
ema9 = ta.ema(close, 9)

// Define time constraints (9:30 AM to 9:40 AM EST, adjust for your timezone)
sessionStart = 0930
sessionEnd = 0940
timeCondition = (hour * 100 + minute) >= sessionStart and (hour * 100 + minute) < sessionEnd

// Detect two consecutive 5-min bars where close is near 0.99 times the high and above 9 EMA
closeNearHighAndAboveEMA = close >= high * 0.99 and close > ema9
twoConsecutiveBars = closeNearHighAndAboveEMA and closeNearHighAndAboveEMA[1]

// Entry condition: Within the first 10 minutes of the day and two consecutive bars match criteria
entryCondition = twoConsecutiveBars

// Exit condition: First 5-min close below 9 EMA after entry
exitCondition = close < ema9

// Plot EMA for visualization
plot(ema9, color=color.blue, linewidth=2, title="9 EMA")

// Calculate position size
positionSize = fixedAmount / close

// Strategy execution
if (entryCondition)
    strategy.entry("Buy", strategy.long, qty=positionSize)

if (exitCondition)
    strategy.close("Buy")


More