资源加载中... loading...

Dual Moving Average Crossover with Optimized Stop Loss Strategy

Author: ChaoZhang, Date: 2024-03-22 14:53:59
Tags:

img

Strategy Overview

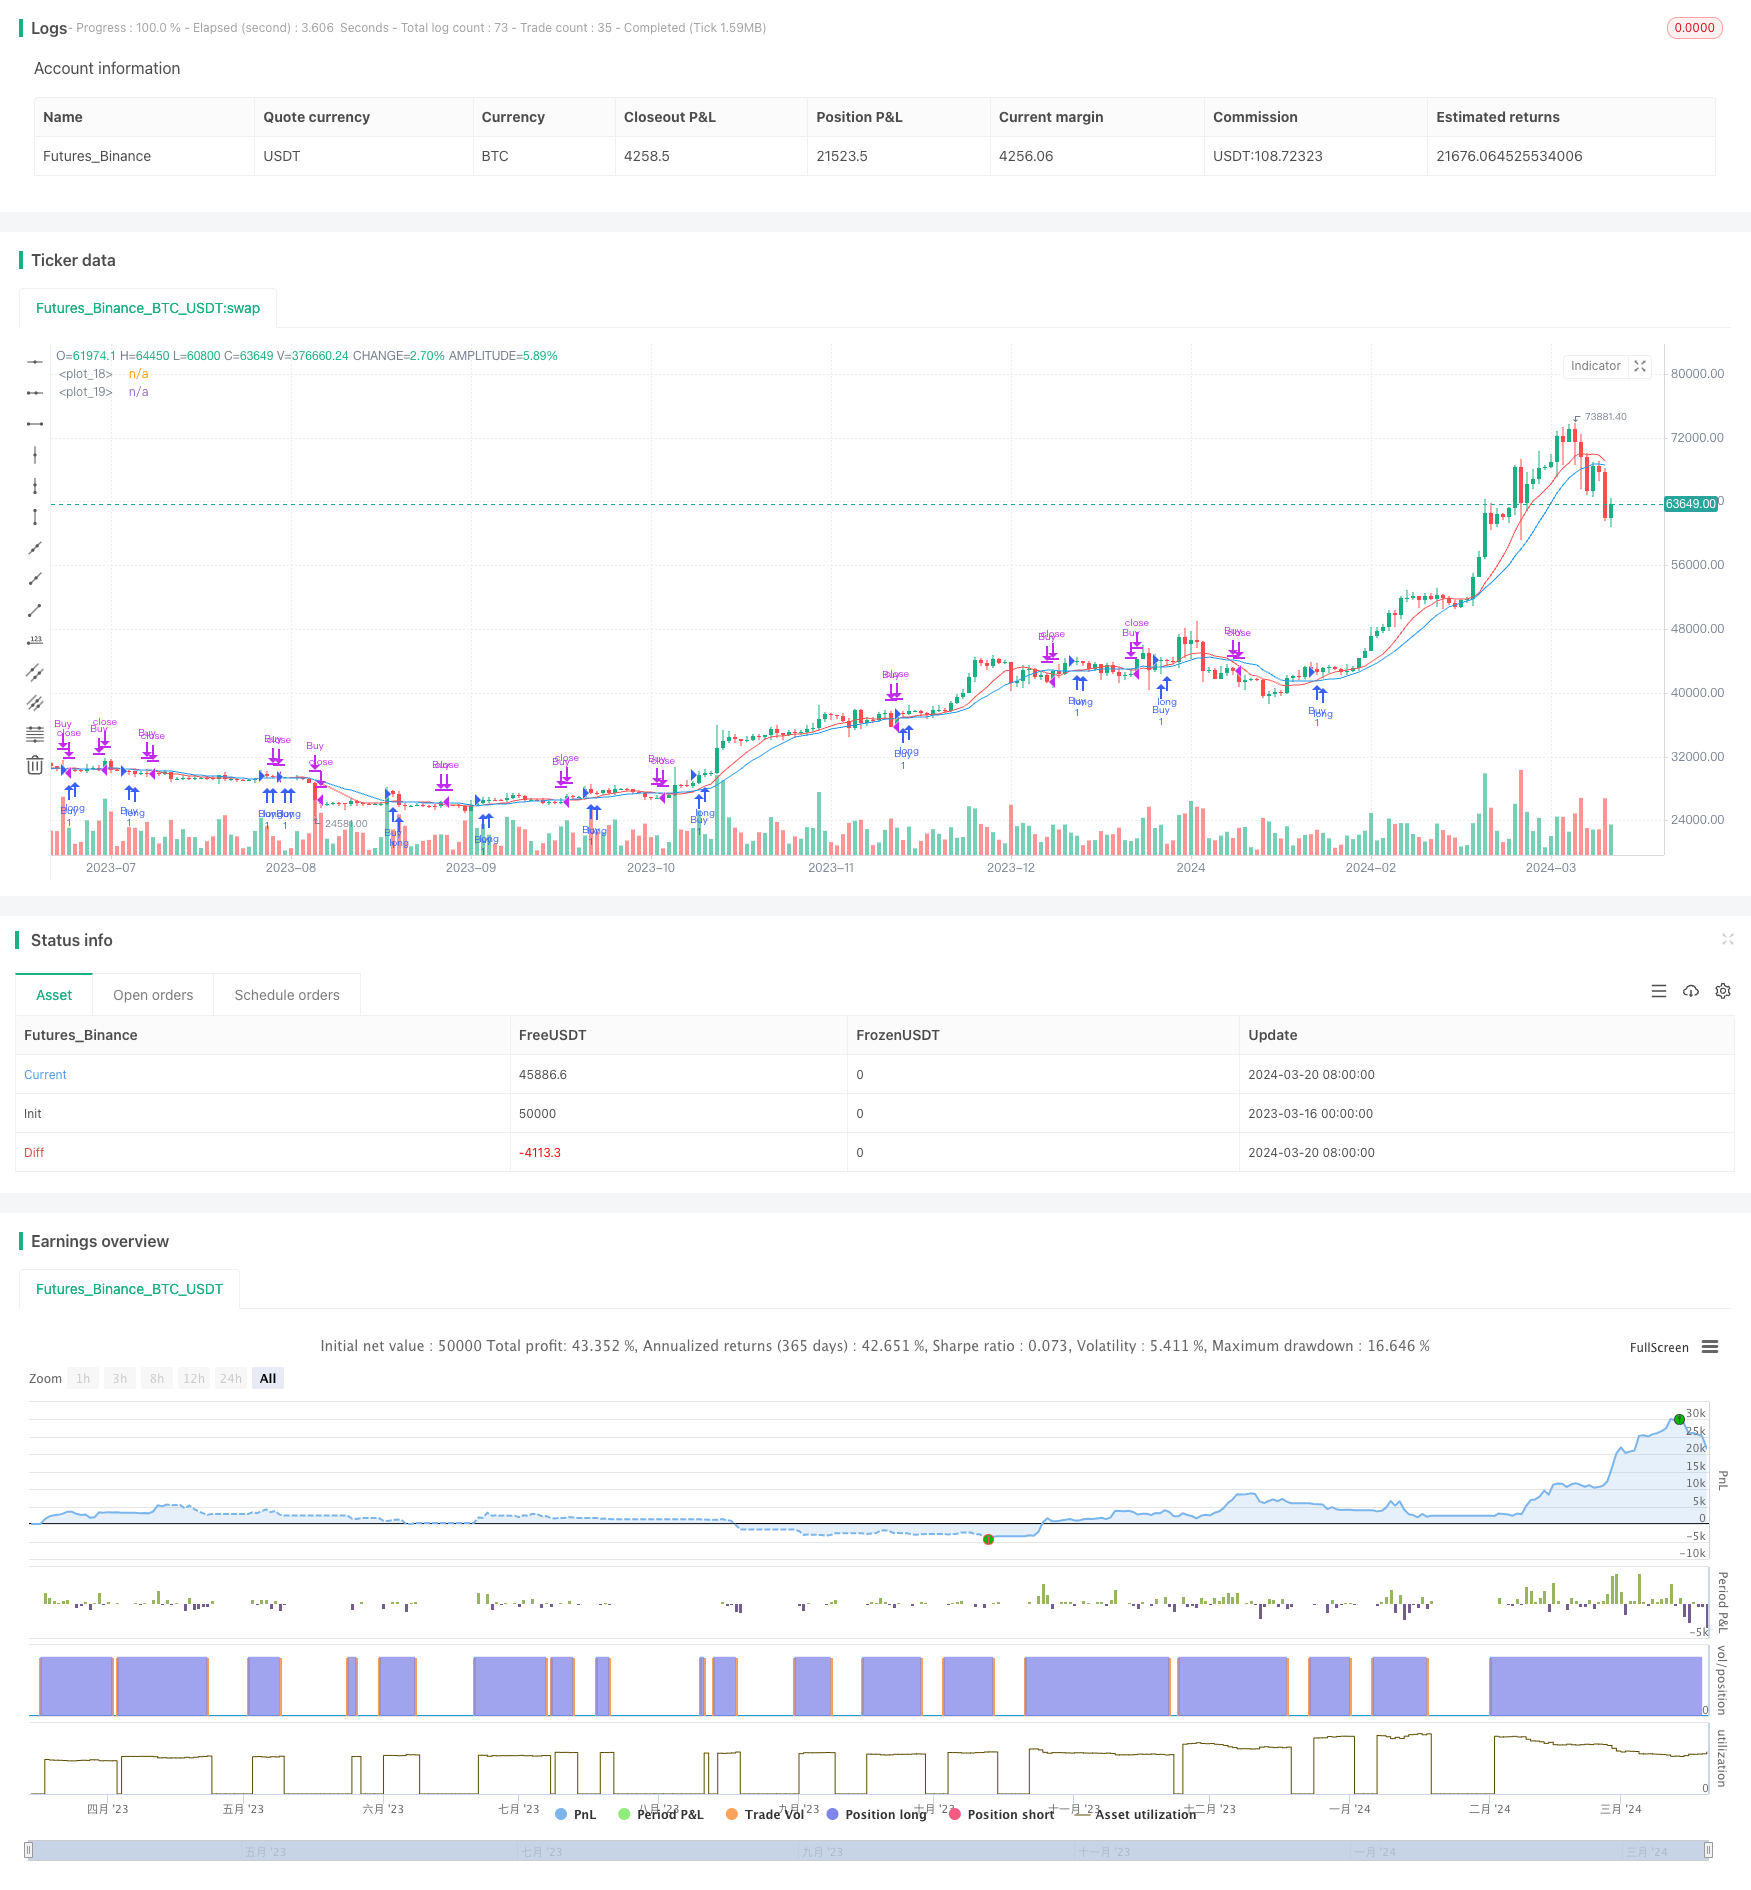
The Dual Moving Average Crossover with Optimized Stop Loss Strategy (TQQQ) is a quantitative trading strategy based on the crossover signals of two moving averages (SMA) with different periods. The strategy only takes long positions, opening a position when the fast moving average crosses above the slow moving average and closing the position when the fast moving average crosses below the slow moving average or when the price falls below the stop loss level. The strategy optimizes the periods of the fast and slow moving averages and the stop loss percentage, aiming to achieve higher returns in bull markets while reducing losses during market downturns.

Strategy Principle

The core of this strategy is to use the crossover signals of moving averages with different periods to capture market trends. When the short-term moving average crosses above the long-term moving average, it indicates a potential uptrend, and the strategy opens a long position. When the short-term moving average crosses below the long-term moving average, it suggests that the uptrend may have ended, and the strategy closes the position.

In addition to the moving average crossover signals, the strategy also incorporates a stop loss mechanism. When the market price falls below a fixed percentage stop loss level, the strategy exits the position, even if the moving averages have not generated a closing signal. The purpose of this mechanism is to control drawdown and prevent significant losses during trend reversals.

Specifically, the strategy includes the following steps:

  1. Calculate the fast moving average and the slow moving average.
  2. Determine whether there is an opening signal. When the fast moving average crosses above the slow moving average and there is no current position, open a long position.
  3. Record the opening price and calculate the stop loss level.
  4. Determine whether there is a closing signal. When the fast moving average crosses below the slow moving average or the price falls below the stop loss level, close all long positions.
  5. Based on the closing price, determine whether there is an opportunity to open or close a position on the next trading day, and repeat steps 2-4.

Through this series of steps, the strategy can quickly adapt to changes in market trends, following the trend in bull markets to obtain substantial profits while timely cutting losses during market downturns to control drawdown.

Strategy Advantages

  1. Trend Following: By using moving average crossover signals, the strategy can capture market trends, holding positions during uptrends to obtain trend-following returns.

  2. Stop Loss Mechanism: The fixed percentage stop loss can effectively control drawdown and avoid excessive losses from a single trade.

  3. Parameter Flexibility: The period parameters of the fast and slow moving averages and the stop loss percentage can be adjusted according to market characteristics and personal risk preferences, increasing the adaptability of the strategy.

  4. Wide Applicability: The strategy can be applied to various markets and instruments, such as stocks, futures, and foreign exchange, only requiring parameter adjustments based on the characteristics of the instrument.

  5. Simplicity and Efficiency: The strategy logic is clear and easy to understand and implement. It has high backtesting efficiency, facilitating extensive parameter optimization and simulated trading.

Strategy Risks

  1. Parameter Sensitivity: The selection of moving average periods and stop loss percentage has a significant impact on strategy performance. Inappropriate parameters may lead to frequent trading or missing trend opportunities.

  2. Trend Recognition Lag: The moving average crossover signals have a certain lag, especially when the market changes rapidly, potentially missing the best timing for opening and closing positions.

  3. Concentrated Positions: The strategy always maintains a 100% position, lacking position management and capital allocation mechanisms, facing higher capital risk.

  4. Poor Performance in Sideways Markets: In sideways markets, frequent crossover signals may lead to strategy losses.

  5. Black Swan Events: In extreme market conditions, trading signals may fail, and the fixed stop loss percentage may not cover actual risks.

To address these risks, the strategy can be optimized and improved in the following aspects:

  1. Introduce Dynamic Stop Loss: Dynamically adjust the stop loss percentage based on market volatility or price levels to adapt to different market conditions.

  2. Optimize Opening and Closing Signals: Combine other technical indicators such as MACD and RSI to improve the accuracy and timeliness of trend recognition.

  3. Introduce Position Management: Dynamically adjust positions based on indicators such as market trend strength and volatility to control drawdown risk.

  4. Incorporate Fundamental Analysis: Comprehensively consider macroeconomic and industry factors to avoid trading when fundamentals are unfavorable.

  5. Set an Overall Stop Loss Line: Set an account-level overall stop loss line for extreme market conditions to control capital risk.

Strategy Optimization

  1. Dynamic Stop Loss: Introduce indicators such as ATR and Bollinger Bands to dynamically adjust the stop loss percentage based on market volatility, loosening stop loss when trends are strong and tightening stop loss in sideways markets.

  2. Signal Optimization: Experiment with different moving average combinations, such as EMA and WMA, to find more sensitive and effective opening and closing signals. At the same time, consider using MACD, RSI, and other indicators as supplementary judgment.

  3. Position Management: Measure market trend strength using indicators such as ATR and ADX, increasing positions when trends are evident and reducing positions when trends are unclear. At the same time, set a maximum position limit and build and close positions in batches.

  4. Long-Short Hedging: Consider holding both long and short positions in sideways markets to hedge market risk. Market sentiment indicators such as the VIX fear index can be used to dynamically adjust the long-short ratio.

  5. Parameter Self-Adaptation: Use machine learning algorithms to automatically find the optimal parameter combinations for different markets and instruments, improving the adaptability and robustness of the strategy.

Through the above optimization methods, the strategy’s profitability and risk resistance can be further improved to better adapt to the ever-changing market environment.

Summary

The Dual Moving Average Crossover with Optimized Stop Loss Strategy (TQQQ) is a simple yet effective quantitative trading strategy. It captures market trends using the crossover signals of moving averages with different periods while controlling drawdown risk through a fixed stop loss percentage. The strategy logic is clear, easy to implement and optimize, and applicable to various markets and instruments.

By reasonably selecting moving average periods and stop loss percentage, the strategy can achieve substantial returns in bull markets. However, the strategy also faces risks such as parameter sensitivity, trend recognition lag, and concentrated positions. To address these risks, improvements and optimizations can be made in aspects such as dynamic stop loss, signal optimization, position management, long-short hedging, and parameter self-adaptation.

Overall, the Dual Moving Average Crossover with Optimized Stop Loss Strategy (TQQQ) is a quantitative trading strategy worth trying and further researching. Through continuous optimization and improvement, it has the potential to become a powerful tool for investors, helping them obtain stable returns in volatile markets. However, any strategy has its limitations, and investors need to flexibly apply and constantly adjust based on their own risk preferences and market views to go further on the path of quantitative trading.


/*backtest
start: 2023-03-16 00:00:00
end: 2024-03-21 00:00:00
period: 1d
basePeriod: 1h
exchanges: [{"eid":"Futures_Binance","currency":"BTC_USDT"}]
*/

//@version=4
strategy("SMA Crossover Strategy with Customized Stop Loss (Long Only)", overlay=true)

// Define input variables for SMA lengths and stop loss multiplier
fast_length = input(9, "Fast SMA Length")
slow_length = input(14, "Slow SMA Length")
stop_loss_multiplier = input(0.1, "Stop Loss Multiplier")

// Calculate SMA values
fast_sma = sma(close, fast_length)
slow_sma = sma(close, slow_length)

// Define entry and exit conditions
enter_long = crossover(fast_sma, slow_sma)
exit_long = crossunder(fast_sma, slow_sma)

// Plot SMAs on chart
plot(fast_sma, color=color.red)
plot(slow_sma, color=color.blue)

// Set start date for backtest
start_date = timestamp(2022, 01, 01, 00, 00)

// Filter trades based on start date
if time >= start_date
    if (enter_long)
        strategy.entry("Buy", strategy.long, when = strategy.position_size == 0)

    // Calculate stop loss level
    buy_price = strategy.position_avg_price
    stop_loss_level = buy_price * (1 - stop_loss_multiplier)

    // Exit trades
    if (exit_long or low <= stop_loss_level)
        strategy.close("Buy")

More