策略概述
基于趋势动量的多指标均线交叉策略是一种结合移动平均线、相对强弱指数(RSI)和移动平均线汇聚背离指标(MACD)的量化交易策略。该策略利用两条不同周期的移动平均线的交叉信号作为主要的交易信号,同时结合RSI和MACD两个常用的技术指标进行辅助判断,以捕捉市场趋势和动量变化,实现较为稳健的交易策略。
策略原理
该策略的核心原理是利用两条不同周期的移动平均线(快速均线和慢速均线)的交叉信号作为主要的买卖信号。当快速均线从下向上穿越慢速均线时,产生买入信号;反之,当快速均线从上向下穿越慢速均线时,产生卖出信号。这种均线交叉的方法可以较好地捕捉市场趋势的变化。
除了均线交叉信号外,该策略还引入了RSI和MACD两个技术指标作为辅助判断。RSI是一种衡量市场超买超卖状态的动量指标,当RSI大于70时,表明市场处于超买状态,此时策略会开仓做空;当RSI小于30时,表明市场处于超卖状态,此时策略会开仓做多。MACD则是一种趋势跟踪指标,由两条不同周期的指数移动平均线(EMA)构成,当MACD快线上穿慢线时,产生买入信号;反之,当MACD快线下穿慢线时,产生卖出信号。
在实际交易执行中,当均线交叉和MACD同时产生买入信号时,策略开仓做多;当均线交叉和MACD同时产生卖出信号时,策略平仓。此外,当慢速均线下穿收盘价时,策略会开仓做空。通过综合运用这些技术指标,该策略可以较为全面地把握市场趋势和动量变化,并根据不同的市场状态采取相应的交易操作。
策略优势
趋势跟踪能力强:通过均线交叉信号和MACD指标,该策略可以较好地捕捉市场趋势,顺应主要趋势进行交易。
动量判断准确:引入RSI指标,可以辨别市场的超买超卖状态,在趋势判断的基础上,结合动量信号进行交易决策,提高了策略的可靠性。
信号确认机制完善:通过均线交叉、MACD和RSI三个指标的共同确认,可以有效过滤掉假信号,提高信号的准确性。
适应性较强:该策略对于趋势性市场和震荡性市场都有一定的适应性,可以在不同的市场环境下动态调整仓位。
实现简单:策略逻辑清晰,使用的技术指标比较常见,易于理解和实现。
策略风险
参数优化风险:该策略涉及多个参数,如均线周期、RSI和MACD的参数设置等,不同参数的选择可能会对策略表现产生较大影响,因此需要对参数进行优化和测试,以找到最佳的参数组合。
市场风险:当市场出现剧烈波动或突发事件时,该策略可能会产生较大的回撤或损失。此外,当市场处于震荡或无明显趋势时,该策略的表现可能不如趋势性市场。
过拟合风险:该策略在历史数据上表现良好,并不能保证在未来的市场中同样有效。策略可能存在过拟合的风险,即在样本内表现优异,但样本外表现不佳。
交易成本风险:频繁的交易可能会产生较高的交易成本,如滑点、手续费等,这会侵蚀策略的盈利空间。
优化方向
动态调整参数:可以根据市场状态的变化,动态调整策略参数,如均线周期、RSI和MACD的阈值等,以适应不同的市场环境。这样可以提高策略的适应性和稳健性。
引入风险控制措施:可以通过设置止损止盈、仓位管理等风险控制措施,来降低策略的回撤和风险暴露。例如,可以根据市场波动率动态调整仓位大小,在波动加剧时减仓,在波动缓和时加仓。
结合其他技术指标或方法:可以考虑引入其他技术指标或方法,如布林带、波动率指标等,以丰富策略的信号来源,提高策略的稳健性和盈利能力。
优化交易执行:可以通过优化交易执行算法,如使用限价单、TWAP、VWAP等算法,来降低交易成本和市场冲击,提高策略的执行效率。
加强策略监控和评估:对策略进行实时监控和定期评估,及时发现和解决策略中出现的问题,并根据市场变化适时调整策略,以保持策略的有效性和稳定性。
总结
基于趋势动量的多指标均线交叉策略是一种综合运用移动平均线、RSI和MACD等技术指标的量化交易策略。该策略以均线交叉信号为主要买卖信号,同时结合RSI和MACD指标进行辅助判断,以捕捉市场趋势和动量变化。策略的优势在于趋势跟踪能力强、动量判断准确、信号确认机制完善、适应性较强且实现简单。但该策略也存在一定的风险,如参数优化风险、市场风险、过拟合风险和交易成本风险等。为了进一步改进策略,可以考虑动态调整参数、引入风险控制措施、结合其他技术指标或方法、优化交易执行以及加强策略监控和评估等方面。总的来说,基于趋势动量的多指标均线交叉策略是一种相对成熟和实用的量化交易策略,但在实际应用中需要根据具体的市场环境和交易目标进行适当的调整和优化,以发挥策略的最大潜力,并控制可能存在的风险。
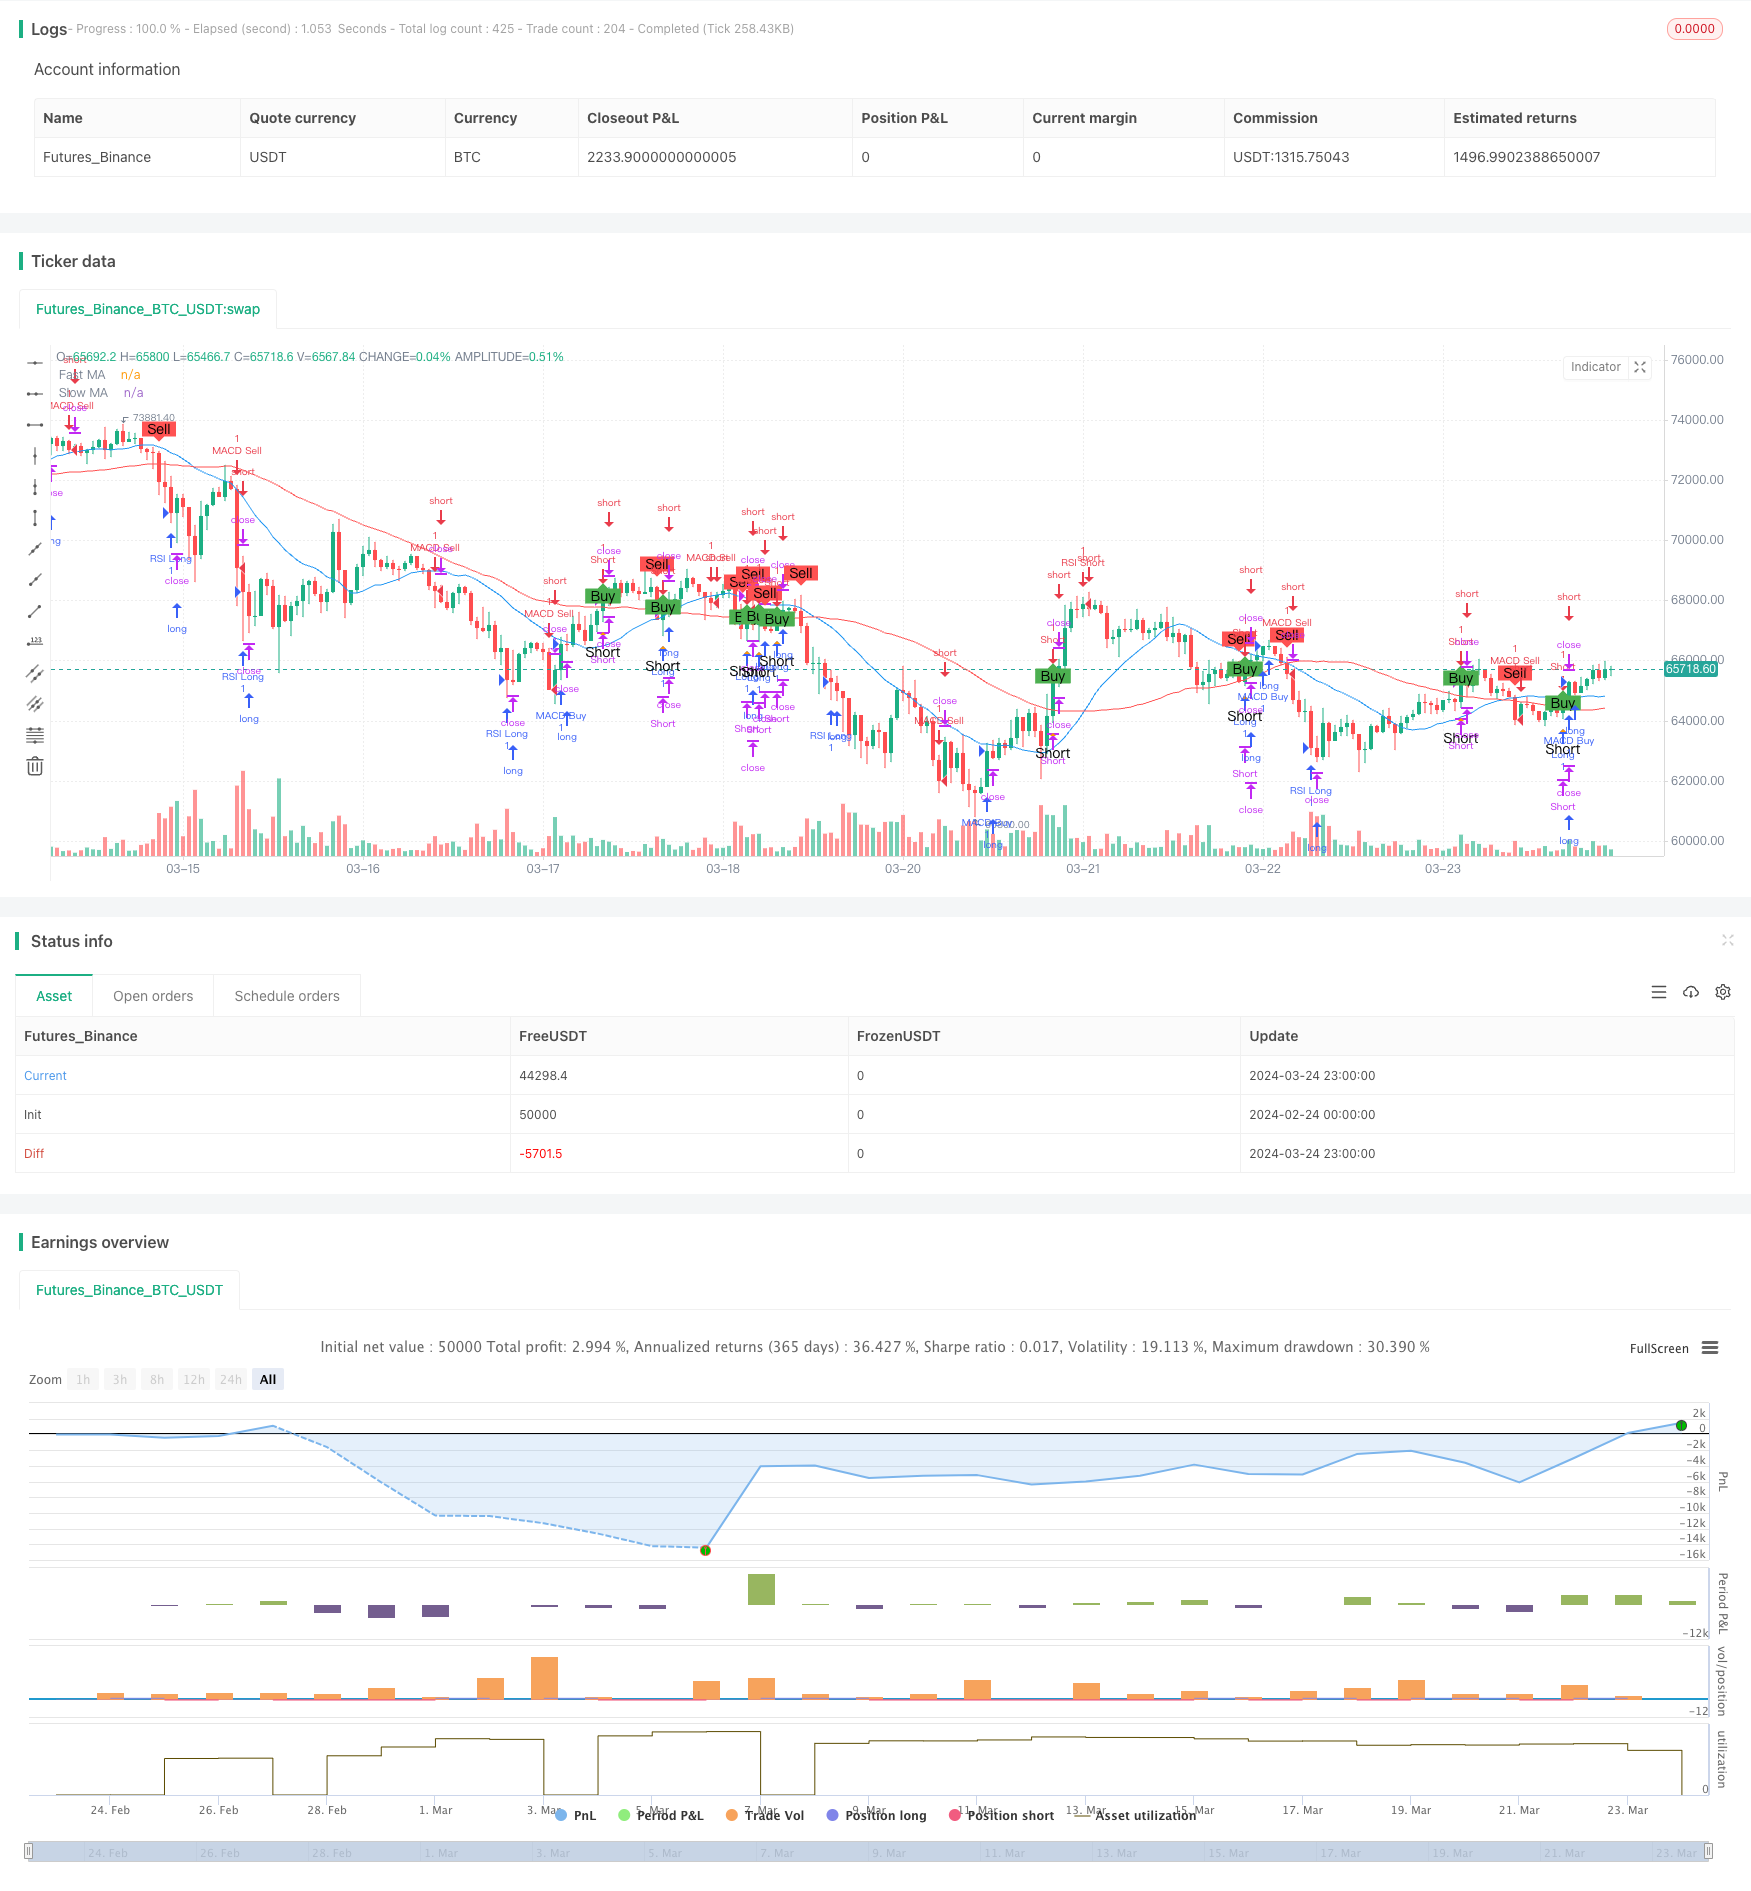
/*backtest
start: 2024-02-24 00:00:00
end: 2024-03-25 00:00:00
period: 1h
basePeriod: 15m
exchanges: [{"eid":"Futures_Binance","currency":"BTC_USDT"}]
*/

//@version=4
strategy("Enhanced Moving Average Crossover Strategy", overlay=true)

// Define input parameters
fastLength = input(20, title="Fast MA Length")
slowLength = input(50, title="Slow MA Length")

// Calculate moving averages
fastMA = sma(close, fastLength)
slowMA = sma(close, slowLength)

// Generate buy and sell signals
buySignal = crossover(close, slowMA)
sellSignal = crossunder(close, slowMA)

// RSI (Relative Strength Index)
rsiLength = input(14, title="RSI Length")
rsiOverbought = input(70, title="RSI Overbought Level")
rsiOversold = input(30, title="RSI Oversold Level")
rsi = rsi(close, rsiLength)

// MACD (Moving Average Convergence Divergence)
[macdLine, signalLine, _] = macd(close, 12, 26, 9)
macdBuySignal = crossover(macdLine, signalLine)
macdSellSignal = crossunder(macdLine, signalLine)

// Plot moving averages
plot(fastMA, color=color.blue, title="Fast MA")
plot(slowMA, color=color.red, title="Slow MA")

// Highlight buy and sell signals
plotshape(buySignal, style=shape.labelup, color=color.green, text="Buy", title="Buy Signal")
plotshape(sellSignal, style=shape.labeldown, color=color.red, text="Sell", title="Sell Signal")

// Execute strategy based on signals
strategy.entry("Long", strategy.long, when=buySignal)
strategy.close("Long", when=sellSignal)

// Add short signals
shortSignal = crossunder(slowMA, close)
plotshape(shortSignal, style=shape.triangleup, location=location.belowbar, color=color.orange, text="Short", title="Short Signal")
strategy.entry("Short", strategy.short, when=shortSignal)
strategy.close("Short", when=buySignal)

// RSI-based conditions
if (rsi > rsiOverbought)
    strategy.entry("RSI Short", strategy.short)
if (rsi < rsiOversold)
    strategy.entry("RSI Long", strategy.long)

// MACD-based conditions
if (macdBuySignal)
    strategy.entry("MACD Buy", strategy.long)
if (macdSellSignal)
    strategy.entry("MACD Sell", strategy.short)