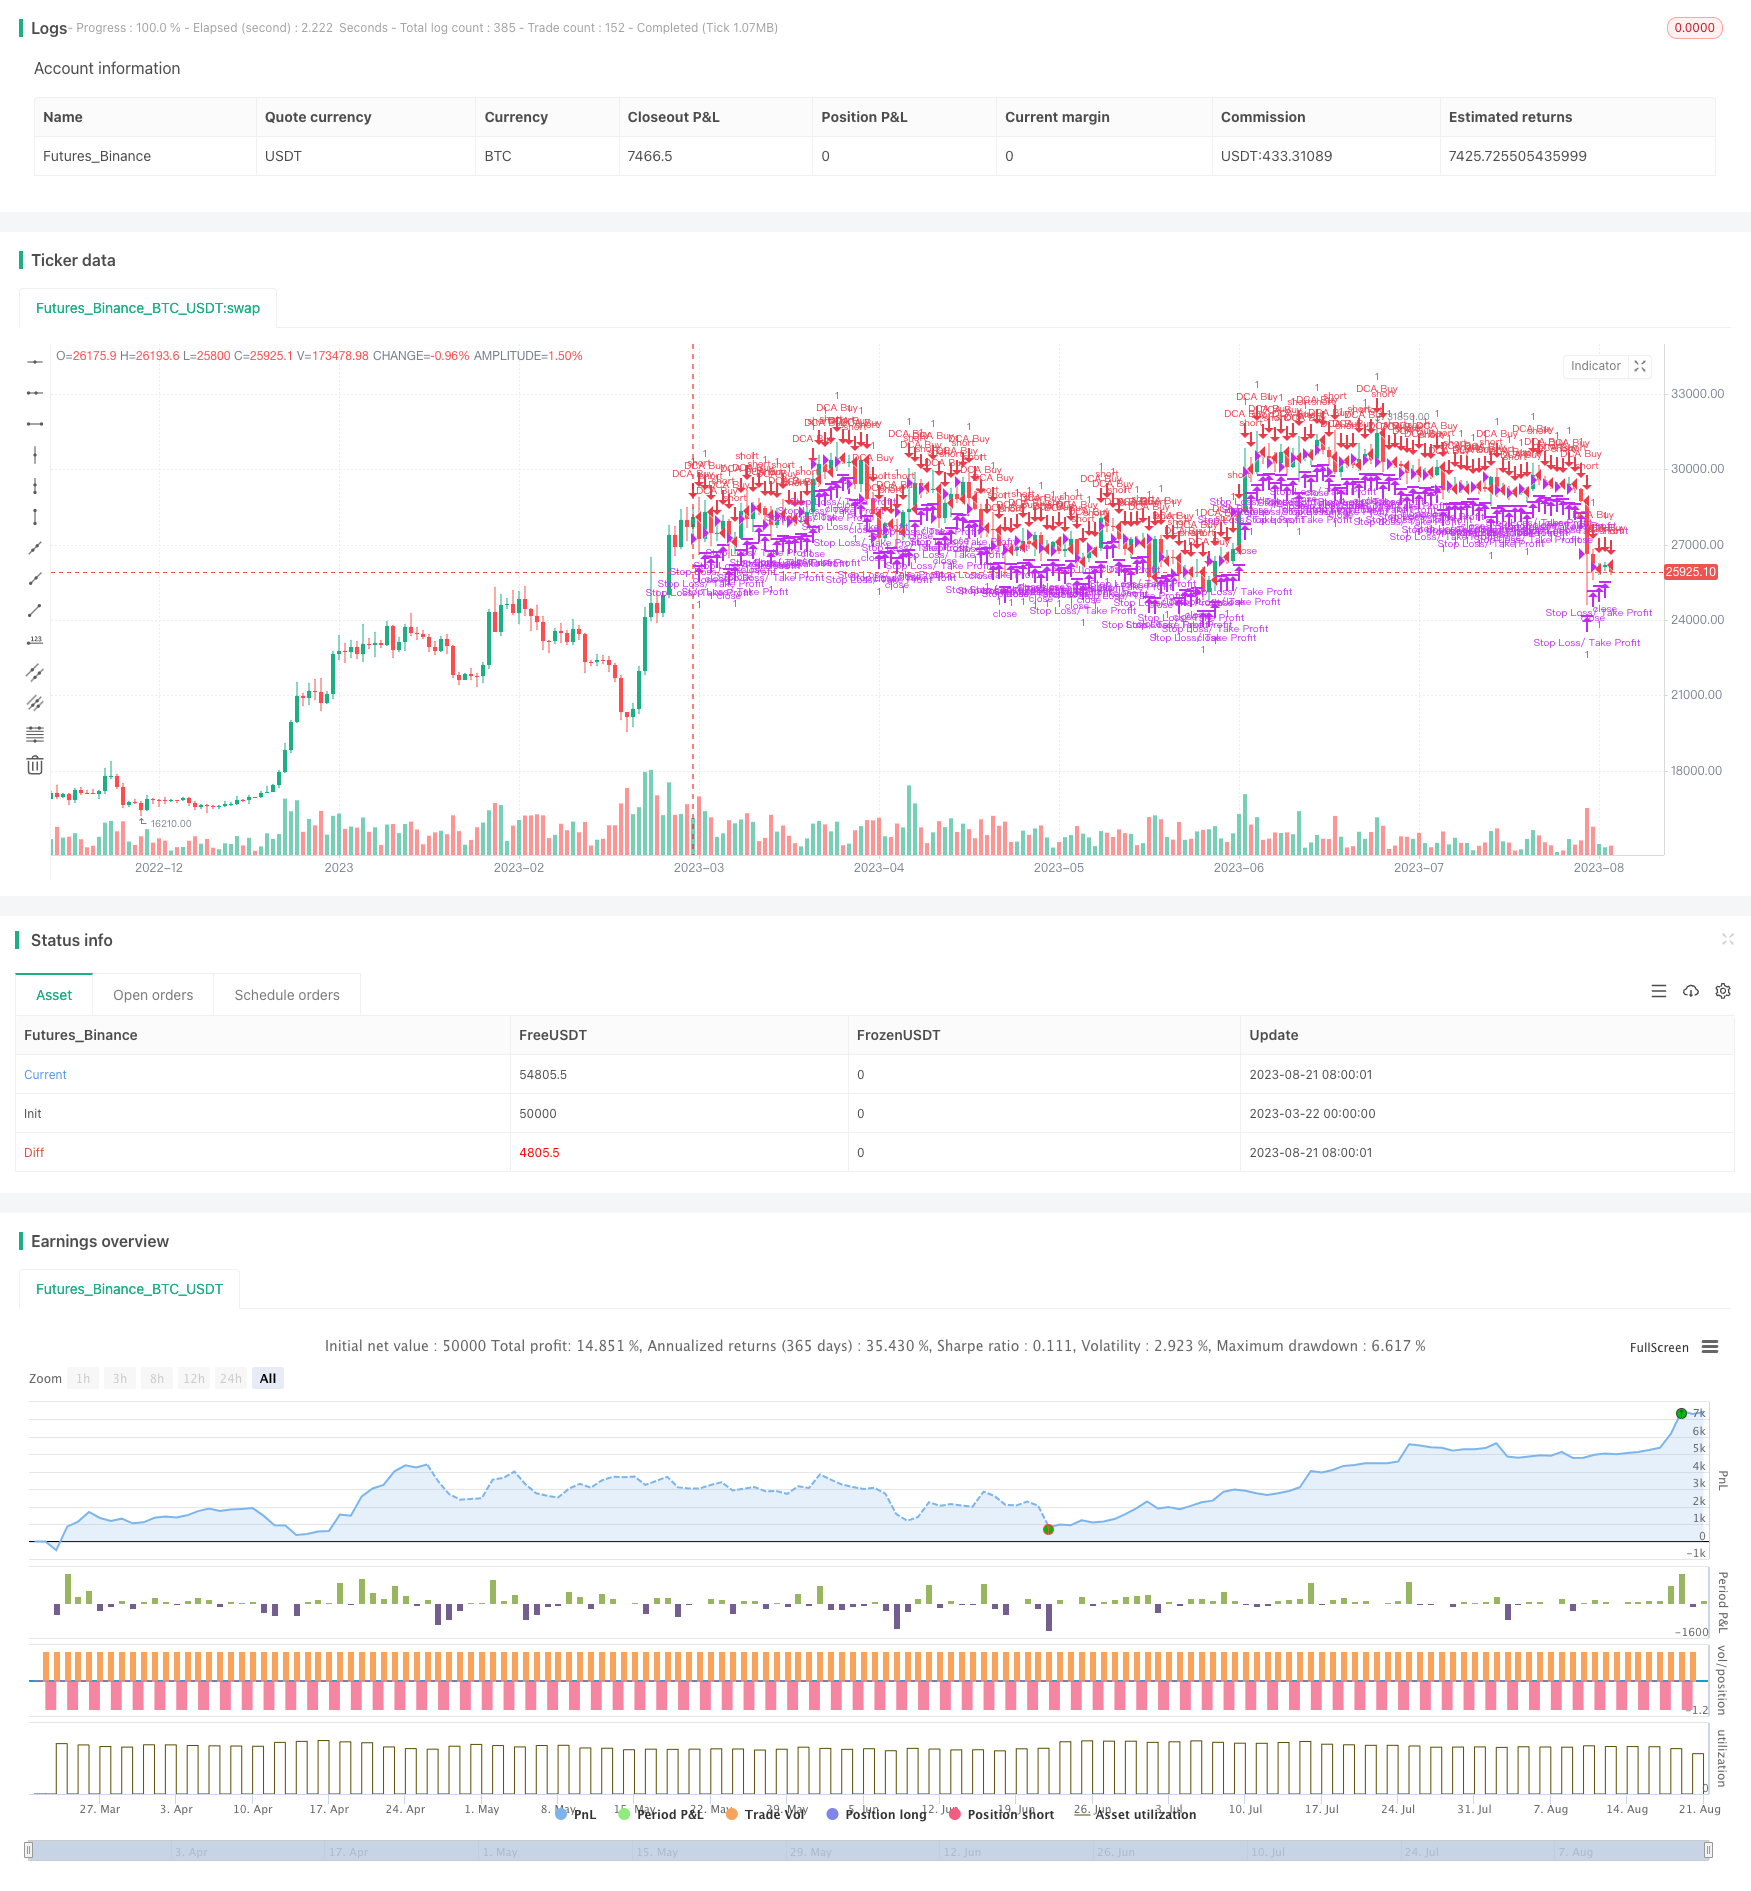
概述
网格美元成本平均策略(GridDCA)是一种自动化交易策略,利用美元成本平均法(DCA)在多个价格网格上进行定投,以降低投资风险,增加资产积累的稳定性。该策略基于TradingView平台上的Pine Script开发而成,可灵活设置网格数量、网格距离、止损比例和盈利目标等参数,并支持市价单和限价单两种下单方式。
策略原理
DCA是一种长期投资策略,通过在固定的时间间隔内投入固定金额,而不考虑资产的当前价格,以降低市场波动对投资的影响。GridDCA策略在此基础上引入了价格网格的概念,根据用户设定的网格数量和网格距离,生成多个不同价位的网格。每个网格都有对应的买入数量和价格。当价格触及某一网格时,策略会根据设置以市价单或限价单的方式执行买入操作。同时,策略还会根据指定的止损比例和盈利目标,为每笔网格买入设置止损和止盈价位。通过在不同价位进行定投,GridDCA策略能够有效平滑买入成本,降低投资风险。
优势分析
- 自动化交易:GridDCA策略可自动执行交易,省时省力,减少了人为情绪干扰。
- 降低风险:通过在不同价位定投,DCA策略能够降低市场波动对投资的影响,增加资产积累的稳定性。
- 灵活性强:GridDCA策略支持自定义网格数量、网格距离、止损比例和盈利目标等参数,用户可根据自身需求进行调整。
- 多样化下单:策略支持市价单和限价单两种下单方式,满足不同用户的偏好。
风险分析
- 市场趋势风险:如果市场长期处于下跌趋势,GridDCA策略的买入成本可能会高于市场平均水平。解决方法是合理设置网格距离和止损比例,避免过度暴露于下跌风险。
- 参数设置风险:不恰当的参数设置可能导致策略表现不佳。解决方法是在回测中优化参数,并根据市场情况适时调整。
- 流动性风险:在市场流动性不足的情况下,限价单可能无法成交。解决方法是使用市价单或调整限价单价格。
优化方向
- 动态调整参数:根据市场状况和资产表现,动态调整网格距离、止损比例和盈利目标等参数,以适应市场变化,提高策略表现。
- 引入趋势判断:在DCA的基础上,结合趋势指标如移动平均线,在上升趋势中加大买入量,在下降趋势中减少买入量,以进一步降低风险,提高收益。
- 多币种多时间框架:将GridDCA策略应用于多个币种和多个时间框架,通过分散投资降低单一市场的风险,捕捉不同市场和时间框架的机会。
总结
网格美元成本平均策略(GridDCA)是一种基于美元成本平均法的自动化交易策略,通过在多个价格网格上进行定投,有效降低了市场波动对投资的影响,增加了资产积累的稳定性。该策略具有自动化交易、降低风险、灵活性强、多样化下单等优势,但同时也面临市场趋势风险、参数设置风险和流动性风险等挑战。通过动态调整参数、引入趋势判断、多币种多时间框架等优化方向,可进一步提升GridDCA策略的表现,使其成为量化交易领域一个值得深入研究和应用的策略。
策略源码
/*backtest
start: 2023-03-22 00:00:00
end: 2023-08-22 00:00:00
period: 1d
basePeriod: 1h
exchanges: [{"eid":"Futures_Binance","currency":"BTC_USDT"}]
*/

//@version=5
strategy("DCA Trading Strategy", overlay=true)

// Define input options
numGrids = input.int(5, title="Number of Grids")
gridDistance = input.float(0.5, title="Grid Distance")
stopLossPct = input.float(1, title="Stop Loss Percentage")
takeProfitPct = input.float(1, title="Take Profit Percentage")
useMarketOrder = input.bool(false, title="Use Market Order")

// Define DCA function
dca(quantity, price, stopLoss, takeProfit) =>
    if useMarketOrder
        strategy.entry("DCA Buy", strategy.short, qty=quantity)
    else
        strategy.entry("DCA Buy", strategy.short, qty=quantity, limit=price)
    strategy.exit("Stop Loss/ Take Profit", "DCA Buy", stop=stopLoss, limit=takeProfit)

// Calculate grid levels
gridLevels = math.floor(strategy.position_size / (numGrids + 1) + 0.5)

// Calculate buy quantity
buyQuantity = strategy.position_size / numGrids

// Loop through each grid level
for i = 1 to numGrids
    priceLevel = strategy.position_avg_price * (1 - gridDistance * i)
    stopLossPrice = priceLevel * (1 - stopLossPct / 100)
    takeProfitPrice = priceLevel * (1 + takeProfitPct / 100)
    dca(buyQuantity, priceLevel, stopLossPrice, takeProfitPrice)

// Plot grid levels
plotshape(series=gridLevels, title="Grid Levels", location=location.abovebar, color=color.blue, style=shape.triangleup, size=size.small)