资源加载中... loading...

RSI Momentum Strategy with Manual TP and SL

Author: ChaoZhang, Date: 2024-03-29 16:35:13
Tags:

img

Overview

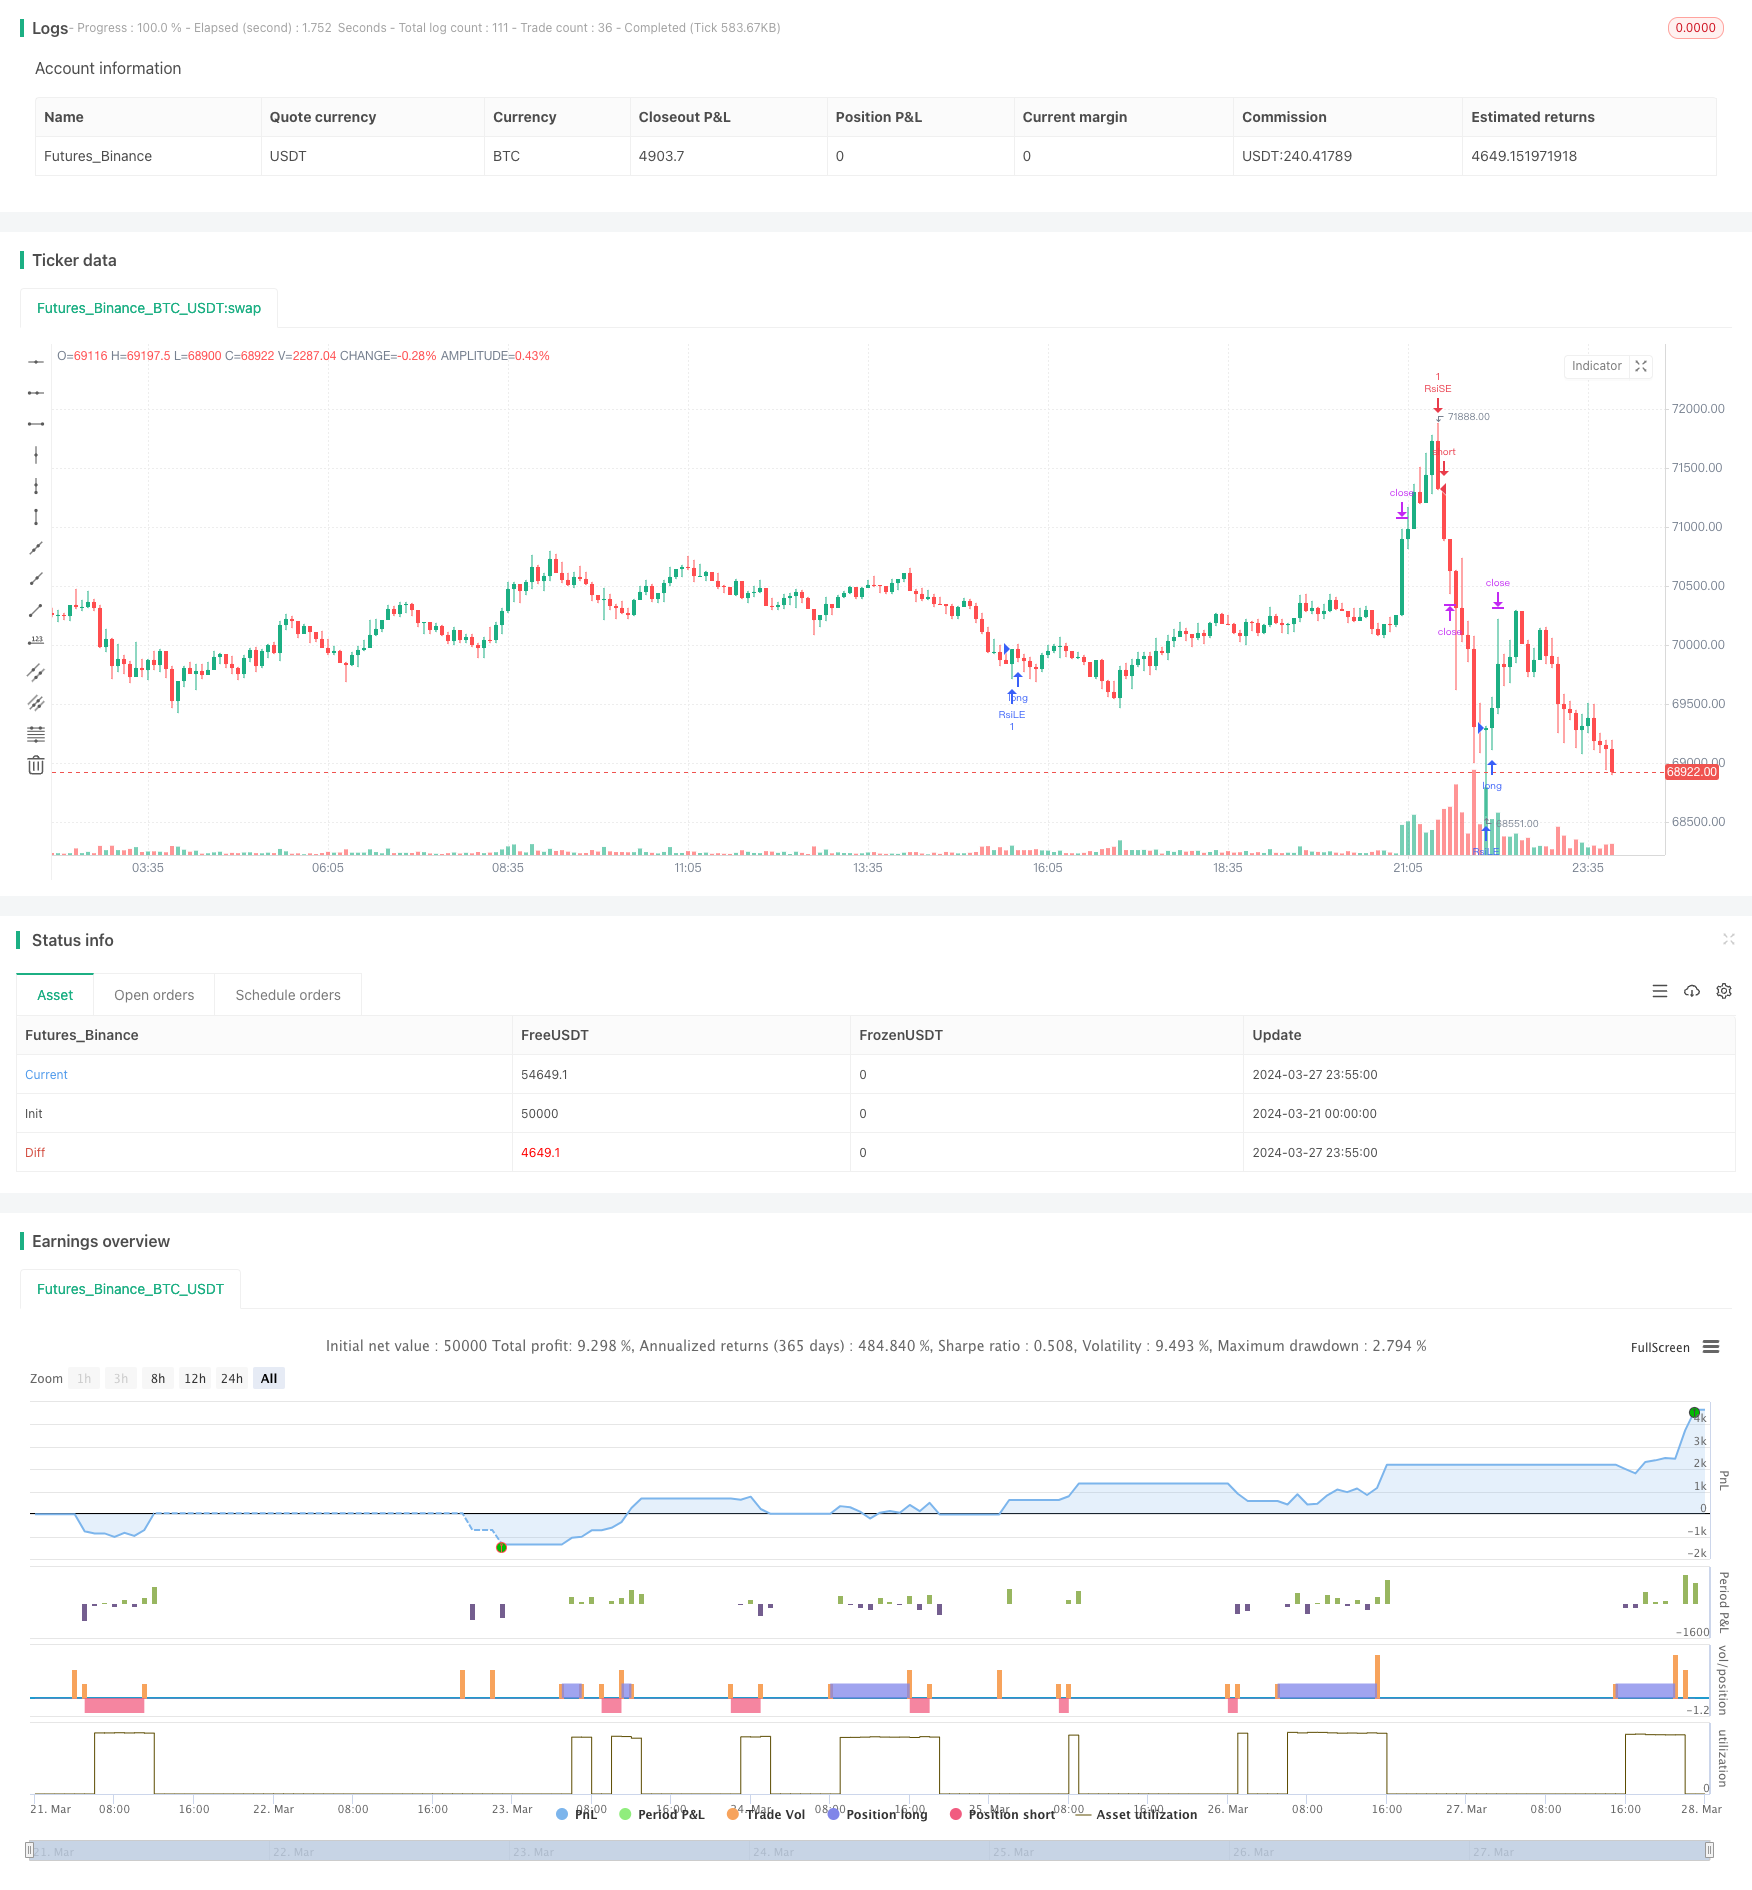
This strategy is a momentum-based approach that utilizes the Relative Strength Index (RSI) indicator in combination with manual take profit (TP) and stop loss (SL) levels. The main idea behind the strategy is to capture overbought and oversold market conditions using the RSI indicator, while also considering the position of the daily closing price relative to the highest and lowest prices in the recent past. Once the predefined TP or SL levels are reached, the strategy automatically closes the position.

Strategy Principles

  1. Calculate the RSI indicator value for a specified period.
  2. Determine if the RSI has crossed above or below the predefined oversold and overbought thresholds, which serve as one of the conditions for entering long and short positions, respectively.
  3. Check if the daily closing price is above 70% of the highest closing price or below 130% of the lowest closing price of the last 50 candles, serving as another condition for entering long and short positions, respectively.
  4. When both entry conditions for either a long or short position are met simultaneously, the strategy generates a corresponding entry signal.
  5. Calculate the take profit and stop loss levels for long and short positions based on the entry price and the predefined TP and SL percentages.
  6. Automatically close the position when the price reaches the take profit or stop loss level.

Strategy Advantages

  1. By combining the RSI indicator with price levels, the strategy can effectively capture short-term momentum changes in the market.
  2. The manual setting of take profit and stop loss levels allows traders to manage their positions according to their risk preferences and market volatility.
  3. The strategy may perform well in oscillating markets where RSI signals are more reliable.
  4. It provides a structured trading approach based on RSI signals while allowing traders to customize risk management parameters.

Strategy Risks

  1. In trending markets, the RSI indicator may remain overbought or oversold for extended periods, leading to suboptimal strategy performance.
  2. Fixed take profit and stop loss percentages may not adapt well to different market conditions and volatility levels.
  3. The strategy’s performance heavily relies on parameter selection, and inappropriate parameter settings may result in frequent trading or missed opportunities.
  4. Solely relying on technical indicators for trading decisions overlooks fundamental factors and market sentiment.

Strategy Optimization Directions

  1. Optimize the RSI parameters (e.g., length, overbought/oversold thresholds) to adapt to different market conditions.
  2. Implement an adaptive take profit and stop loss mechanism that dynamically adjusts levels based on market volatility.
  3. Incorporate additional technical indicators or market sentiment indicators to enhance signal reliability and robustness.
  4. Perform segment-wise optimization of the strategy, applying different parameter settings for various market trends (e.g., uptrend, downtrend, sideways movement).

Summary

This strategy offers a trading framework based on the RSI momentum indicator while incorporating manual take profit and stop loss functionality, allowing traders to manage their positions according to their risk preferences and market outlook. However, the strategy’s performance largely depends on parameter selection and market conditions. Therefore, traders should exercise caution when using this strategy, conduct thorough backtesting and optimization, and combine it with other forms of analysis and risk management techniques to achieve more robust trading results.


//@version=5
strategy("RSI Strategy with Manual TP and SL", overlay=true)

// Strategy Parameters
length = input(14, title="RSI Length")
overSold = input(30, title="Oversold Level")
overBought = input(70, title="Overbought Level")
trail_profit_pct = input.float(20, title="Trailing Profit (%)")

// RSI Calculation
vrsi = ta.rsi(close, length)

// Entry Conditions for Long Position
rsi_crossed_below_30 = vrsi > overSold and ta.sma(vrsi, 2) <= overSold // RSI crossed above 30
daily_close_above_threshold = close > (ta.highest(close, 50) * 0.7) // Daily close above 70% of the highest close in the last 50 bars

// Entry Conditions for Short Position
rsi_crossed_above_70 = vrsi < overBought and ta.sma(vrsi, 2) >= overBought // RSI crossed below 70
daily_close_below_threshold = close < (ta.lowest(close, 50) * 1.3) // Daily close below 130% of the lowest close in the last 50 bars

// Entry Signals
if (rsi_crossed_below_30 and daily_close_above_threshold)
    strategy.entry("RsiLE", strategy.long, comment="RsiLE")

if (rsi_crossed_above_70 and daily_close_below_threshold)
    strategy.entry("RsiSE", strategy.short, comment="RsiSE")

// Manual Take Profit and Stop Loss
tp_percentage = input.float(1, title="Take Profit (%)")
sl_percentage = input.float(1, title="Stop Loss (%)")

long_tp = strategy.position_avg_price * (1 + tp_percentage / 100)
long_sl = strategy.position_avg_price * (1 - sl_percentage / 100)
short_tp = strategy.position_avg_price * (1 - tp_percentage / 100)
short_sl = strategy.position_avg_price * (1 + sl_percentage / 100)

strategy.exit("TP/SL Long", "RsiLE", limit=long_tp, stop=long_sl)
strategy.exit("TP/SL Short", "RsiSE", limit=short_tp, stop=short_sl)


More