资源加载中... loading...

Time Series Adaptive Dynamic Threshold Strategy Based on Equity Data

Author: ChaoZhang, Date: 2024-04-01 10:48:52
Tags:

img

Overview

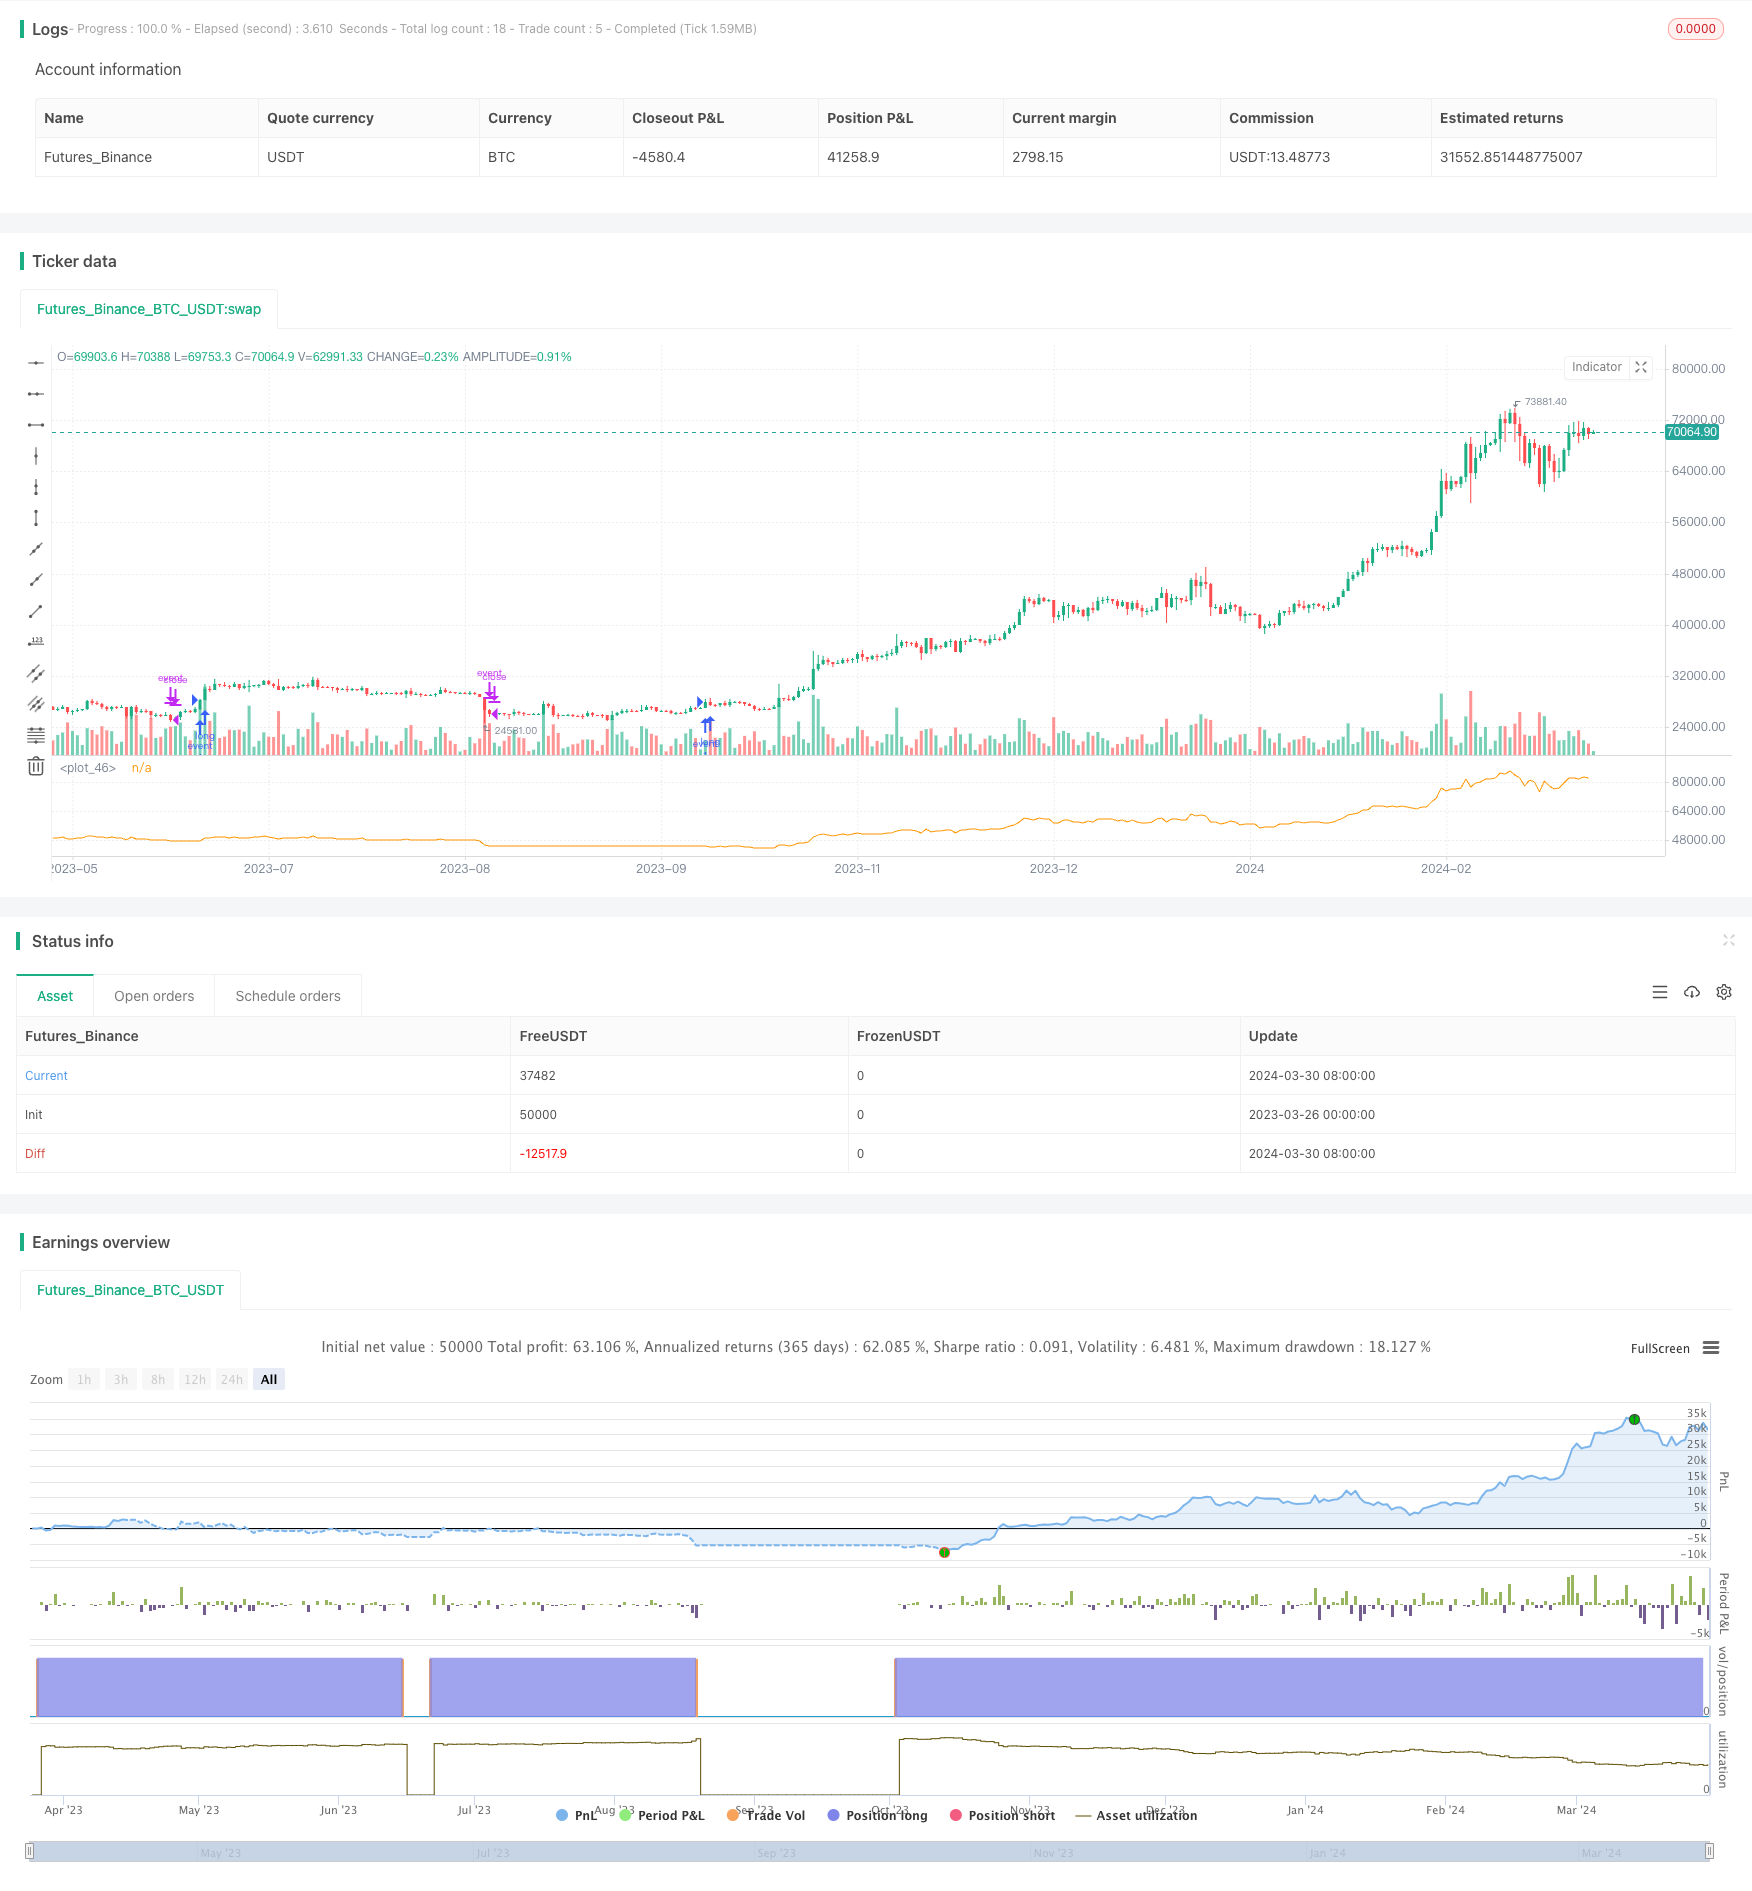
This strategy is based on the time series data of net asset value of stocks or other financial assets. By dynamically calculating the efficiency ratio (ER) as the smoothing factor of the exponential moving average (EMA), it adaptively adjusts the upper and lower bands to trigger buy and sell signals. The main idea of this strategy is to use all the information contained in the net asset value data itself, by calculating the complexity of net asset value changes (ER) to dynamically adjust the EMA smoothing factor, and then obtain the dynamically changing upper and lower bands. When the price breaks through the upper band, it opens a long position, and when it breaks through the lower band, it closes the position.

Strategy Principle

  1. Calculate the efficiency ratio (ER) of the net asset value data, which is the ratio of the net asset value change to the total change. The smaller the ER value, the more stable the net asset value changes; the larger the ER value, the more dramatic the net asset value changes.
  2. Use ER as the smoothing factor alpha of the pine_ema function to dynamically calculate the EMA mean and absolute deviation of the net asset value.
  3. Add and subtract the absolute deviation from the EMA mean to obtain the dynamically changing upper and lower bands.
  4. When the current net asset value breaks through the upper band, open a long position, and when it breaks through the lower band, close the position.

Strategy Advantages

  1. It makes full use of all the information contained in the time series data of net asset value, without the need to set any parameters and optimize, the method is simple and natural.
  2. By dynamically calculating ER to adjust the EMA smoothing factor, it can adapt to the complexity of net asset value changes and flexibly respond to market changes.
  3. Compared with the traditional fixed-parameter EMA, the dynamic EMA can effectively reduce the number of trades and holding time, reducing transaction costs and risks.
  4. It can effectively control drawdowns. Compared with buy and hold, this strategy can reduce the maximum drawdown by 2-3 times, or increase the return by 2-3 times under the same drawdown.
  5. It can be easily applied to the combination of multiple strategies to achieve the purpose of automatic on/off of strategies.

Strategy Risks

  1. This strategy is based on the time series data of net asset value. For situations where the price trend reverses fundamentally, the speed of triggering the closing of positions may be slower, thus affecting the return.
  2. Although this strategy can adaptively adjust parameters, its adaptability to extreme market conditions needs further examination.
  3. This strategy currently mainly focuses on long positions, and needs to be further improved for short positions.
  4. In practical applications, this strategy has higher requirements for the quality of the selected targets, and requires the selection of targets with long-term upward trends.

Strategy Optimization Directions

  1. Consider further optimizing the calculation method of ER, introducing more indicators that reflect the characteristics of net asset value changes, and improving the robustness and effectiveness of ER.
  2. Further refine the opening and closing conditions, such as considering adding trailing stop loss, percentage stop loss, etc., to improve the profitability and risk resistance of the strategy.
  3. For different targets and market environments, optimize the parameters and adaptively adjust the strategy to improve the versatility of the strategy.
  4. Combine this strategy with other strategies (such as trend tracking, mean reversion, etc.) to leverage the advantages of different strategies and improve the robustness and profitability of the portfolio.

Summary

This strategy dynamically calculates the efficiency ratio (ER) as the smoothing factor of the exponential moving average (EMA), adaptively adjusts the upper and lower bands, and triggers buy and sell signals. This strategy makes full use of the information contained in the time series data of net asset value, without the need for too many parameter settings and optimizations, the method is simple and natural, and can flexibly respond to market changes and effectively control drawdowns. However, the adaptability of this strategy to extreme market conditions needs further examination, and attention should be paid to the selection of targets in practical applications. In the future, we can further optimize and improve the strategy from the aspects of calculation methods, opening and closing conditions, parameter optimization, strategy combination, etc., to improve the robustness and profitability of the strategy.


/*backtest
start: 2023-03-26 00:00:00
end: 2024-03-31 00:00:00
period: 1d
basePeriod: 1h
exchanges: [{"eid":"Futures_Binance","currency":"BTC_USDT"}]
*/

//@version=4
strategy('Equity control', 'EC')
// study('Exponential bands', 'EB', overlay = true)


er(src) =>
    var start = src
    var total = 0.0

    total += abs(src - nz(src[1], src))
    net    = abs(src - start          )
    
    net / total

pine_ema(src, alpha) =>
    mean = 0.0
    dev  = 0.0

    mean := na(mean[1]) ? src : (1 - alpha) * mean[1] + alpha *     src
    dev  := na(dev [1]) ? 0   : (1 - alpha) * dev [1] + alpha * abs(src - mean)

    [mean, dev]


src = input(close)


a           = er      (src   )
[mean, dev] = pine_ema(src, a)

dev_lower = mean - dev
dev_upper = mean + dev


// plot(dev_lower, 'lower deviation', color.silver, 2, plot.style_stepline)
// plot(mean     , 'basis'          , color.purple, 1, plot.style_stepline)
// plot(dev_upper, 'upper deviation', color.silver, 2, plot.style_stepline)


if src > dev_upper
    strategy.entry('event', true, comment = 'on')
if src < dev_lower
    strategy.close('event', comment = 'off')


plot(strategy.equity)

//bigDope

More