概述
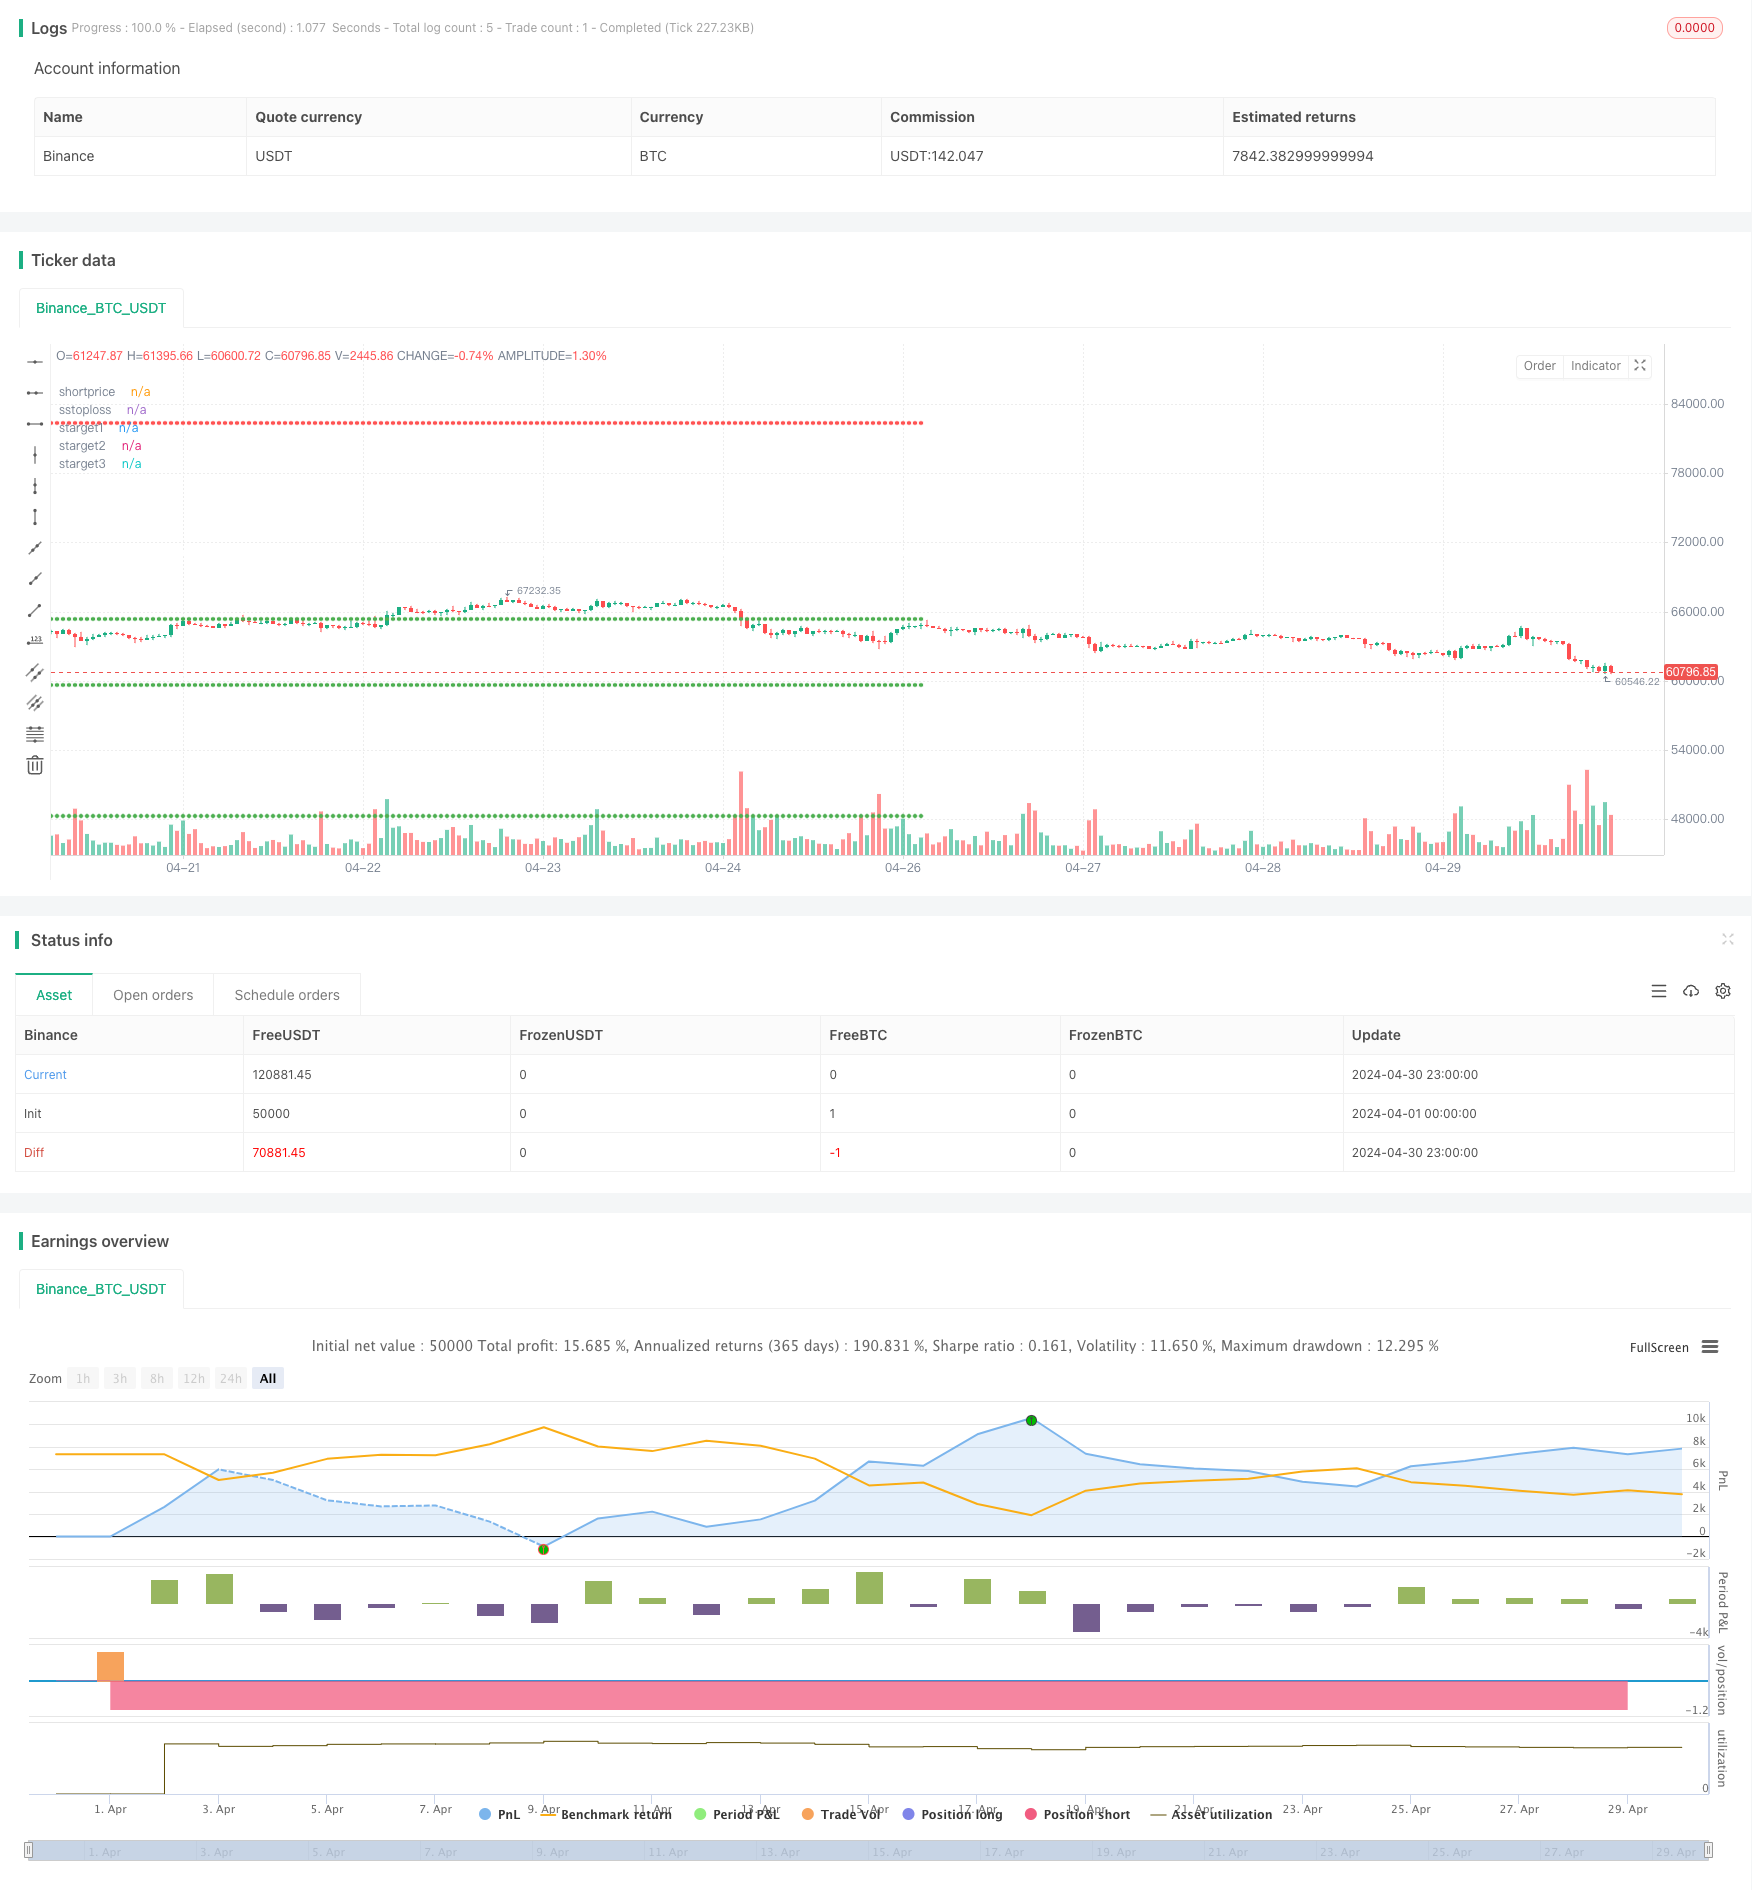
该量化策略主要利用抛物线SAR指标(PSAR)和指数移动平均线(EMA)的交叉信号,结合多个自定义条件,产生买入和卖出信号。策略的主要思路是:当PSAR从下方突破EMA,且满足一定条件时产生买入信号;当PSAR从上方跌破EMA,且满足一定条件时产生卖出信号。同时,该策略还设置了止盈和止损位,以控制风险。
策略原理
- 计算PSAR和30周期EMA指标
- 判断PSAR与EMA的交叉关系,并设置对应的标志位
- 结合PSAR与EMA的位置关系、K线的颜色等条件,定义IGC(Ideal Green Candle)和IRC(Ideal Red Candle)
- 通过IGC和IRC的出现,判断买入和卖出信号
- 设置止盈和止损位,止盈位分别为买入价格的8%、16%和32%,止损位为买入价格的16%;卖出价格的8%、16%和32%,止损位为卖出价格的16%
- 根据交易时段和持仓状态,执行买入、卖出或平仓操作
策略优势
- 结合多个指标和条件,提高了信号的可靠性
- 设置了多个止盈位和止损位,可以灵活控制风险和收益
- 针对不同的市场状况,设置了买入和卖出的过滤条件,提高了策略的适应性
- 代码模块化程度高,易于理解和修改
策略风险
- 策略的参数设置可能不适合所有市场环境,需要根据实际情况进行调整
- 在震荡市场中,该策略可能会出现频繁的交易信号,导致交易成本增加
- 该策略缺乏对市场趋势的判断,在强趋势市场中可能错失机会
- 止损位的设置可能无法完全避免极端行情带来的风险
策略优化方向
- 引入更多的技术指标或市场情绪指标,提高信号的准确性和可靠性
- 优化止盈和止损位的设置,可以考虑引入动态止盈止损或基于波动率的止盈止损
- 针对不同的市场状态,设置不同的交易参数和规则,提高策略的适应性
- 加入资金管理模块,根据账户equity ratio balance等因素,动态调整仓位和风险exposure
总结
该量化策略基于PSAR和EMA指标,通过多个自定义条件和规则,产生买入和卖出信号。策略具有一定的适应性和灵活性,同时也设置了止盈止损位来控制风险。但是,策略的参数设置和风险控制方面还有优化的空间。总的来说,该策略可以作为一个基础模板,通过进一步的优化和改进,有望成为一个稳健的交易策略。
策略源码
/*backtest
start: 2024-04-01 00:00:00
end: 2024-04-30 23:59:59
period: 1h
basePeriod: 15m
exchanges: [{"eid":"Binance","currency":"BTC_USDT"}]
*/

// This Pine Script™ code is subject to the terms of the Mozilla Public License 2.0 at https://mozilla.org/MPL/2.0/
// © SwapnilRaykar

//@version=5
strategy("aj sir second project", overlay=true, margin_long=100, margin_short=100)

start=input("0915-1515","session time")
st11=time(timeframe.period,start)
st=st11>0
et= not st

psar=ta.sar(0.02,0.02,0.2)
emared=ta.ema(close,30)
//plot(psar,"psar",color.yellow,style = plot.style_cross)
//plot(emared,"emared",color.red)
var crodownflag=0
var croupflag=0

var igcflag=0

var ircflag=0

cdown1=ta.crossunder(psar,emared)  and not (psar<close and psar[1]>close[1])
cup1=ta.crossover(psar,emared) and not (psar>close and psar[1]<close[1])

cdown=ta.crossunder(psar,emared)
cup=ta.crossover(psar,emared)


green_candle=close>open
red_candle=close<open

if ta.crossunder(psar,emared) and crodownflag==0  and not (psar<close and psar[1]>close[1])
    crodownflag:=1
else if cdown and crodownflag==1
    crodownflag:=0


if crodownflag==1 and green_candle and igcflag==0
    igcflag:=1
else if cdown and igcflag==1
    igcflag:=0

//plot(igcflag,"igcflag",color.lime)

if ta.crossover(psar,emared) and croupflag==0 and not (psar>close and psar[1]<close[1])
    croupflag:=1
else if cdown and croupflag==1
    croupflag:=0

//plot(crodownflag,"crodownflag",color.white)
irc_cond=croupflag==1 or cup

if (croupflag==1 and red_candle and ircflag==0)
    ircflag:=1
else if cup and croupflag==1
    ircflag:=0

igc_candle1=(igcflag==1 and igcflag[1]==0) or (cdown1 and green_candle)
irc_candle1=(ircflag==1 and ircflag[1]==0) or (cup1 and red_candle)
///////////////////////////
dm=dayofmonth(time)
newday=dm!=dm[1]
dmc=dm==ta.valuewhen(bar_index==last_bar_index,dm,0)

///////////////////////////////////////////
var irc_there=0

if irc_candle1[1] and irc_there==0
    irc_there:=1
else if cdown and irc_there==1
    irc_there:=0

irc_candle=irc_candle1 and irc_there==0// and dmc

var igc_there=0

if igc_candle1[1] and igc_there==0
    igc_there:=1
else if cup and igc_there ==1
    igc_there:=0

igc_candle=igc_candle1 and igc_there==0// and dmc
/////////// to get rid of irc being valid even after crossdown
var valid_igc_low=0
var valid_irc_high=0

if irc_candle[1] and valid_irc_high==0
    valid_irc_high:=1
else if igc_candle and valid_irc_high==1
    valid_irc_high:=0

if igc_candle and valid_igc_low==0
    valid_igc_low:=1
else if irc_candle and valid_igc_low==1
    valid_igc_low:=0


igc_low=ta.valuewhen(igc_candle,low,0)
irc_high=ta.valuewhen(irc_candle,high,0)
//////////////////////////////
//plot(irc_high,"irc_high",color.red)

//plot(valid_irc_high,"valid_irc_high",color.purple)

buy12=ta.crossunder(close,igc_low) and valid_igc_low==1
buy1=buy12[1]

short12=ta.crossover(close,irc_high) and valid_irc_high==1
short1=short12[1]
//plotshape(short12,"short12",shape.arrowdown,color=color.purple)

// plotshape(igc_candle,"igc_candle",shape.arrowdown,color=color.green)
// plotshape(irc_candle,"irc_candle",shape.arrowdown,color=color.red)
//plotshape((psar<close and psar[1]>close[1]) ,"croup",shape.arrowdown,color=color.red)
//plotshape(cup ,"croup",shape.arrowdown,color=color.orange)

buyprice=ta.valuewhen(buy1 and strategy.position_size[1]==0,open,0)
shortprice=ta.valuewhen(short1 and strategy.position_size[1]==0,open,0)

btarget1=buyprice+(buyprice*0.08)
btarget2=buyprice+(buyprice*0.16)
btarget3=buyprice+(buyprice*0.32)
bstoploss=buyprice-(buyprice*0.16)

starget1=shortprice-(shortprice*0.08)
starget2=shortprice-(shortprice*0.16)
starget3=shortprice-(shortprice*0.32)
sstoploss=shortprice+(shortprice*0.16)

if buy12 and strategy.position_size==0 and st11
    strategy.entry("buy",strategy.long)

if strategy.position_size >0
    strategy.exit("sell",from_entry = "buy",stop=bstoploss,limit=btarget3)

if short12 and strategy.position_size==0 and st11
    strategy.entry("short",strategy.short)

if strategy.position_size<0
    strategy.exit("cover",from_entry = "short",stop = sstoploss,limit = starget3)

if et
    strategy.close_all(comment = "timeover")

plot(strategy.position_size>0?buyprice:na,"buyprice",color.white, style=plot.style_circles )
plot(strategy.position_size>0?bstoploss:na,"bstoploss",color.red, style=plot.style_circles )
plot(strategy.position_size>0?btarget1:na,"btarget1",color.green, style=plot.style_circles )
plot(strategy.position_size>0?btarget2:na,"btarget2",color.green, style=plot.style_circles )
plot(strategy.position_size>0?btarget3:na,"btarget3",color.green, style=plot.style_circles )

plot(strategy.position_size<0?shortprice:na,"shortprice",color.white, style=plot.style_circles )
plot(strategy.position_size<0?sstoploss:na,"sstoploss",color.red, style=plot.style_circles )
plot(strategy.position_size<0?starget1:na,"starget1",color.green, style=plot.style_circles )
plot(strategy.position_size<0?starget2:na,"starget2",color.green, style=plot.style_circles )
plot(strategy.position_size<0?starget3:na,"starget3",color.green, style=plot.style_circles )
相关推荐