概述
该策略结合了指数移动平均线(EMA)和超级趋势指标(Supertrend)来生成买卖信号。当价格从上方突破20日EMA且超级趋势指标处于看涨趋势时,会产生买入信号;当价格从下方跌破20日EMA且超级趋势指标处于看跌趋势时,会产生卖出信号。该策略旨在捕捉趋势性行情,同时利用EMA作为过滤条件以减少假信号。
策略原理
- 计算20日EMA作为趋势判断的过滤条件。
- 计算超级趋势指标,该指标基于平均真实范围(ATR)和多空趋势来绘制上下轨。
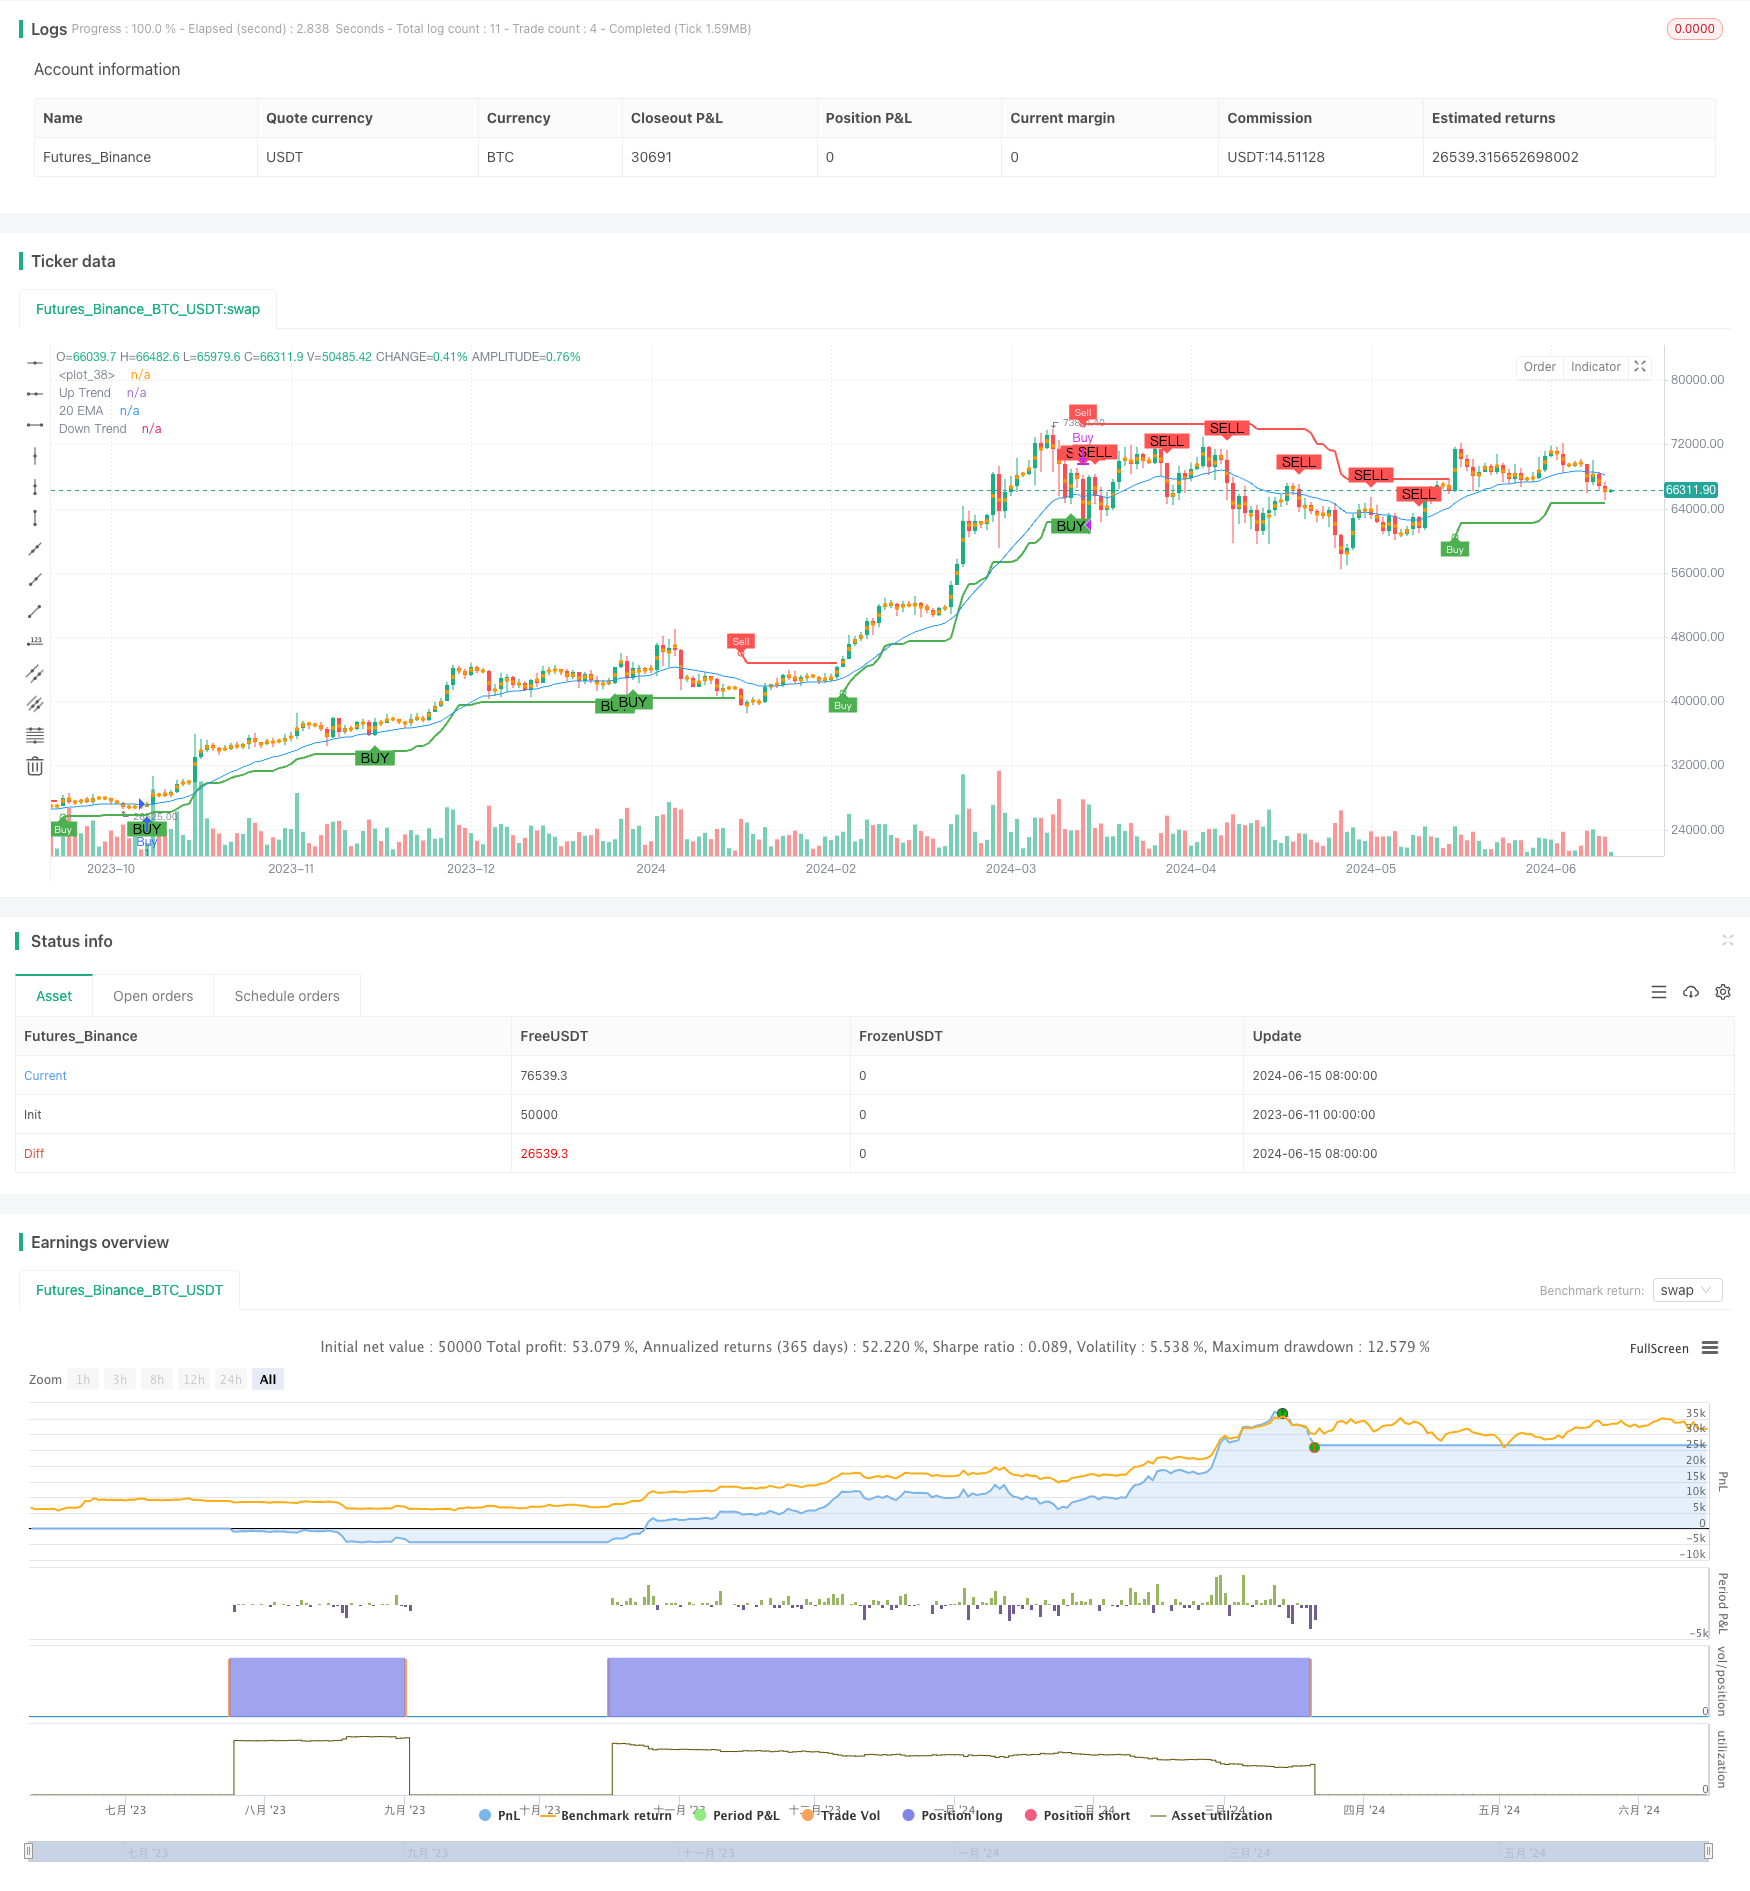
- 根据超级趋势指标的趋势方向和价格与20日EMA的相对位置来生成买卖信号:
- 当价格从上方突破20日EMA且超级趋势指标处于看涨趋势时,产生买入信号。
- 当价格从下方跌破20日EMA且超级趋势指标处于看跌趋势时,产生卖出信号。
- 策略根据买入信号开仓做多,根据卖出信号平仓。
策略优势
- 结合EMA和超级趋势指标,可以有效地捕捉趋势性行情,减少假信号。
- 超级趋势指标基于ATR,能够动态调整上下轨距离,适应不同的市场波动率。
- EMA作为趋势判断的过滤条件,可以确保在趋势方向上开仓,提高策略的胜率。
- 策略逻辑简单明了,易于理解和实现。
策略风险
- 在震荡市场下,该策略可能会频繁产生买卖信号,导致过多的交易次数和手续费损耗。
- 策略依赖于EMA和超级趋势指标,在某些市场条件下,这些指标可能会失效或滞后。
- 策略没有考虑风险管理,如止损和仓位管理,这可能导致在市场剧烈波动时出现较大的回撤。
策略优化方向
- 加入止损机制,如根据ATR设置动态止损,以控制单笔交易的最大亏损。
- 优化EMA和超级趋势指标的参数,如使用参数优化方法找到最佳参数组合,提高策略的适应性和稳定性。
- 引入仓位管理,根据市场波动率或账户盈亏情况动态调整仓位大小,以控制整体风险。
- 考虑加入其他过滤条件,如交易量、波动率等,以进一步减少假信号。
总结
该策略通过结合20日EMA和超级趋势指标来生成买卖信号,旨在捕捉趋势性行情。策略优势在于逻辑简单,结合EMA和超级趋势指标可以有效减少假信号。但在震荡市场下,策略可能会频繁交易,且缺乏风险管理措施。未来可以考虑加入止损、仓位管理和参数优化等方法来改进策略。总体而言,该策略为趋势交易提供了一种简单有效的思路,但在实际应用中还需要进一步优化和完善。
策略源码
/*backtest
start: 2023-06-11 00:00:00
end: 2024-06-16 00:00:00
period: 1d
basePeriod: 1h
exchanges: [{"eid":"Futures_Binance","currency":"BTC_USDT"}]
*/

//@version=5
strategy("20 EMA and Supertrend Strategy", overlay=true)

// Inputs
emaLength = input(20, title="EMA Length")
supertrendMultiplier = input.float(3.0, title="Supertrend Multiplier")
supertrendPeriod = input(10, title="Supertrend Period")

// EMA Calculation
ema = ta.ema(close, emaLength)

// Supertrend Calculation
Periods = supertrendPeriod
src = hl2
Multiplier = supertrendMultiplier
changeATR= input.bool(true, title="Change ATR Calculation Method?")
showsignals = input.bool(true, title="Show Buy/Sell Signals?")
highlighting = input.bool(true, title="Highlighter On/Off?")
atr2 = ta.sma(ta.tr, Periods)
atr = changeATR ? ta.atr(Periods) : atr2
up = src - (Multiplier * atr)
up1 = na(up[1]) ? up : up[1]
up := close[1] > up1 ? math.max(up, up1) : up
dn = src + (Multiplier * atr)
dn1 = na(dn[1]) ? dn : dn[1]
dn := close[1] < dn1 ? math.min(dn, dn1) : dn
trend = 1
trend := na(trend[1]) ? trend : trend[1]
trend := trend == -1 and close > dn1 ? 1 : trend == 1 and close < up1 ? -1 : trend
upPlot = plot(trend == 1 ? up : na, title="Up Trend", style=plot.style_linebr, linewidth=2, color=color.green)
buySignal = trend == 1 and trend[1] == -1
plotshape(series=buySignal ? up : na, title="UpTrend Begins", location=location.absolute, style=shape.circle, size=size.tiny, color=color.new(color.green, 0))
plotshape(series=buySignal and showsignals ? up : na, title="Buy", text="Buy", location=location.absolute, style=shape.labelup, size=size.tiny, color=color.new(color.green, 0), textcolor=color.white)
dnPlot = plot(trend == 1 ? na : dn, title="Down Trend", style=plot.style_linebr, linewidth=2, color=color.red)
sellSignal = trend == -1 and trend[1] == 1
plotshape(series=sellSignal ? dn : na, title="DownTrend Begins", location=location.absolute, style=shape.circle, size=size.tiny, color=color.new(color.red, 0))
plotshape(series=sellSignal and showsignals ? dn : na, title="Sell", text="Sell", location=location.absolute, style=shape.labeldown, size=size.tiny, color=color.new(color.red, 0), textcolor=color.white)
mPlot = plot(ohlc4, title="", style=plot.style_circles, linewidth=1)
longFillColor = highlighting ? (trend == 1 ? color.new(color.green, 90) : color.new(color.white, 0)) : color.new(color.white, 0)
shortFillColor = highlighting ? (trend == -1 ? color.new(color.red, 90) : color.new(color.white, 0)) : color.new(color.white, 0)
fill(mPlot, upPlot, title="UpTrend Highlighter", color=longFillColor)
fill(mPlot, dnPlot, title="DownTrend Highlighter", color=shortFillColor)
alertcondition(buySignal, title="SuperTrend Buy", message="SuperTrend Buy!")
alertcondition(sellSignal, title="SuperTrend Sell", message="SuperTrend Sell!")
changeCond = trend != trend[1]
alertcondition(changeCond, title="SuperTrend Direction Change", message="SuperTrend has changed direction!")

// Buy and Sell Signals based on EMA and Supertrend
buySignalEMA = ta.crossover(close, ema) and trend == 1
sellSignalEMA = ta.crossunder(close, ema) and trend == -1

// Plot EMA
plot(ema, color=color.blue, title="20 EMA")

// Plot Buy and Sell Signals
plotshape(series=buySignalEMA, location=location.belowbar, color=color.green, style=shape.labelup, title="Buy Signal", text="BUY")
plotshape(series=sellSignalEMA, location=location.abovebar, color=color.red, style=shape.labeldown, title="Sell Signal", text="SELL")

// Strategy Entries and Exits
if (buySignalEMA)
    strategy.entry("Buy", strategy.long)

if (sellSignalEMA)
    strategy.close("Buy")
相关推荐