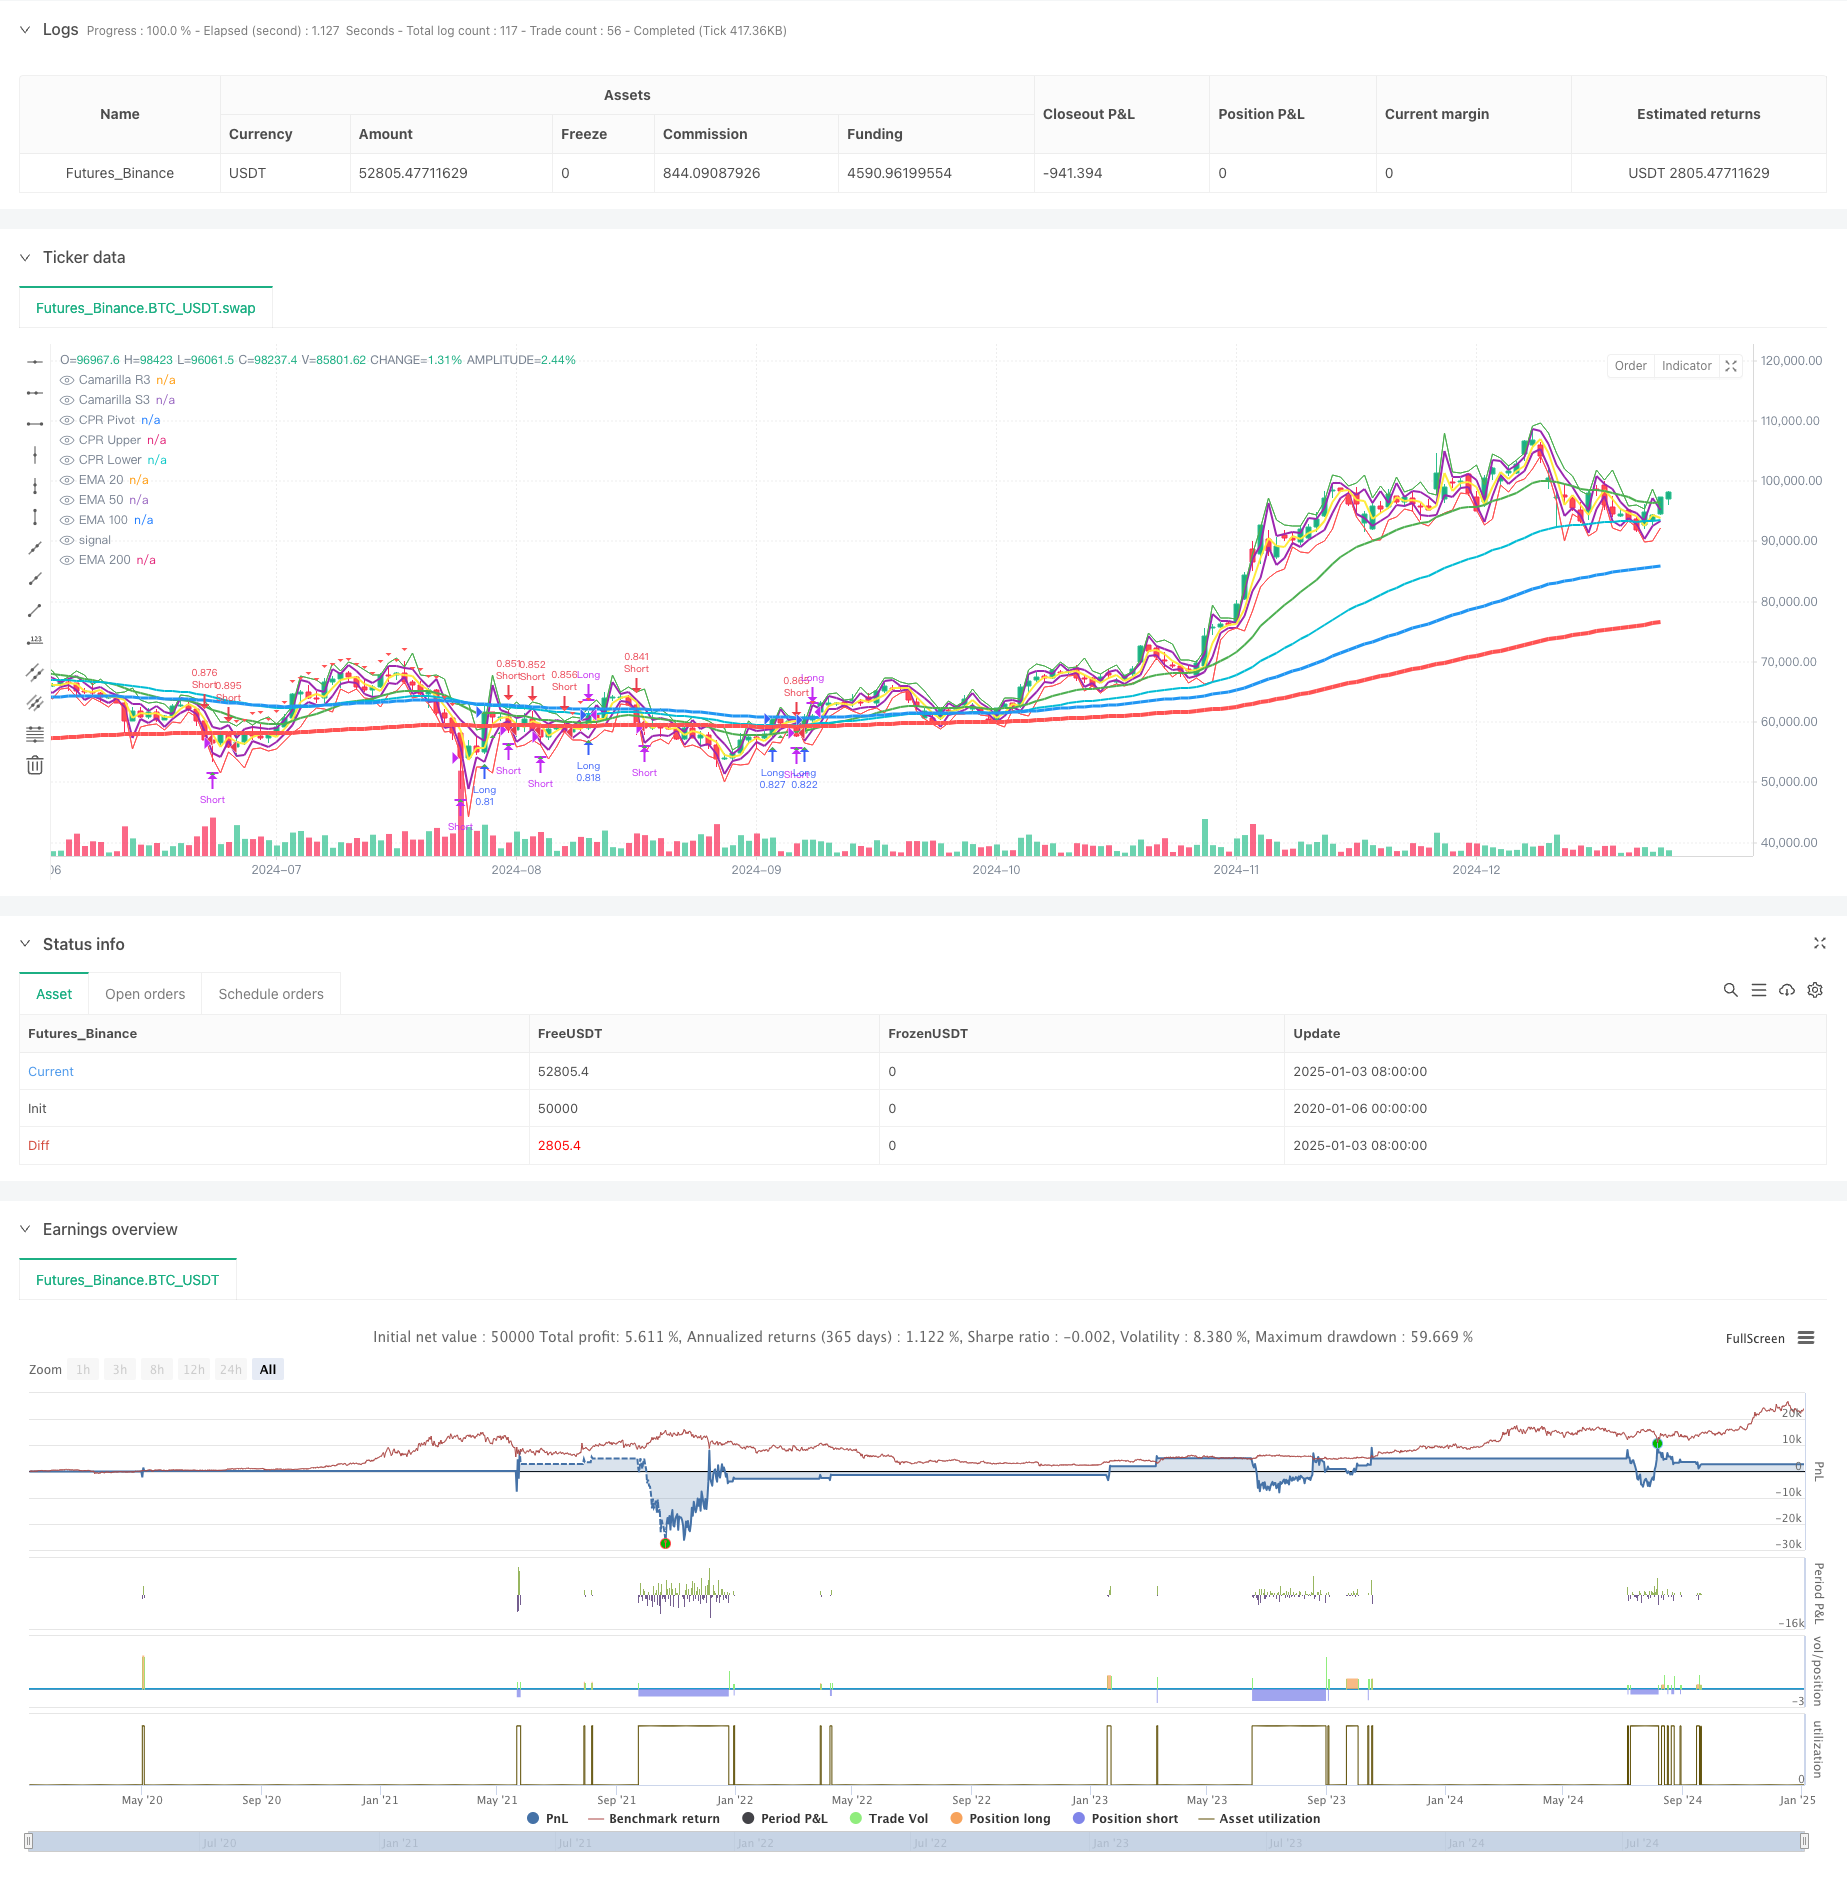
概述
本策略是一个结合了多重指数移动平均线(EMA)、Camarilla支撑阻力位和中枢范围(CPR)的趋势跟踪交易系统。该策略通过分析价格与多条均线的关系以及重要价格区间来识别市场趋势和潜在的交易机会。系统采用了严格的资金管理和风险控制措施,包括百分比持仓规模和多样化的退出机制。
策略原理
策略主要基于以下几个核心组件: 1. 多重均线系统(EMA20/50/100/200)用于确认趋势方向和强度 2. Camarilla支撑阻力位(R3/S3)用于识别关键价格水平 3. 中枢范围(CPR)用于确定日内交易区间 4. 入场信号基于价格与EMA200的交叉以及EMA20的确认 5. 出场策略包括固定点数和百分比移动两种模式 6. 资金管理系统根据账户规模动态调整持仓大小
策略优势
- 多维度技术指标的结合提供了更可靠的交易信号
- 灵活的退出机制适应不同市场环境
- 完善的资金管理系统有效控制风险
- 趋势跟踪特性有助于捕捉大行情
- 可视化组件便于交易者理解市场结构
策略风险
- 在震荡市场中可能产生虚假信号
- 多重指标可能导致交易信号滞后
- 固定退出点位可能在高波动市场中表现欠佳
- 需要较大的资金规模以承受回撤
- 交易成本可能影响策略整体收益
策略优化方向
- 引入波动率指标动态调整进出场参数
- 增加市场状态识别模块以适应不同市场环境
- 优化资金管理系统,加入动态持仓管理
- 添加交易时间过滤器提高信号质量
- 考虑加入成交量分析增强信号可靠性
总结
该策略通过整合多个经典技术分析工具,构建了一个完整的交易系统。系统的优势在于多维度的市场分析和严格的风险管理,但同时也需要注意应对不同市场环境的适应性。通过持续优化和改进,策略有望在保持稳定性的同时提升盈利能力。
策略源码
/*backtest
start: 2020-01-06 00:00:00
end: 2025-01-04 08:00:00
period: 1d
basePeriod: 1d
exchanges: [{"eid":"Futures_Binance","currency":"BTC_USDT"}]
*/

//@version=5
strategy("Pradeep Crude oil Entry and Exit", overlay=true)

// Input settings for EMAs
ema20_period = input.int(20, title="EMA 20 Period")
ema50_period = input.int(50, title="EMA 50 Period")
ema100_period = input.int(100, title="EMA 100 Period")
ema200_period = input.int(200, title="EMA 200 Period")

// Fixed line width settings for EMAs
ema20_width = 2  // EMA 20 Line Width
ema50_width = 2  // EMA 50 Line Width
ema100_width = 3 // EMA 100 Line Width
ema200_width = 4 // EMA 200 Line Width

// Backtesting inputs
initial_capital = input.float(50000, title="Initial Capital", minval=100)
position_size_percent = input.float(100, title="Position Size (% of Capital)", minval=0.1, maxval=100)
exit_mode = input.string("Price Movement", title="Exit Mode", options=["Price Movement", "Percentage Movement"])
exit_points = input.int(20, title="Exit After X Points", minval=1)
exit_percentage = input.float(1.0, title="Exit After X% Movement", minval=0.1, step=0.1)

// Calculate EMAs
ema20 = ta.ema(close, ema20_period)
ema50 = ta.ema(close, ema50_period)
ema100 = ta.ema(close, ema100_period)
ema200 = ta.ema(close, ema200_period)

// Signal conditions
long_entry_condition = close > ema200 and close > ema20 and close[1] <= ema200
long_exit_condition = (exit_mode == "Price Movement" and close - strategy.position_avg_price >= exit_points * syminfo.mintick) or
                      (exit_mode == "Percentage Movement" and (close - strategy.position_avg_price) / strategy.position_avg_price * 100 >= exit_percentage)
short_entry_condition = close < ema200 and close < ema20 and close[1] >= ema200
short_exit_condition = (exit_mode == "Price Movement" and strategy.position_avg_price - close >= exit_points * syminfo.mintick) or
                       (exit_mode == "Percentage Movement" and (strategy.position_avg_price - close) / strategy.position_avg_price * 100 >= exit_percentage)

// Plot EMAs with specified line widths
plot(ema20, color=color.green, title="EMA 20", linewidth=ema20_width)
plot(ema50, color=color.aqua, title="EMA 50", linewidth=ema50_width)
plot(ema100, color=color.blue, title="EMA 100", linewidth=ema100_width)
plot(ema200, color=color.red, title="EMA 200", linewidth=ema200_width)

// Camarilla Pivot Calculation
prev_high = request.security(syminfo.tickerid, "D", high[1])
prev_low = request.security(syminfo.tickerid, "D", low[1])
prev_close = request.security(syminfo.tickerid, "D", close[1])

R3 = prev_close + (prev_high - prev_low) * 1.1 / 2
S3 = prev_close - (prev_high - prev_low) * 1.1 / 2

// Central Pivot Range (CPR) Calculation
pivot = (prev_high + prev_low + prev_close) / 3
upper_cpr = pivot + (prev_high - prev_low)
lower_cpr = pivot - (prev_high - prev_low)

// Plot Camarilla R3, S3 and CPR levels
plot(R3, color=color.purple, title="Camarilla R3", linewidth=2)
plot(S3, color=color.purple, title="Camarilla S3", linewidth=2)
plot(pivot, color=color.yellow, title="CPR Pivot", linewidth=2)
plot(upper_cpr, color=color.green, title="CPR Upper", linewidth=1)
plot(lower_cpr, color=color.red, title="CPR Lower", linewidth=1)

// Backtesting: Capital and position size
capital = initial_capital
risk_per_trade = (position_size_percent / 100) * capital

// Long positions
if long_entry_condition
    strategy.entry("Long", strategy.long, qty=risk_per_trade / close)
    // Display entry price label
    label.new(bar_index, close, text="Entry: " + str.tostring(close), color=color.green, style=label.style_label_up, yloc=yloc.belowbar)

if long_exit_condition
    strategy.close("Long")
    // Display exit price label
    label.new(bar_index, close, text="Exit: " + str.tostring(close), color=color.red, style=label.style_label_down, yloc=yloc.abovebar)

// Short positions
if short_entry_condition
    strategy.entry("Short", strategy.short, qty=risk_per_trade / close)
    // Display entry price label
    label.new(bar_index, close, text="Entry: " + str.tostring(close), color=color.red, style=label.style_label_down, yloc=yloc.abovebar)

if short_exit_condition
    strategy.close("Short")
    // Display exit price label
    label.new(bar_index, close, text="Exit: " + str.tostring(close), color=color.green, style=label.style_label_up, yloc=yloc.belowbar)

// Plot signals
plotshape(long_entry_condition, style=shape.triangleup, location=location.belowbar, color=color.new(color.green, 0), size=size.small, title="Long Entry")
plotshape(long_exit_condition, style=shape.triangledown, location=location.abovebar, color=color.new(color.red, 0), size=size.small, title="Long Exit")
plotshape(short_entry_condition, style=shape.triangledown, location=location.abovebar, color=color.new(color.red, 0), size=size.small, title="Short Entry")
plotshape(short_exit_condition, style=shape.triangleup, location=location.belowbar, color=color.new(color.green, 0), size=size.small, title="Short Exit")
相关推荐