概述
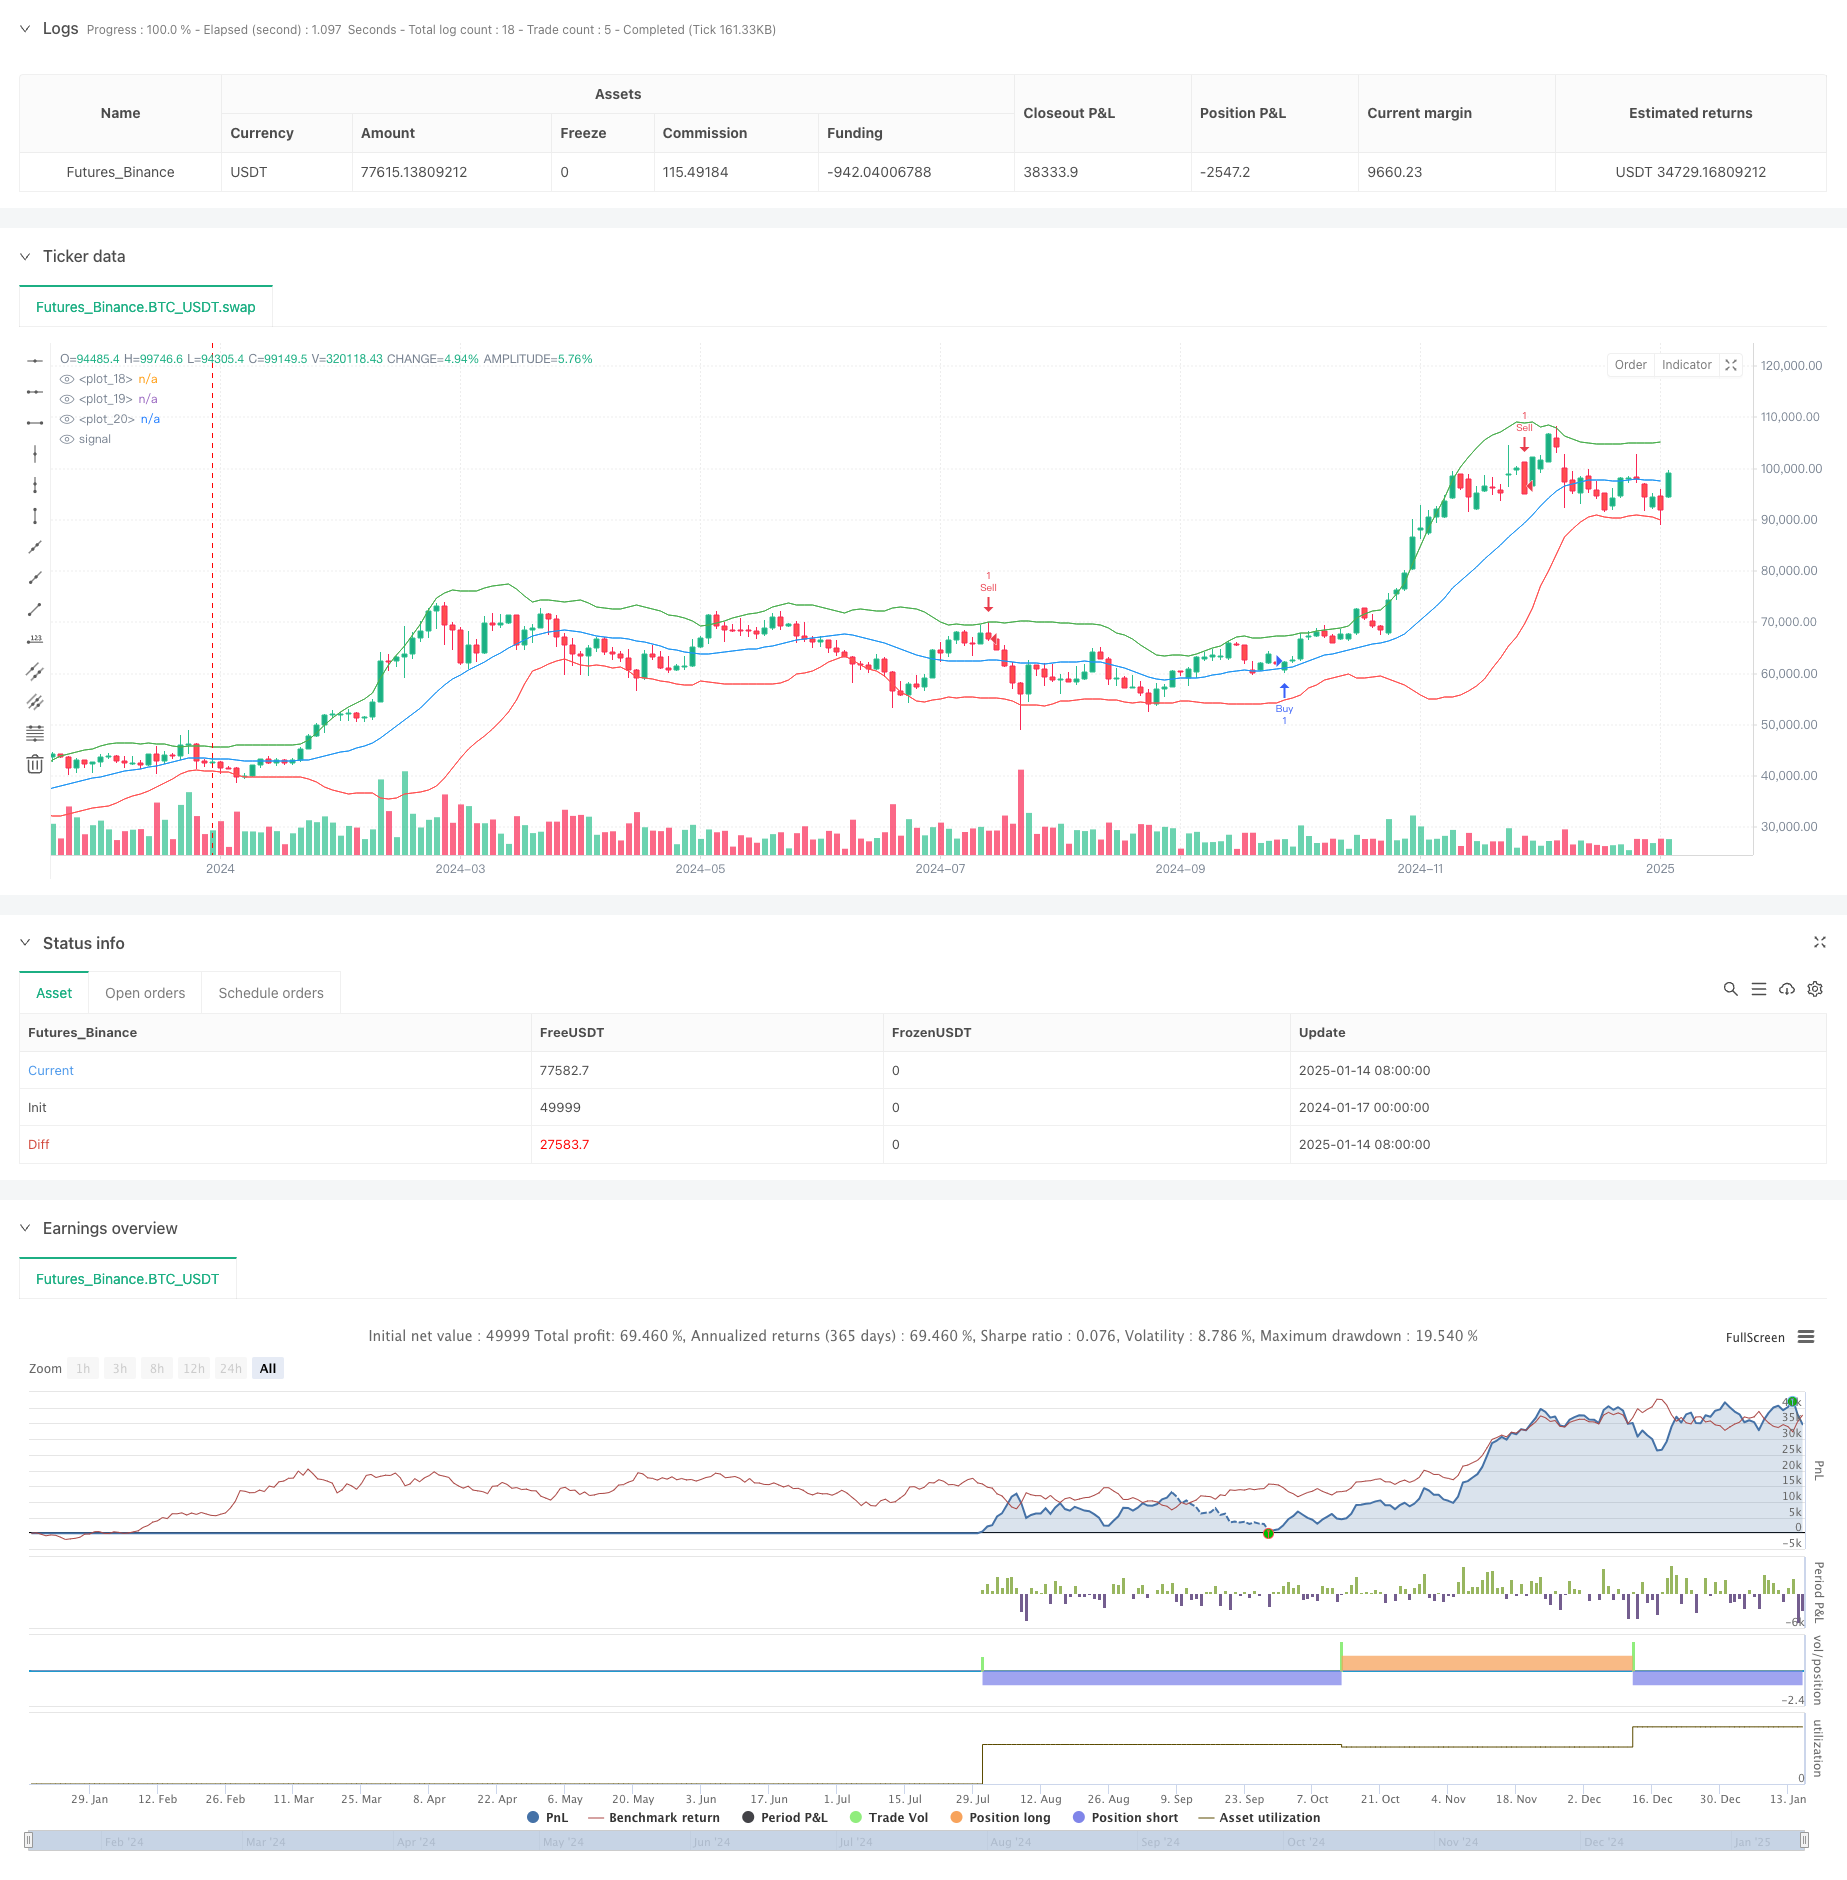
该策略是一个结合了K近邻(KNN)机器学习算法、烛台形态识别和成交量分析的综合交易系统。策略通过多维度分析方法,包括移动平均通道、成交量阈值验证和概率统计,对市场形成立体化分析框架,从而捕捉潜在的交易机会。
策略原理
策略的核心逻辑建立在以下几个关键要素之上: 1. 使用移动平均(SMA)和标准差构建价格通道,用于识别超买超卖区域 2. 通过程序化定义的条件识别九种经典烛台形态,包括锤子线、流星线、吞没形态等 3. 引入KNN算法对历史价格走势进行学习,预测未来可能的价格走向 4. 使用成交量作为信号确认指标,要求信号触发时成交量必须高于设定阈值 5. 计算上涨和下跌的概率分布,将其作为信号过滤条件之一
策略优势
- 多层次的信号确认机制显著提高了交易的可靠性
- KNN算法的引入为传统技术分析提供了机器学习的视角
- 成交量验证机制有效避免了虚假突破
- 支持和阻力线的动态绘制有助于把握重要价位
- 完善的警报系统确保不会错过重要交易机会
- 策略参数可调节性强,适应不同市场环境
策略风险
- KNN算法在剧烈波动市场中可能产生滞后
- 过多的信号过滤条件可能导致错过部分交易机会
- 固定的成交量阈值在不同时期可能需要动态调整
- 在横盘整理阶段可能产生过多虚假信号 建议采用:
- 动态调整算法参数
- 引入市场环境识别机制
- 设置最大亏损限制
- 建立仓位管理系统
策略优化方向
- 引入自适应参数调节机制,使策略能够根据市场状态自动调整参数
- 整合深度学习算法,提升预测准确率
- 加入更多的市场微观结构指标
- 优化成交量阈值的动态计算方法
- 建立更完善的风险控制体系
总结
该策略通过将传统技术分析与现代机器学习方法相结合,构建了一个稳健的交易系统。策略的多维度分析框架和严格的信号确认机制,为交易决策提供了可靠的依据。通过持续优化和风险控制,该策略有望在各种市场环境下保持稳定的表现。
策略源码
/*backtest
start: 2024-01-17 00:00:00
end: 2025-01-16 00:00:00
period: 2d
basePeriod: 2d
exchanges: [{"eid":"Futures_Binance","currency":"BTC_USDT","balance":49999}]
*/

//@version=6
strategy("Candle Pattern Analyzer with Volume", overlay=true)

// Input parameters
length = input.int(20, "Channel Length", minval=1)
mult = input.float(2.0, "Volatility Multiplier", minval=0.1)
candleLength = input.int(5, "Candle Length", minval=1)
k = input.int(5, "KNN Neighbors", minval=1)
volumeThreshold = input.int(100000, "Volume Threshold", minval=1)

// Calculate channel
basis = ta.sma(close, length)
dev = mult * ta.stdev(close, length)
upper = basis + dev
lower = basis - dev

// Plot channel
plot(basis, color=color.blue)
plot(upper, color=color.green)
plot(lower, color=color.red)

// Identify candle patterns
isBullish = close > open
isBearish = close < open

// Pre-calculate SMAs
smaLow = ta.sma(low, candleLength)
smaHigh = ta.sma(high, candleLength)
smaClose = ta.sma(close, candleLength)

// Hammer pattern
isHammer = isBullish and
           low < smaLow and
           close > smaClose and
           (close - low) / (high - low) > 0.6 and
           low < low[1]

// Shooting Star pattern
isShootingStar = isBearish and
                 high > smaHigh and
                 close < smaClose and
                 (high - close) / (high - low) > 0.6 and
                 high > high[1]

// Inverse Hammer pattern
isInverseHammer = isBullish and
                   high > smaHigh and
                   close < smaClose and
                   (high - close) / (high - low) > 0.6 and
                   high > high[1]

// Bullish Engulfing pattern
isBullishEngulfing = isBullish and
                      close > high[1] and
                      open < low[1]

// Bearish Engulfing pattern
isBearishEngulfing = isBearish and
                      close < low[1] and
                      open > high[1]

// Morning Star pattern
isMorningStar = isBullish and close[2] < open[2] and close[1] < open[1] and  close > open[1]

// Evening Star pattern
isEveningStar = isBearish and  close[2] > open[2] and  close[1] > open[1] and  close < open[1]

// Three Black Crows pattern
isThreeBlackCrows = isBearish and
                     close < close[1] and
                     close[1] < close[2] and
                     close[2] < close[3]

// Three White Soldiers pattern
isThreeWhiteSoldiers = isBullish and close > close[1] and  close[1] > close[2] and  close[2] > close[3]

// Compare previous candles
prevCandleUp = close[1] > open[1]
prevCandleDown = close[1] < open[1]

// Calculate probability
probUp = ta.sma(close > open ? 1 : 0, candleLength) / candleLength
probDown = ta.sma(close < open ? 1 : 0, candleLength) / candleLength

// Generate signals
buySignal = isHammer and prevCandleDown and probUp > probDown and volume > volumeThreshold
sellSignal = isShootingStar and prevCandleUp and probDown > probUp and volume > volumeThreshold

// Highlight patterns
color candleColor = na
if (isHammer)
    candleColor := color.green
    label.new(bar_index, high, "Hammer", color=color.green, style=label.style_label_up)

else if (isShootingStar)
    candleColor := color.red
    label.new(bar_index, low, "Shooting Star", color=color.red, style=label.style_label_down)
else if (isInverseHammer)
    candleColor := color.blue
    label.new(bar_index, high, "Inverse Hammer", color=color.blue, style=label.style_label_up)
else if (isBullishEngulfing)
    candleColor := color.yellow
    label.new(bar_index, high, "Bullish Engulfing", color=color.yellow, style=label.style_label_up)
else if (isBearishEngulfing)
    candleColor := color.purple
    label.new(bar_index, low, "Bearish Engulfing", color=color.purple, style=label.style_label_down)

else if (isMorningStar)
    candleColor := color.orange
    label.new(bar_index, high, "Morning Star", color=color.orange, style=label.style_label_up)

else if (isEveningStar)
    candleColor := color.new(color.red, 80)
    label.new(bar_index, low, "Evening Star", color=color.new(color.red, 80), style=label.style_label_down)

else if (isThreeBlackCrows)
    candleColor := color.black
    label.new(bar_index, low, "Three Black Crows", color=color.black, style=label.style_label_down)

else if (isThreeWhiteSoldiers)
    candleColor := color.white
    label.new(bar_index, high, "Three White Soldiers", color=color.white, style=label.style_label_up)


// Plot candles
barcolor(candleColor)

// KNN algorithm
var float[] knnData = array.new_float(k, na)
var float[] knnLabels = array.new_float(k, na) // Create an array to store KNN labels
array.set(knnLabels, 0, 1.0) // Label for "up" movement

// Shift KNN dataset to make room for new data point
for i = 1 to k-1
    array.set(knnData, i, array.get(knnData, i-1))
    array.set(knnLabels, i, array.get(knnLabels, i-1))

// Predict next movement using KNN algorithm
float prediction = 0.0
for i = 0 to k-1
    float distance = math.abs(close - array.get(knnData, i))
    prediction += array.get(knnLabels, i) / distance

prediction /= k

// Plot prediction
// line.new(bar_index, close, bar_index + 1, prediction, color=color.purple)

// Plot resistance and support lines
float resistance = ta.sma(high, length)
float support = ta.sma(low, length)
// line.new(bar_index, resistance, bar_index + 1, resistance, color=color.green, style=line.style_dashed)
// line.new(bar_index, support, bar_index + 1, support, color=color.red, style=line.style_dashed)

// Plot buy and sell signals with prices
if (buySignal)
    // label.new(bar_index, low, "Buy at " + str.tostring(low), color=color.green, style=label.style_label_up)
    strategy.entry("Buy", strategy.long, comment="Buy at " + str.tostring(low))
if (sellSignal)
    // label.new(bar_index, high, "Sell at " + str.tostring(high), color=color.red, style=label.style_label_down)
    strategy.entry("Sell", strategy.short, comment="Sell at " + str.tostring(high))

// Create alerts
alertcondition(buySignal, title="Buy Signal", message="Buy signal generated!")
alertcondition(sellSignal, title="Sell Signal", message="Sell signal generated!")
相关推荐