基于随机行情生成器的策略测试方法探讨
 0
0
 304
304
[TOC]

前言
发明者量化交易平台的回测系统是一个不停迭代更新升级的回测系统,从最初的基本回测功能,逐步增加功能、优化性能。随着平台的发展回测系统会持续优化升级,今天我们就来基于回测系统探讨一个话题:「基于随机行情的策略测试」。
需求
在量化交易领域,策略的开发与优化离不开真实市场数据的验证。然而,在实际应用中,由于市场环境复杂多变,依赖历史数据进行回测可能存在不足,比如缺乏对极端行情或特殊场景的覆盖。因此,设计一个高效的随机行情生成器,成为量化策略开发者的有效工具。
当我们需要让策略在某个交易所,某个币种上回溯历史数据时,可以使用FMZ平台的官方数据源进行回测。有些时候我们也想看看策略如果在一个完全”陌生“的市场中是怎么样的表现,这个时候就可以“编造”一些数据来给策略测试。
使用随机行情数据的意义有: - 1. 评估策略的鲁棒性 随机行情生成器可以创建各种可能的市场情景,包括极端波动、低波动、趋势市和震荡市等。在这些模拟环境下测试策略,可以帮助评估其在不同市场条件下的表现是否稳定。例如:
策略是否能适应趋势和震荡切换? 策略在极端行情中是否会发生大幅亏损?
- 2. 识别策略的潜在弱点 通过模拟一些异常市场情况(例如假设的黑天鹅事件),可以发现策略的潜在弱点并进行改进。例如:
策略是否会过度依赖某种市场结构? 是否存在参数过拟合的风险?
-
- 优化策略参数 随机生成的数据为策略参数调优提供了更多样化的测试环境,不必完全依赖历史数据。这样可以更全面地找到策略的参数范围,避免局限于历史数据中的特定市场模式。
-
- 填补历史数据的不足 在某些市场(例如新兴市场或小币种交易市场),历史数据可能不足以覆盖所有可能的市场状况。随机行情生成器可以提供大量的补充数据,帮助进行更全面的测试。
-
- 快速迭代开发 使用随机数据进行快速测试,可以加快策略开发的迭代速度,而无需依赖实时市场行情或耗时的数据清洗和整理。
但是也需要理性评估策略,对于随机生成的行情数据,注意事项:
- 1、尽管随机行情生成器很有用,但其意义依赖于生成数据的质量和目标场景的设计:
- 2、生成逻辑需贴近真实市场:如果随机生成的行情完全脱离现实,测试结果可能缺乏参考价值。例如,可以结合实际市场统计特征(如波动率分布、趋势比例)来设计生成器。
- 3、不能完全替代真实数据测试:随机数据仅能补充策略的开发与优化,最终策略仍需在真实市场数据中验证其有效性。
说了那么多,我们如何才能”编造“一些数据。如何可以方便、快捷、易用的“编造”出数据让回测系统使用呢?
设计思路
本篇设计抛砖引玉,给出比较简陋的随机行情生成计算,实际有多种多样的模拟算法、数据模型等技术可以应用,因为讨论篇幅有限就不使用特别复杂的数据模拟方法。
结合平台回测系统的自定义数据源功能,我们使用Python语言编写一个程序。
- 1、随机生成一组K线数据写入CSV文件持久化记录,这样可以让生成的数据可以保存记录。
- 2、然后创建一个服务给回测系统提供数据源支持。
- 3、把生成的K线数据在图表中展示出来。
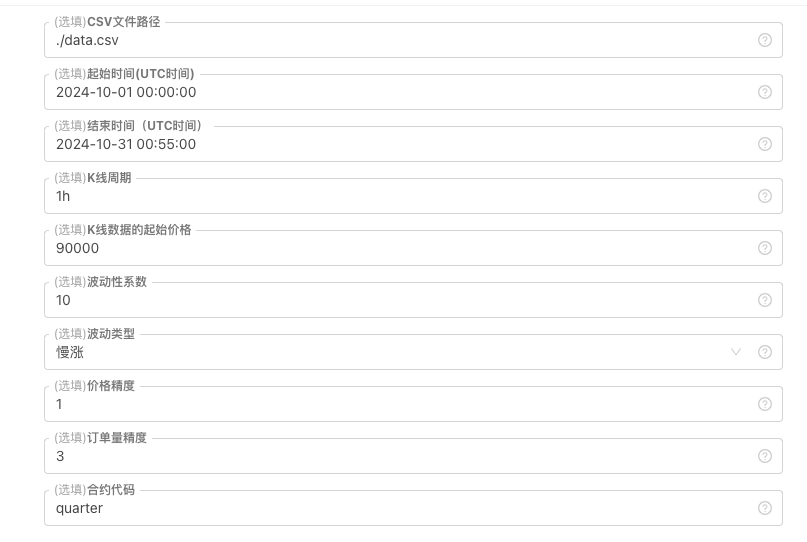
对于K线数据的一些生成标准、文件储存等,可以定义以下参数控制:

数据随机生成的模式 对于模拟K线数据的波动类型,只是简单的使用随机数为正负的概率不同进行简单的设计,当生成的数据不多时可能无法体现出需要的行情模式。如果有更好的方法,可以替换掉这一部分代码。 基于这种简单的设计,调整代码中的随机数生成范围和一些系数,可以影响生成的数据效果。
数据检验 对于生成的K线数据也需要合理性检测,检查高开低收价格是否违背定义,检查K线数据连续性等。
回测系统随机行情生成器
import _thread
import json
import math
import csv
import random
import os
import datetime as dt
from http.server import HTTPServer, BaseHTTPRequestHandler
from urllib.parse import parse_qs, urlparse

arrTrendType = ["down", "slow_up", "sharp_down", "sharp_up", "narrow_range", "wide_range", "neutral_random"]

def url2Dict(url):
    query = urlparse(url).query
    params = parse_qs(query)
    result = {key: params[key][0] for key in params}
    return result

class Provider(BaseHTTPRequestHandler):
    def do_GET(self):
        global filePathForCSV, pround, vround, ct
        try:
            self.send_response(200)
            self.send_header("Content-type", "application/json")
            self.end_headers()

            dictParam = url2Dict(self.path)
            Log("自定义数据源服务接收到请求,self.path:", self.path, "query 参数:", dictParam)

            eid = dictParam["eid"]
            symbol = dictParam["symbol"]
            arrCurrency = symbol.split(".")[0].split("_")
            baseCurrency = arrCurrency[0]
            quoteCurrency = arrCurrency[1]
            fromTS = int(dictParam["from"]) * int(1000)
            toTS = int(dictParam["to"]) * int(1000)
            priceRatio = math.pow(10, int(pround))
            amountRatio = math.pow(10, int(vround))

            data = {
                "detail": {
                    "eid": eid,
                    "symbol": symbol,
                    "alias": symbol,
                    "baseCurrency": baseCurrency,
                    "quoteCurrency": quoteCurrency,
                    "marginCurrency": quoteCurrency,
                    "basePrecision": vround,
                    "quotePrecision": pround,
                    "minQty": 0.00001,
                    "maxQty": 9000,
                    "minNotional": 5,
                    "maxNotional": 9000000,
                    "priceTick": 10 ** -pround,
                    "volumeTick": 10 ** -vround,
                    "marginLevel": 10,
                    "contractType": ct
                },
                "schema" : ["time", "open", "high", "low", "close", "vol"],
                "data" : []
            }

            listDataSequence = []
            with open(filePathForCSV, "r") as f:
                reader = csv.reader(f)
                header = next(reader)
                headerIsNoneCount = 0
                if len(header) != len(data["schema"]):
                    Log("CSV文件格式有误,列数不同,请检查!", "#FF0000")
                    return
                for ele in header:
                    for i in range(len(data["schema"])):
                        if data["schema"][i] == ele or ele == "":
                            if ele == "":
                                headerIsNoneCount += 1
                            if headerIsNoneCount > 1:
                                Log("CSV文件格式有误,请检查!", "#FF0000")
                                return
                            listDataSequence.append(i)
                            break

                while True:
                    record = next(reader, -1)
                    if record == -1:
                        break
                    index = 0
                    arr = [0, 0, 0, 0, 0, 0]
                    for ele in record:
                        arr[listDataSequence[index]] = int(ele) if listDataSequence[index] == 0 else (int(float(ele) * amountRatio) if listDataSequence[index] == 5 else int(float(ele) * priceRatio))
                        index += 1
                    data["data"].append(arr)
            Log("数据data.detail:", data["detail"], "响应回测系统请求。")
            self.wfile.write(json.dumps(data).encode())
        except BaseException as e:
            Log("Provider do_GET error, e:", e)
        return

def createServer(host):
    try:
        server = HTTPServer(host, Provider)
        Log("Starting server, listen at: %s:%s" % host)
        server.serve_forever()
    except BaseException as e:
        Log("createServer error, e:", e)
        raise Exception("stop")

class KlineGenerator:
    def __init__(self, start_time, end_time, interval):
        self.start_time = dt.datetime.strptime(start_time, "%Y-%m-%d %H:%M:%S")
        self.end_time = dt.datetime.strptime(end_time, "%Y-%m-%d %H:%M:%S")
        self.interval = self._parse_interval(interval)
        self.timestamps = self._generate_time_series()

    def _parse_interval(self, interval):
        unit = interval[-1]
        value = int(interval[:-1])

        if unit == "m":
            return value * 60
        elif unit == "h":
            return value * 3600
        elif unit == "d":
            return value * 86400
        else:
            raise ValueError("不支持的K线周期,请使用 'm', 'h', 或 'd'.")

    def _generate_time_series(self):
        timestamps = []
        current_time = self.start_time
        while current_time <= self.end_time:
            timestamps.append(int(current_time.timestamp() * 1000))
            current_time += dt.timedelta(seconds=self.interval)
        return timestamps

    def generate(self, initPrice, trend_type="neutral", volatility=1):
        data = []
        current_price = initPrice
        angle = 0
        for timestamp in self.timestamps:
            angle_radians = math.radians(angle % 360)
            cos_value = math.cos(angle_radians)

            if trend_type == "down":
                upFactor = random.uniform(0, 0.5)
                change = random.uniform(-0.5, 0.5 * upFactor) * volatility * random.uniform(1, 3)
            elif trend_type == "slow_up":
                downFactor = random.uniform(0, 0.5)
                change = random.uniform(-0.5 * downFactor, 0.5) * volatility * random.uniform(1, 3)
            elif trend_type == "sharp_down":
                upFactor = random.uniform(0, 0.5)
                change = random.uniform(-10, 0.5 * upFactor) * volatility * random.uniform(1, 3)
            elif trend_type == "sharp_up":
                downFactor = random.uniform(0, 0.5)
                change = random.uniform(-0.5 * downFactor, 10) * volatility * random.uniform(1, 3)
            elif trend_type == "narrow_range":
                change = random.uniform(-0.2, 0.2) * volatility * random.uniform(1, 3)
            elif trend_type == "wide_range":
                change = random.uniform(-3, 3) * volatility * random.uniform(1, 3)
            else:
                change = random.uniform(-0.5, 0.5) * volatility * random.uniform(1, 3)

            change = change + cos_value * random.uniform(-0.2, 0.2) * volatility
            open_price = current_price
            high_price = open_price + random.uniform(0, abs(change))
            low_price = max(open_price - random.uniform(0, abs(change)), random.uniform(0, open_price))
            close_price = open_price + change if open_price + change < high_price and open_price + change > low_price else random.uniform(low_price, high_price)

            if (high_price >= open_price and open_price >= close_price and close_price >= low_price) or (high_price >= close_price and close_price >= open_price and open_price >= low_price):
                pass
            else:
                Log("异常数据:", high_price, open_price, low_price, close_price, "#FF0000")

            high_price = max(high_price, open_price, close_price)
            low_price = min(low_price, open_price, close_price)

            base_volume = random.uniform(1000, 5000)
            volume = base_volume * (1 + abs(change) * 0.2)

            kline = {
                "Time": timestamp,
                "Open": round(open_price, 2),
                "High": round(high_price, 2),
                "Low": round(low_price, 2),
                "Close": round(close_price, 2),
                "Volume": round(volume, 2),
            }
            data.append(kline)
            current_price = close_price
            angle += 1
        return data

    def save_to_csv(self, filename, data):
        with open(filename, mode="w", newline="") as csvfile:
            writer = csv.writer(csvfile)
            writer.writerow(["", "open", "high", "low", "close", "vol"])
            for idx, kline in enumerate(data):
                writer.writerow(
                    [kline["Time"], kline["Open"], kline["High"], kline["Low"], kline["Close"], kline["Volume"]]
                )

        Log("当前路径:", os.getcwd())
        with open("data.csv", "r") as file:
            lines = file.readlines()
            if len(lines) > 1:
                Log("文件写入成功,以下是文件内容的一部分:")
                Log("".join(lines[:5]))
            else:
                Log("文件写入失败,文件为空!")

def main():
    Chart({})
    LogReset(1)

    try:
        # _thread.start_new_thread(createServer, (("localhost", 9090), ))
        _thread.start_new_thread(createServer, (("0.0.0.0", 9090), ))
        Log("开启自定义数据源服务线程,数据由CSV文件提供。", ", 地址/端口:0.0.0.0:9090", "#FF0000")
    except BaseException as e:
        Log("启动自定义数据源服务失败!")
        Log("错误信息:", e)
        raise Exception("stop")

    while True:
        cmd = GetCommand()
        if cmd:
            if cmd == "createRecords":
                Log("生成器参数:", "起始时间:", startTime, "结束时间:", endTime, "K线周期:", KLinePeriod, "初始价格:", firstPrice, "波动类型:", arrTrendType[trendType], "波动性系数:", ratio)
                generator = KlineGenerator(
                    start_time=startTime,
                    end_time=endTime,
                    interval=KLinePeriod,
                )
                kline_data = generator.generate(firstPrice, trend_type=arrTrendType[trendType], volatility=ratio)
                generator.save_to_csv("data.csv", kline_data)
                ext.PlotRecords(kline_data, "%s_%s" % ("records", KLinePeriod))
        LogStatus(_D())
        Sleep(2000)
回测系统中实践
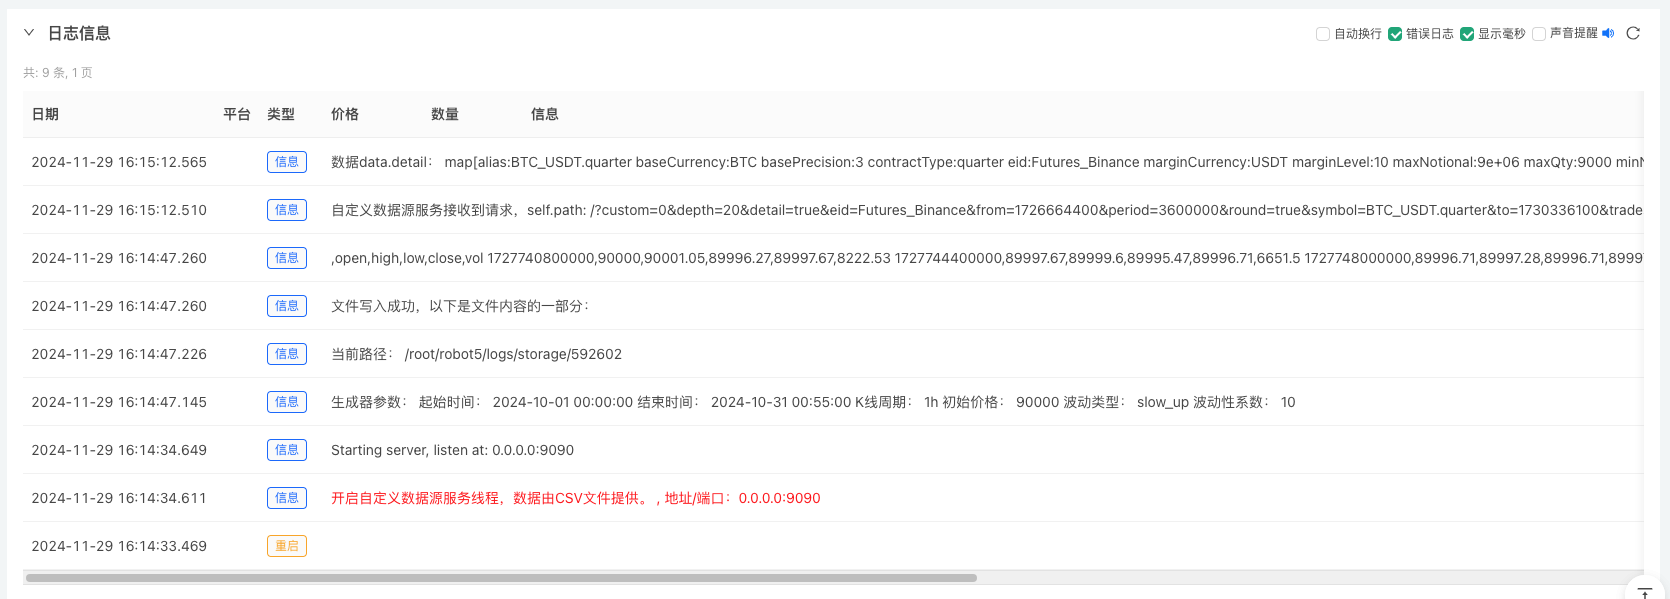
1、创建以上策略实例,配置参数,运行。 2、实盘(策略实例)需要运行在部署在服务器的托管者上,因为需要有公网IP,回测系统才能访问到,才可以取到数据。 3、点击交互按钮,策略就会自动开始生成随机行情数据。


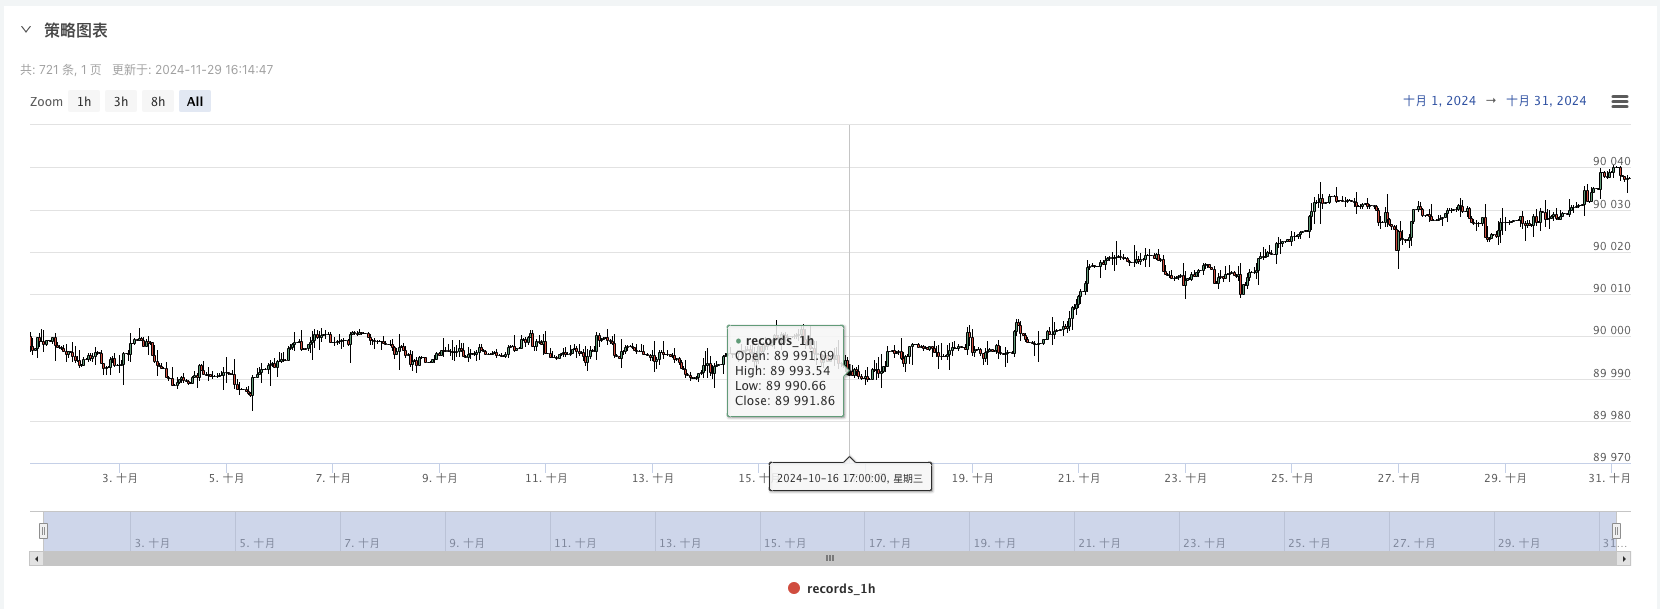
4、生成好的数据会显示在图表上,方便观察,同时数据会记录在本地的data.csv文件

5、此时我们就可以使用这个随机生成的数据了,随便使用一个策略进行回测

/*backtest
start: 2024-10-01 08:00:00
end: 2024-10-31 08:55:00
period: 1h
basePeriod: 1h
exchanges: [{"eid":"Futures_Binance","currency":"BTC_USDT","feeder":"http://xxx.xxx.xxx.xxx:9090"}]
args: [["ContractType","quarter",358374]]
*/
根据以上信息配置,具体调整。http://xxx.xxx.xxx.xxx:9090是随机行情生成策略实盘的服务器IP地址和开启的端口。
这个就是自定义数据源,可以查询平台API文档中自定义数据源章节了解。
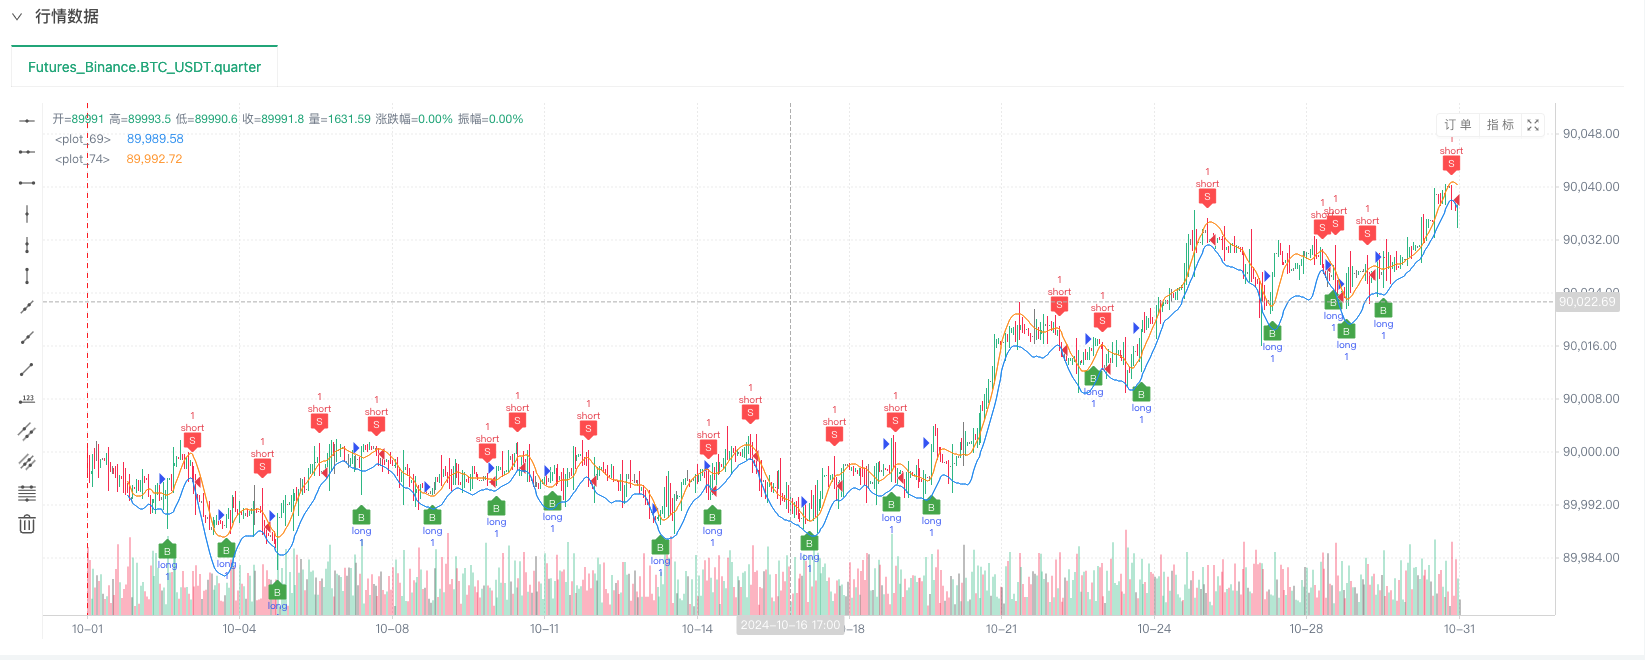
6、回测系统设置好数据源就可以测试随机行情数据了


此时回测系统就是用我们“编造”的模拟数据进行测试了。根据回测时行情图表中的数据,对比随机行情生成实盘图表中的数据,时间:2024年10月16日17点整,数据是一样的。
7、哦对,差点忘记说!这个随机行情生成器的python程序之所以创建一个实盘是为了方便演示、操作、展示生成的K线数据。实际应用时完全可以写一个独立的python脚本,这样就不用运行实盘啦。
策略源码:回测系统随机行情生成器
感谢支持与阅读。
- 数字货币中的Lead-Lag套利介绍(3)
- Introduction to Lead-Lag Arbitrage in Cryptocurrency (2)
- 数字货币中的Lead-Lag套利介绍(2)
- Discussion on External Signal Reception of FMZ Platform: A Complete Solution for Receiving Signals with Built-in Http Service in Strategy
- FMZ平台外部信号接收的探讨:策略内置Http服务接收信号的完整方案
- Introduction to Lead-Lag Arbitrage in Cryptocurrency (1)
- 数字货币中的Lead-Lag套利介绍(1)
- Discussion on External Signal Reception of FMZ Platform: Extended API VS Strategy Built-in HTTP Service
- FMZ平台外部信号接收的探讨:扩展API vs 策略内置HTTP服务
- Discussion on Strategy Testing Method Based on Random Ticker Generator
- New Feature of FMZ Quant: Use _Serve Function to Create HTTP Services Easily
- 发明者量化新功能:使用 _Serve 函数轻松创建 HTTP 服务
- FMZ Quant Trading Platform Custom Protocol Access Guide
- FMZ Funding Rate Acquisition and Monitoring Strategy
- FMZ资金费率获取与监控策略策略
- A Strategy Template Allows You to Use WebSocket Market Seamlessly
- 一个策略模板让你无缝使用WebSocket行情
- 发明者量化交易平台通用协议接入指南
- How to Build a Universal Multi-Currency Trading Strategy Quickly after FMZ Upgrade
- FMZ升级后,如何快捷构建通用多币种交易策略