কমোডিটি ফিউচার ভলিউম ফুটপ্রিন্ট চার্ট বিশ্লেষণ ও বাস্তবায়ন
লেখক:ভাল, তৈরিঃ 2020-07-03 11:06:48, আপডেটঃ 2023-10-28 15:30:11
সংক্ষিপ্তসার
কোয়ান্টাম ফুটপ্রিন্ট চার্ট একটি উন্নত চার্ট বিশ্লেষণ সরঞ্জাম, ইংরেজি নাম
কোয়ান্টাম ফুটপ্রিন্ট কি?
সহজভাবে বলতে গেলে, কোয়ান্টাম ফুটপ্রিন্ট বিভিন্ন মূল্য স্তরে ক্রেতা এবং বিক্রেতাদের কী হয় তা মাইক্রো-বিশ্লেষণ করে বাজারের স্বচ্ছতা প্রদান করে। আপনি ক্যালোরি ফুটপ্রিন্ট ডায়াগ্রামের গ্রাফটিতে কী দেখছেনঃ
- কে-লাইন মূল্য
- সক্রিয় ক্রয় পরিমাণ (ASK)
- সক্রিয় বিক্রয় পরিমাণ (বিআইডি)
- ভারসাম্য অনুপাত

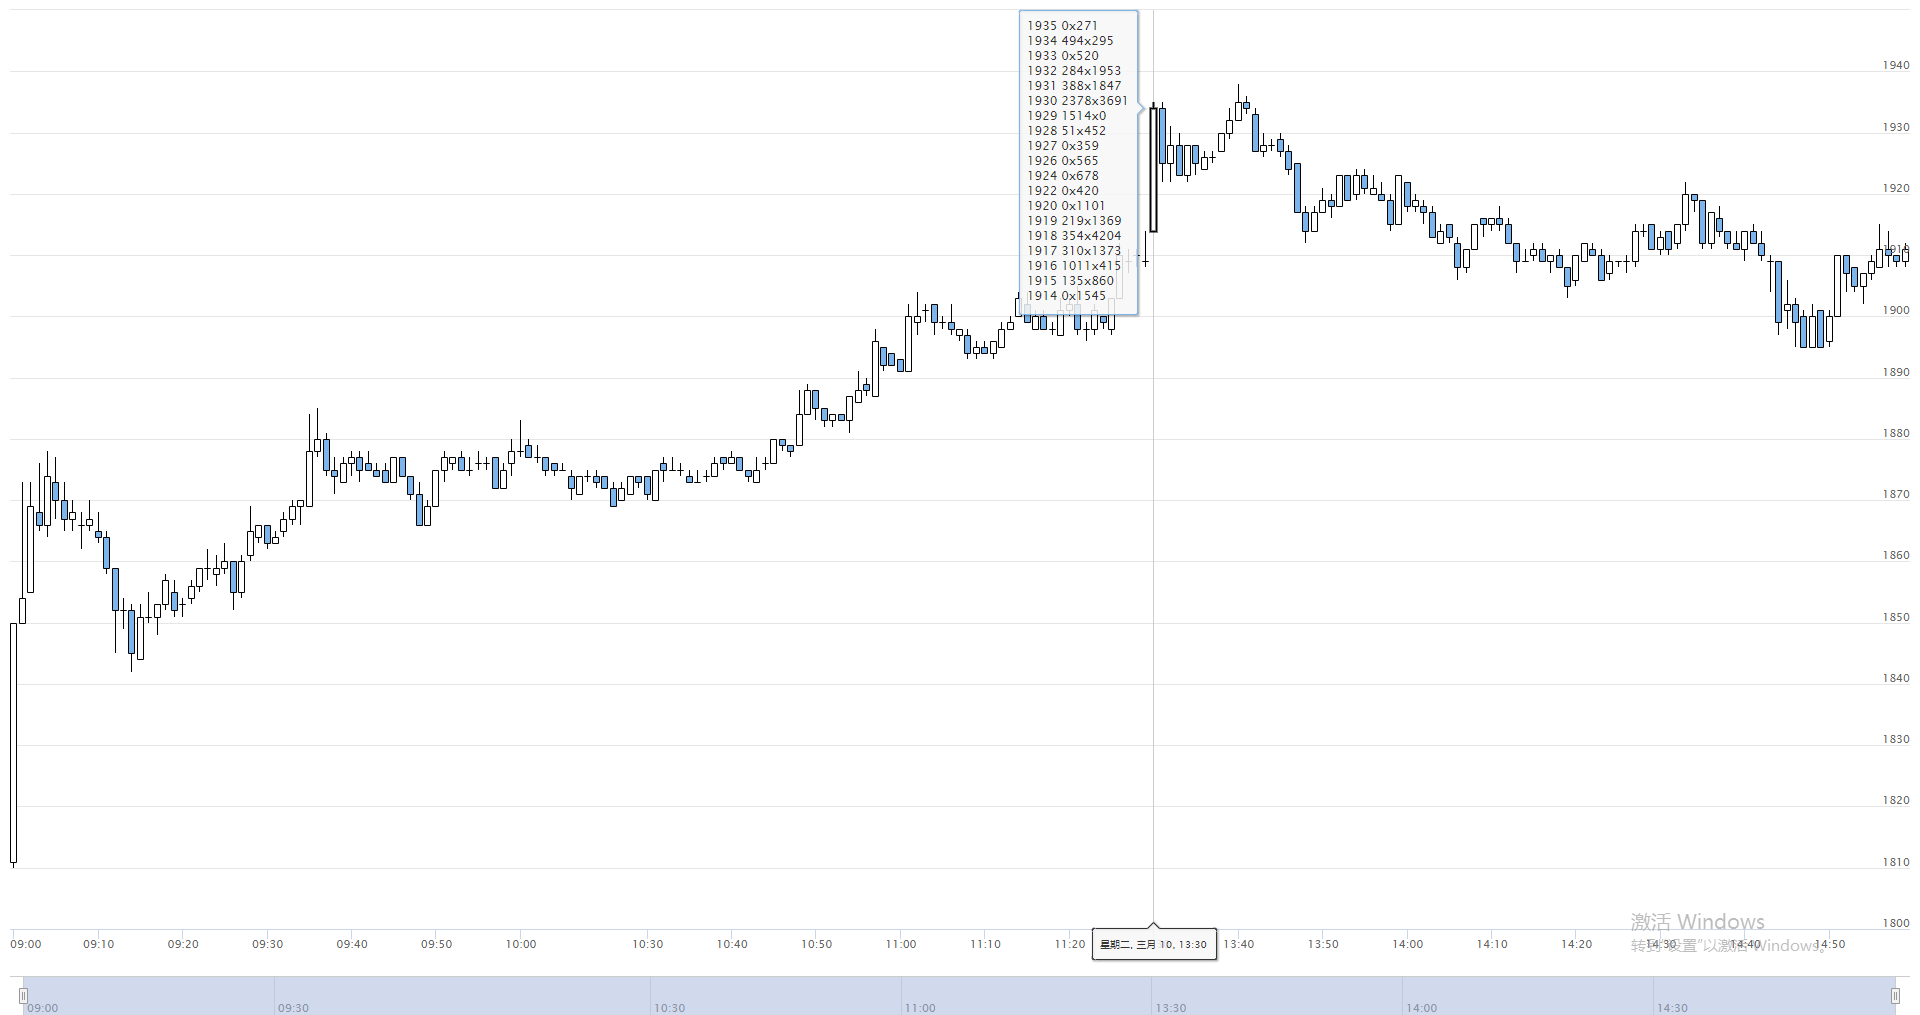
উপরের ছবিতে দেখানো হয়েছে, এটি ট্রেডিং প্ল্যাটফর্মে বাস্তবায়িত পরিমাণগত শক্তি পদচিহ্ন চার্টের একটি প্রদর্শন সংস্করণ।FMZ.COM. এটি প্রকৃতtickবাজার. বিস্তারিত তথ্য K লাইনে সংযুক্ত করা হয়। যখন মাউসটি K লাইনের উপরে থাকে, তখন পরিমাণগত শক্তি পদচিহ্নের ডেটা উপস্থাপন করা যেতে পারে। নীল বর্গক্ষেত্রের ডেটা তার গণনার ফলাফল, যা মোট দুটি কলামে বিভক্ত, এবং বাম কলামটি বর্তমান K লাইনের সমস্ত মূল্য পয়েন্ট, যা বড় থেকে ছোট পর্যন্ত সাজানো হয়। ডান কলামটি প্রতিটি মূল্য স্তরের জন্য ট্রেডিং ভলিউম, ক্রয় ট্রেডিং ভলিউম এবং বিক্রয় ট্রেডিং ভলিউমে বিভক্ত,
কোয়ান্টাম এনার্জি ফুটপ্রিন্টের ভূমিকা
মূল্যবৃদ্ধির কারণ সম্পর্কে চিন্তা করুন? উত্তরটি সহজ... ক্রেতা এবং বিক্রেতা। যদি বিক্রেতাদের চেয়ে ক্রেতা বেশি হয় তবে দাম বাড়বে; যদি ক্রেতাদের চেয়ে বিক্রেতা বেশি হয় তবে দাম হ্রাস পাবে। যদি বিক্রেতাদের বর্তমান সংখ্যা ক্রয়ের দামের সংখ্যার প্রায় সমান হয় তবে বাজারটি একটি অস্থির প্রবণতা প্রদর্শন করবে, অর্থাৎ বাজারটি ভারসাম্যপূর্ণ অবস্থায় রয়েছে। একবার বড় ক্রেতা বা বিক্রেতা উপস্থিত হলে, এই ভারসাম্যটি ভেঙে যাবে, এবং তারপরে শক্তি পদচিহ্ন মানচিত্রটি সক্রিয় ক্রয় এবং বিক্রয়ের একটি চরম অনুপাত প্রদর্শন করবে।
টিক ডেটার উপর ভিত্তি করে শক্তির পদচিহ্নটি গতিশীলভাবে প্রদর্শিত হয়, তাই এটি স্বল্পমেয়াদী ইনট্রাডে ট্রেডিংয়ের জন্য বিশেষভাবে উপযুক্ত। ট্রেডাররা দামের ওঠানামা করার কারণ বা আইনগুলি ব্যাখ্যা করতে এবং তাদের নিজস্ব ট্রেডিং কৌশলগুলি কাস্টমাইজ করার জন্য প্রতিটি দামের সক্রিয় ট্রেডিং ভলিউমটি সঠিকভাবে দেখতে পারে। উদাহরণস্বরূপঃ যদি বামদিকে ক্রয়ের পরিমাণ ডানদিকে বিক্রয় ভলিউমের চেয়ে অনেক বেশি হয় তবে এর অর্থ হ'ল বাজারের অংশগ্রহণকারীরা সক্রিয়ভাবে কিনছেন এবং ভবিষ্যতে দাম বাড়তে পারে; অন্যথায়, যদি ডানদিকে বিক্রয় ভলিউম বামদিকে ক্রয়ের ভলিউমের চেয়ে অনেক বেশি হয় তবে এর অর্থ হ'ল বাজারের অংশগ্রহণকারীদের সক্রিয়ভাবে বিক্রয় করার সাথে সাথে ভবিষ্যতে দামগুলি হ্রাস পেতে পারে।
কোয়ান্টাম এনার্জি ফুটপ্রিন্টের নীতি
কোয়ান্টাম এনার্জি ফুটপ্রিন্টের গণনার নীতিটি ভলিউম এবং বাজারের ডেটা থেকে আসে। বর্তমান ভলিউমটি বাজারের দামের পরিবর্তন অনুসারে রিয়েল টাইমে গণনা করা হয়। যদি বাজারের দাম বৃদ্ধি পায়, তবে ভলিউমটি সক্রিয় ক্রয় হিসাবে রেকর্ড করা হয়; যদি বাজারের দাম কমে যায়, তবে সক্রিয় বিক্রয় হিসাবে ভলিউমটি রেকর্ড করুন। এফএমজেড এনার্জি ফুটপ্রিন্ট গ্রাফটিতে,Tickতথ্যগুলি রিয়েল টাইমে গণনা করা হবে যাতে প্রতিটি কোম্পানির টার্নওভার সঠিকভাবে গণনা করা যায়।Tick.
কোয়ান্টাম এনার্জি ফুটপ্রিন্ট কোড বাস্তবায়ন
/*backtest
start: 2020-03-10 00:00:00
end: 2020-03-10 23:59:00
period: 1h
exchanges: [{"eid":"Futures_CTP","currency":"FUTURES"}]
mode: 1
*/

var NewFuturesTradeFilter = function (period) {
    var self = {} // Create an object
    self.c = Chart({ // Create "Chart" chart
        tooltip: {
            xDateFormat:'%Y-%m-%d %H:%M:%S, %A',
            pointFormat:'{point.tips}'
        },
        series: [{
            name: exchange.GetName(),
            type:'candlestick',
            data: []
        }]
    })
    self.c.reset() // clear chart data
    self.pre = null // used to record the last data
    self.records = []
    self.feed = function (ticker) {
        if (!self.pre) {// If the previous data is not true
            self.pre = ticker // Assign the latest data
        }
        var action ='' // Mark as empty string
        Log('ticker', ticker)
        Log('pre', self.pre)
        if (ticker.Last >= self.pre.Sell) {// If the last price of the latest data is greater than or equal to the selling price of the previous data
            action ='buy' // mark as buy
        } else if (ticker.Last <= self.pre.Buy) {// If the last price of the latest data is less than or equal to the bid price of the previous data
            action ='sell' // mark as sell
        } else {
            if (ticker.Last >= ticker.Sell) {// If the last price of the latest data is greater than or equal to the selling price of the latest data
                action ='buy' // mark as buy
            } else if (ticker.Last <= ticker.Buy) {// If the last price of the latest data is less than or equal to the buying price of the latest data
                action ='sell' // mark as "sell"
            } else {
                action ='both' // Mark as "both"
            }
        }
        // reset volume
        if (ticker.Volume <self.pre.Volume) {// If the volume of the latest data is less than the volume of the previous data
            self.pre.Volume = 0 // Assign the volume of the previous data to 0
        }
        var amount = ticker.Volume-self.pre.Volume // the volume of the latest data minus the volume of the previous data
        if (action !='' && amount> 0) {// If the tag is not an empty string and the action is greater than 0
            var epoch = parseInt(ticker.Time / period) * period // Calculate the K-line timestamp and round it
            var bar = null
            var pos = undefined
            if (
                self.records.length == 0 || // If the K-line length is 0 or the last K-line timestamp is less than "epoch"
                self.records[self.records.length-1].time <epoch
            ) {
                bar = {
                    time: epoch,
                    data: {},
                    open: ticker.Last,
                    high: ticker.Last,
                    low: ticker.Last,
                    close: ticker.Last
                } // Assign the latest data to bar
                self.records.push(bar) // Add bar to the records array
            } else {// reassign bar
                bar = self.records[self.records.length-1] // the last bar of the previous data
                bar.high = Math.max(bar.high, ticker.Last) // the maximum price of the last bar of the previous data and the maximum value of the last price of the latest data
                bar.low = Math.min(bar.low, ticker.Last) // The minimum price of the last bar of the previous data and the minimum value of the last price of the latest data
                bar.close = ticker.Last // last price of latest data
                pos = -1
            }
            if (typeof bar.data[ticker.Last] ==='undefined') {// If the data is empty
                bar.data[ticker.Last] = {// reassign value
                    buy: 0,
                    sell: 0
                }
            }
            if (action =='both') {// If the token is equal to both
                bar.data[ticker.Last]['buy'] += amount // buy accumulation
                bar.data[ticker.Last]['sell'] += amount // sell accumulated
            } else {
                bar.data[ticker.Last][action] += amount // mark accumulation
            }
            var tips =''
            Object.keys(bar.data) // Put the keys in the object into an array
                .sort() // sort
                .reverse() // Reverse the order in the array
                .forEach(function (p) {// traverse the array
                    tips +='<br>' + p + '' + bar.data[p].sell +'x' + bar.data[p].buy
                })
            self.c.add( // Add data
                0, {
                    x: bar.time,
                    open: bar.open,
                    high: bar.high,
                    low: bar.low,
                    close: bar.close,
                    tips: tips
                },
                pos
            )
        }
        self.pre = ticker // reassign
    }
    return self // return object
}


// program entry
function main() {
    Log(_C(exchange.SetContractType,'MA888')) // subscription data
    var filt = NewFuturesTradeFilter(60000) // Create an object
    while (true) {// Enter loop mode
        var ticker = exchange.GetTicker() // Get exchange tick data
        if (ticker) {// If the Tick data is successfully obtained
            filt.feed(ticker) // Start processing data
        }
    }
}
কোয়ান্টাম ফুটপ্রিন্ট কোড ডাউনলোড করুন
কোন্টিটেটিভ কোড ফুটপ্রিন্ট চার্ট কৌশল কোড প্রকাশিত হয়েছেFMZ.comপ্ল্যাটফর্ম, এবং সাধারণ ব্যবহারকারীরা সেটিংস ছাড়াই এটি ব্যবহার করতে পারেন।https://www.fmz.com/strategy/189965
সংক্ষেপে
প্রকৃত ব্যবহারে, শক্তি পদচিহ্ন মানচিত্র ভলিউম দৃষ্টিকোণ থেকে তহবিলের প্রবাহ বিশ্লেষণ করতে পারে। এটি বড় আকারের প্রবণতা বা দিনের স্বল্পমেয়াদী দিক বিশ্লেষণের জন্য হোক না কেন, এটি একটি গুরুত্বপূর্ণ ভূমিকা পালন করে। তবে, এটি লক্ষ করা উচিত যে তথাকথিত মূলধন প্রবাহ এখানে তহবিলের প্রবেশ এবং প্রস্থানকে বোঝায় না, বরং বাজারের ক্রয় এবং বিক্রয় ইচ্ছুকতা এবং প্রধান খেলোয়াড় এবং খুচরা বিনিয়োগকারীদের গেম আচরণকে প্রতিফলিত করে।
- ক্রিপ্টোকারেন্সিতে লিড-লেগ আর্বিট্রেজের ভূমিকা (2)
- ডিজিটাল মুদ্রায় লিড-ল্যাগ স্যুটের ভূমিকা (২)
- এফএমজেড প্ল্যাটফর্মের বাহ্যিক সংকেত গ্রহণ নিয়ে আলোচনাঃ কৌশলগতভাবে অন্তর্নির্মিত এইচটিটিপি পরিষেবা সহ সংকেত গ্রহণের জন্য একটি সম্পূর্ণ সমাধান
- এফএমজেড প্ল্যাটফর্মের বহিরাগত সংকেত গ্রহণের অন্বেষণঃ কৌশলগুলি অন্তর্নির্মিত এইচটিটিপি পরিষেবাগুলির সংকেত গ্রহণের সম্পূর্ণ সমাধান
- ক্রিপ্টোকারেন্সিতে লিড-লেগ আর্বিট্রেজের ভূমিকা (1)
- ডিজিটাল মুদ্রায় লিড-ল্যাগ স্যুটের ভূমিকা
- এফএমজেড প্ল্যাটফর্মের বাহ্যিক সংকেত গ্রহণের বিষয়ে আলোচনাঃ বর্ধিত এপিআই বনাম কৌশল অন্তর্নির্মিত এইচটিটিপি পরিষেবা
- এফএমজেড প্ল্যাটফর্মের বহিরাগত সংকেত গ্রহণের অন্বেষণঃ এক্সটেনশান এপিআই বনাম কৌশল অন্তর্নির্মিত এইচটিটিপি পরিষেবা
- র্যান্ডম টিকার জেনারেটরের উপর ভিত্তি করে কৌশল পরীক্ষার পদ্ধতি নিয়ে আলোচনা
- র্যান্ডম মার্কেট জেনারেটরের উপর ভিত্তি করে কৌশলগত পরীক্ষার পদ্ধতিগুলি অনুসন্ধান করুন
- এফএমজেড কোয়ান্টের নতুন বৈশিষ্ট্যঃ সহজেই এইচটিটিপি সার্ভিস তৈরি করতে _সার্ভ ফাংশন ব্যবহার করুন
- গ্রাফিক্যাল মার্টিঙ্গেল ট্রেডিং কৌশল
- পাইথন সংস্করণ আইসবার্গ কমিশন কৌশল
- ক্রিপ্টোকারেন্সি ফিউচার ট্রেডিং এর যুক্তি
- নীচের আকৃতি ZDZB কৌশল
- মাল্টি-রোবট মার্কেট শেয়ারিং সমাধান
- ARMA-EGARCH মডেলের উপর ভিত্তি করে বিটকয়েন অস্থিরতা মডেলিং এবং বিশ্লেষণ
- জাভাস্ক্রিপ্ট কৌশল নকশায় সংখ্যাসূচক গণনার নির্ভুলতার সমস্যার সমাধান
- একটি স্থানীয় ফাইল মধ্যে পাইথন কৌশল encapsulate আপনি শেখান
- এফএমইএক্স ট্রেডিং সর্বোত্তম অর্ডার ভলিউম অপ্টিমাইজেশান অংশ 2 আনলক করে
- এফএমইএক্স ট্রেডিং সর্বোত্তম অর্ডার ভলিউম অপ্টিমাইজেশান আনলক করে
- FMEX শ্রেণীবিভাগ আনলক সর্বোত্তম নিচে একক পরিমাণ অপ্টিমাইজেশন
- বটকে বার্তা পাঠানোর জন্য পিল-পিল ইন্টারফেস কল করুন
- এফএমইএক্স লেনদেনের জন্য সর্বোত্তম পরিমাণের জন্য সর্বোত্তম
- সহজ ভোল্টেবিলিটি ইএমভি কৌশল
- একটি পাইথন নীতিমালা প্যাকেজিংয়ের জন্য একটি ব্যয়বহুল ফাইল শেখান
- বিচ্যুতি হার বিআইএএস ট্রেডিং কৌশল
- "পাইফোলিও" টুল ব্যবহার করে ব্যাকটেস্ট মূলধন কার্ভের মূল্যায়ন
- FMZ কোয়ালিফাইড মাই ভাষা - ইন্টারফেস গ্রাফ
- Commodity Futures Intertemporal Bollinger Hedge Strategy এর পাইথন সংস্করণ (শুধুমাত্র গবেষণার উদ্দেশ্যে)
- "ট্রেডিংভিউ" সূচক ব্যবহার করে FMZ রোবটের সাথে ইন্টারফেস