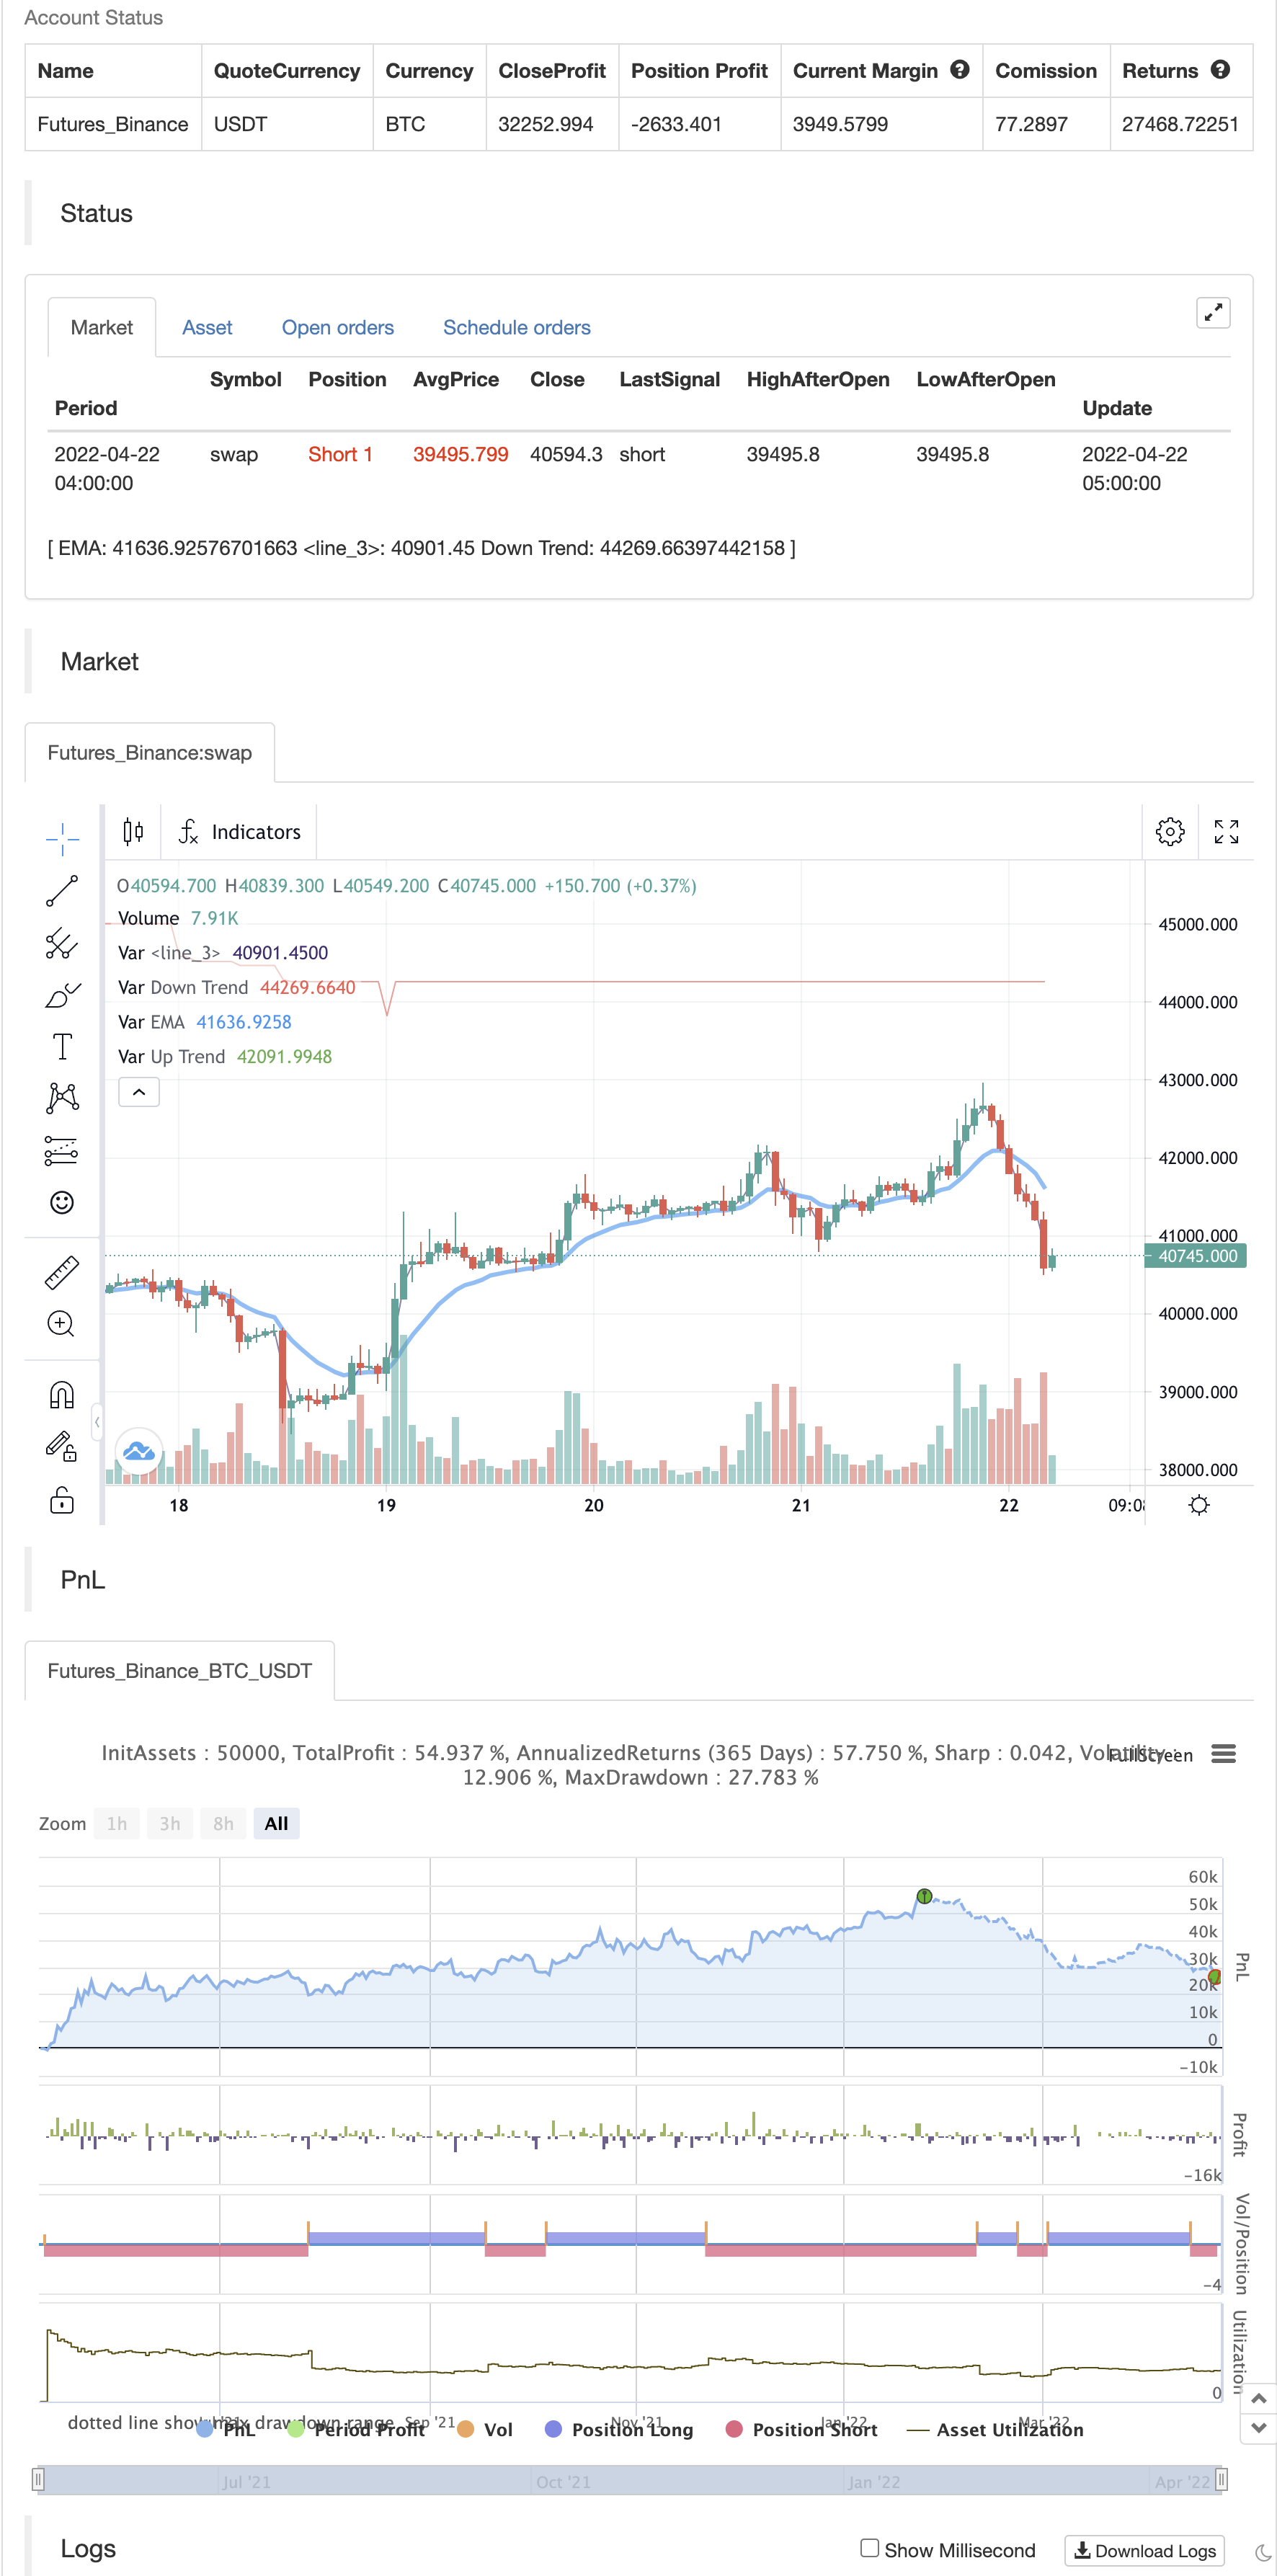
মুভিং এভারেজ কালারড ইএমএ/এসএমএ
লেখক:চাওঝাং, তারিখঃ ২০২২-০৫-১১ ২১ঃ০৩ঃ০৭ট্যাগঃইএমএ
অ্যামাজন প্রাইম ভিডিও বান্দিশ ব্যাণ্ডিস থেকে গারাজ গারাজ জুগালবন্দী ভিডিও গান উপস্থাপন করেছে। রিতবিক ভৌমিক এবং অতুল কুলকর্নি দ্বারা গঠিত একটি লোকগীত, ফরিদ হাসান এবং মোহাম্মদ আমান দ্বারা গাওয়া, শঙ্কর অহসান লয় পরিচালিত সংগীত এবং সমীর সামন্তের গীত। সিজন ফাইনালে রাধে এবং দিগ্বিজয় তাদের সাধারণ শিক্ষক পণ্ডিতজির প্রতি শ্রদ্ধা হিসাবে এই গানটি পুনরাবৃত্তি করেন।
ব্যাকটেস্ট

/*backtest
start: 2021-05-10 00:00:00
end: 2022-04-22 05:20:00
period: 1h
basePeriod: 15m
exchanges: [{"eid":"Futures_Binance","currency":"BTC_USDT"}]
*/

// This source code is subject to the terms of the Mozilla Public License 2.0 at https://mozilla.org/MPL/2.0/
// © subhajitbhattacharya


//@version=5
indicator('Moving Average Colored EMA/SMA', overlay=true, precision=2)
gr1 = "Moving Average Colored EMA/SMA"
emaplot = input(true, title='Show EMA on chart',group=gr1)
len = input.int(13, minval=1, title='Ema Length',group=gr1)
src = close
out = ta.ema(src, len)
up = out > out[1]
down = out < out[1]
mycolor = up ? color.green : down ? color.red : color.blue
plot(out and emaplot ? out : na, title='EMA', color=mycolor, linewidth=3)


smaplot = input(false, title='Show SMA on chart',group=gr1)
len2 = input.int(23, minval=1, title='Sma Length',group=gr1)
src2 = close
out2 = ta.sma(src2, len2)
up2 = out2 > out2[1]
down2 = out2 < out2[1]
mycolor2 = up2 ? color.green : down2 ? color.red : color.blue
plot(out2 and smaplot ? out2 : na, title='SMA', color=mycolor2, linewidth=1)


//===================== Holders Sentiment ==================================================

gr2 = 'Holders Sentiment'
length = input.int(50,group=gr2)
src3 = input(close, title='Source',group=gr2)

zeroline = 0
// hzplot = plot(zeroline, color=color.new(color.black, 0))
difabs = (src3[0] - src3[length]) / src3[length] * 100
plotColour = difabs > 0 ? color.green : color.red
// changeplot = plot(difabs, color=plotColour, linewidth=2)
// fill(plot1=changeplot, plot2=hzplot, color=color.new(color.blue, 90))

//================ Supertrend ================================================

gr3 = "Supertrend"
tf = input.timeframe('D', "Resolution",group=gr3)
atrPeriod = input(10, "ATR Length",group=gr3)
factor = input.float(3.0, "Factor", step = 0.01,group=gr3)

[supertrend, direction] = request.security(syminfo.tickerid, tf, ta.supertrend(factor, atrPeriod), barmerge.gaps_off, barmerge.lookahead_off)

bodyMiddle = plot((open + close) / 2, display=display.none)
upTrend = plot(direction < 0 ? supertrend : na, "Up Trend", color = color.green, style=plot.style_linebr)
downTrend = plot(direction < 0? na : supertrend, "Down Trend", color = color.red, style=plot.style_linebr)

//fill(bodyMiddle, upTrend, color.new(color.green, 90), fillgaps=false)
//fill(bodyMiddle, downTrend, color.new(color.red, 90), fillgaps=false)

//=================================================================================

bs1 = ta.crossover(out,out2) ? 1 : ta.crossunder(out,out2) ? -1 : 0
bs2 = difabs > 0 ? 1 : -1
bs3 = direction < 0 ? 1 : -1
bs = 0
bs := bs1 == 1 and bs2 == 1 and bs3 == 1 ? 1 : bs1 == -1 and bs2 == -1 and bs3 == -1 ? -1 : 0

buy = bs == 1 and nz(bs[1]) !=1
sell = bs == -1 and nz(bs[1]) != -1

//bgcolor(buy ? color.new(#00ff00, 50) : na)
//if buy
//    label.new(bar_index, low, yloc = yloc.belowbar, text="Buy", textcolor = #00ff00, size = size.large, style=label.style_none)
//
//bgcolor(sell ? color.new(#b92ad8, 80) : na)
//if sell
//    label.new(bar_index,high, yloc = yloc.abovebar, text="Sell", textcolor = #b92ad8, size = size.large, style=label.style_none)


alertcondition(buy, title='Buy Alert', message='Buy')
alertcondition(sell, title='sell Alert', message='Sell')


if buy
    strategy.entry("Enter Long", strategy.long)
else if sell
    strategy.entry("Enter Short", strategy.short)
সম্পর্কিত বিষয়বস্তু
- মাল্টি-ডাইমেনশনাল ট্রেন্ড ডিসিশন এবং এটিআর ডায়নামিক স্টপ-ডাউন কৌশল
- উচ্চতর মাল্টি-পয়েন্টার ট্রেন্ড ট্রেডিং কৌশল নিশ্চিত
- স্বনির্ধারিত ট্রেন্ড ট্র্যাকিং এবং একাধিক নিশ্চিতকরণ লেনদেন কৌশল
- ডায়নামিক ওয়াইনারি সিস্টেমের সাথে RSI গতির সূচকগুলির সাথে দিনের ব্যবসায়ের অপ্টিমাইজেশন কৌশল
- একাধিক প্রযুক্তিগত সূচক ক্রস গতিশীলতা প্রবণতা ট্র্যাকিং কৌশল
- ইএমএ ট্রেন্ডের সাথে রুটিন রিপয়েন্ট ট্রেডিং কৌশলকে ভেঙে দেয়
- মাল্টি-ইউনিট্রি ক্রস-সাহায্যকারী আরএসআই ডায়নামিক প্যারামিটার পরিমাণগত ট্রেডিং কৌশল
- গতিশীল প্রবণতা RSI ক্রস কৌশল নির্ধারণ করে
- ডাবল ক্রস ট্রেন্ড ট্র্যাকিং কৌশলঃ সূচক সমান্তরাল এবং MACD সমন্বিত ট্রেডিং সিস্টেম
- মাল্টি-পরিমাপক মাল্টি-মাত্রিক প্রবণতা ক্রস উচ্চতর পরিমাণগত কৌশল
- মাল্টি স্লাইড মিডলাইন ডায়নামিক ক্রস ট্রেন্ড ট্র্যাকিং এবং মাল্টি কনফার্মেশন কোয়ালিফাইড ট্রেডিং কৌশল
আরও দেখুন
- চাঁদ উৎক্ষেপণ সতর্কতা টেমপ্লেট [সূচক]
- HALFTREND + HEMA + SMA (মিথ্যা সংকেতের কৌশল)
- আরএসআই পিভট, বিবি, এসএমএ, ইএমএ, এসএমএমএ, ডব্লিউএমএ, ভিডব্লিউএমএ এর সাথে বিপরীত
- আরএসআই এবং বিবি এবং একই সাথে ওভারসোল্ড
- রোলিং হেকিন আশি মোমবাতি
- কম্বো 2/20 ইএমএ এবং ব্যান্ডপাস ফিল্টার
- ইএসএসএমএ
- 3EMA
- পিভট অর্ডার ব্লক
- এনএমভিওবি-এস
- এমএএইচএল ব্যান্ড
- এই একক স্ক্রিপ্টে 3 সুপারট্রেন্ড যুক্ত করুন
- এমএসিডি এবং ইএমএ নিশ্চিতকরণের সাথে সুইং হাই/নিম্ন সূচক
- ট্রিপল ইএমএ + এমএসিডি
- ক্রস খেলছে
- ক্ষুদ্রতর ফ্রেক্টাল (+ স্বচ্ছতা)
- BB-RSI-ADX এন্ট্রি পয়েন্ট
- হুল-৪এমা
- কোণ আক্রমণ লাইন অনুসরণ সূচক
- ক্রস সহ কিজুনসেন লাইন