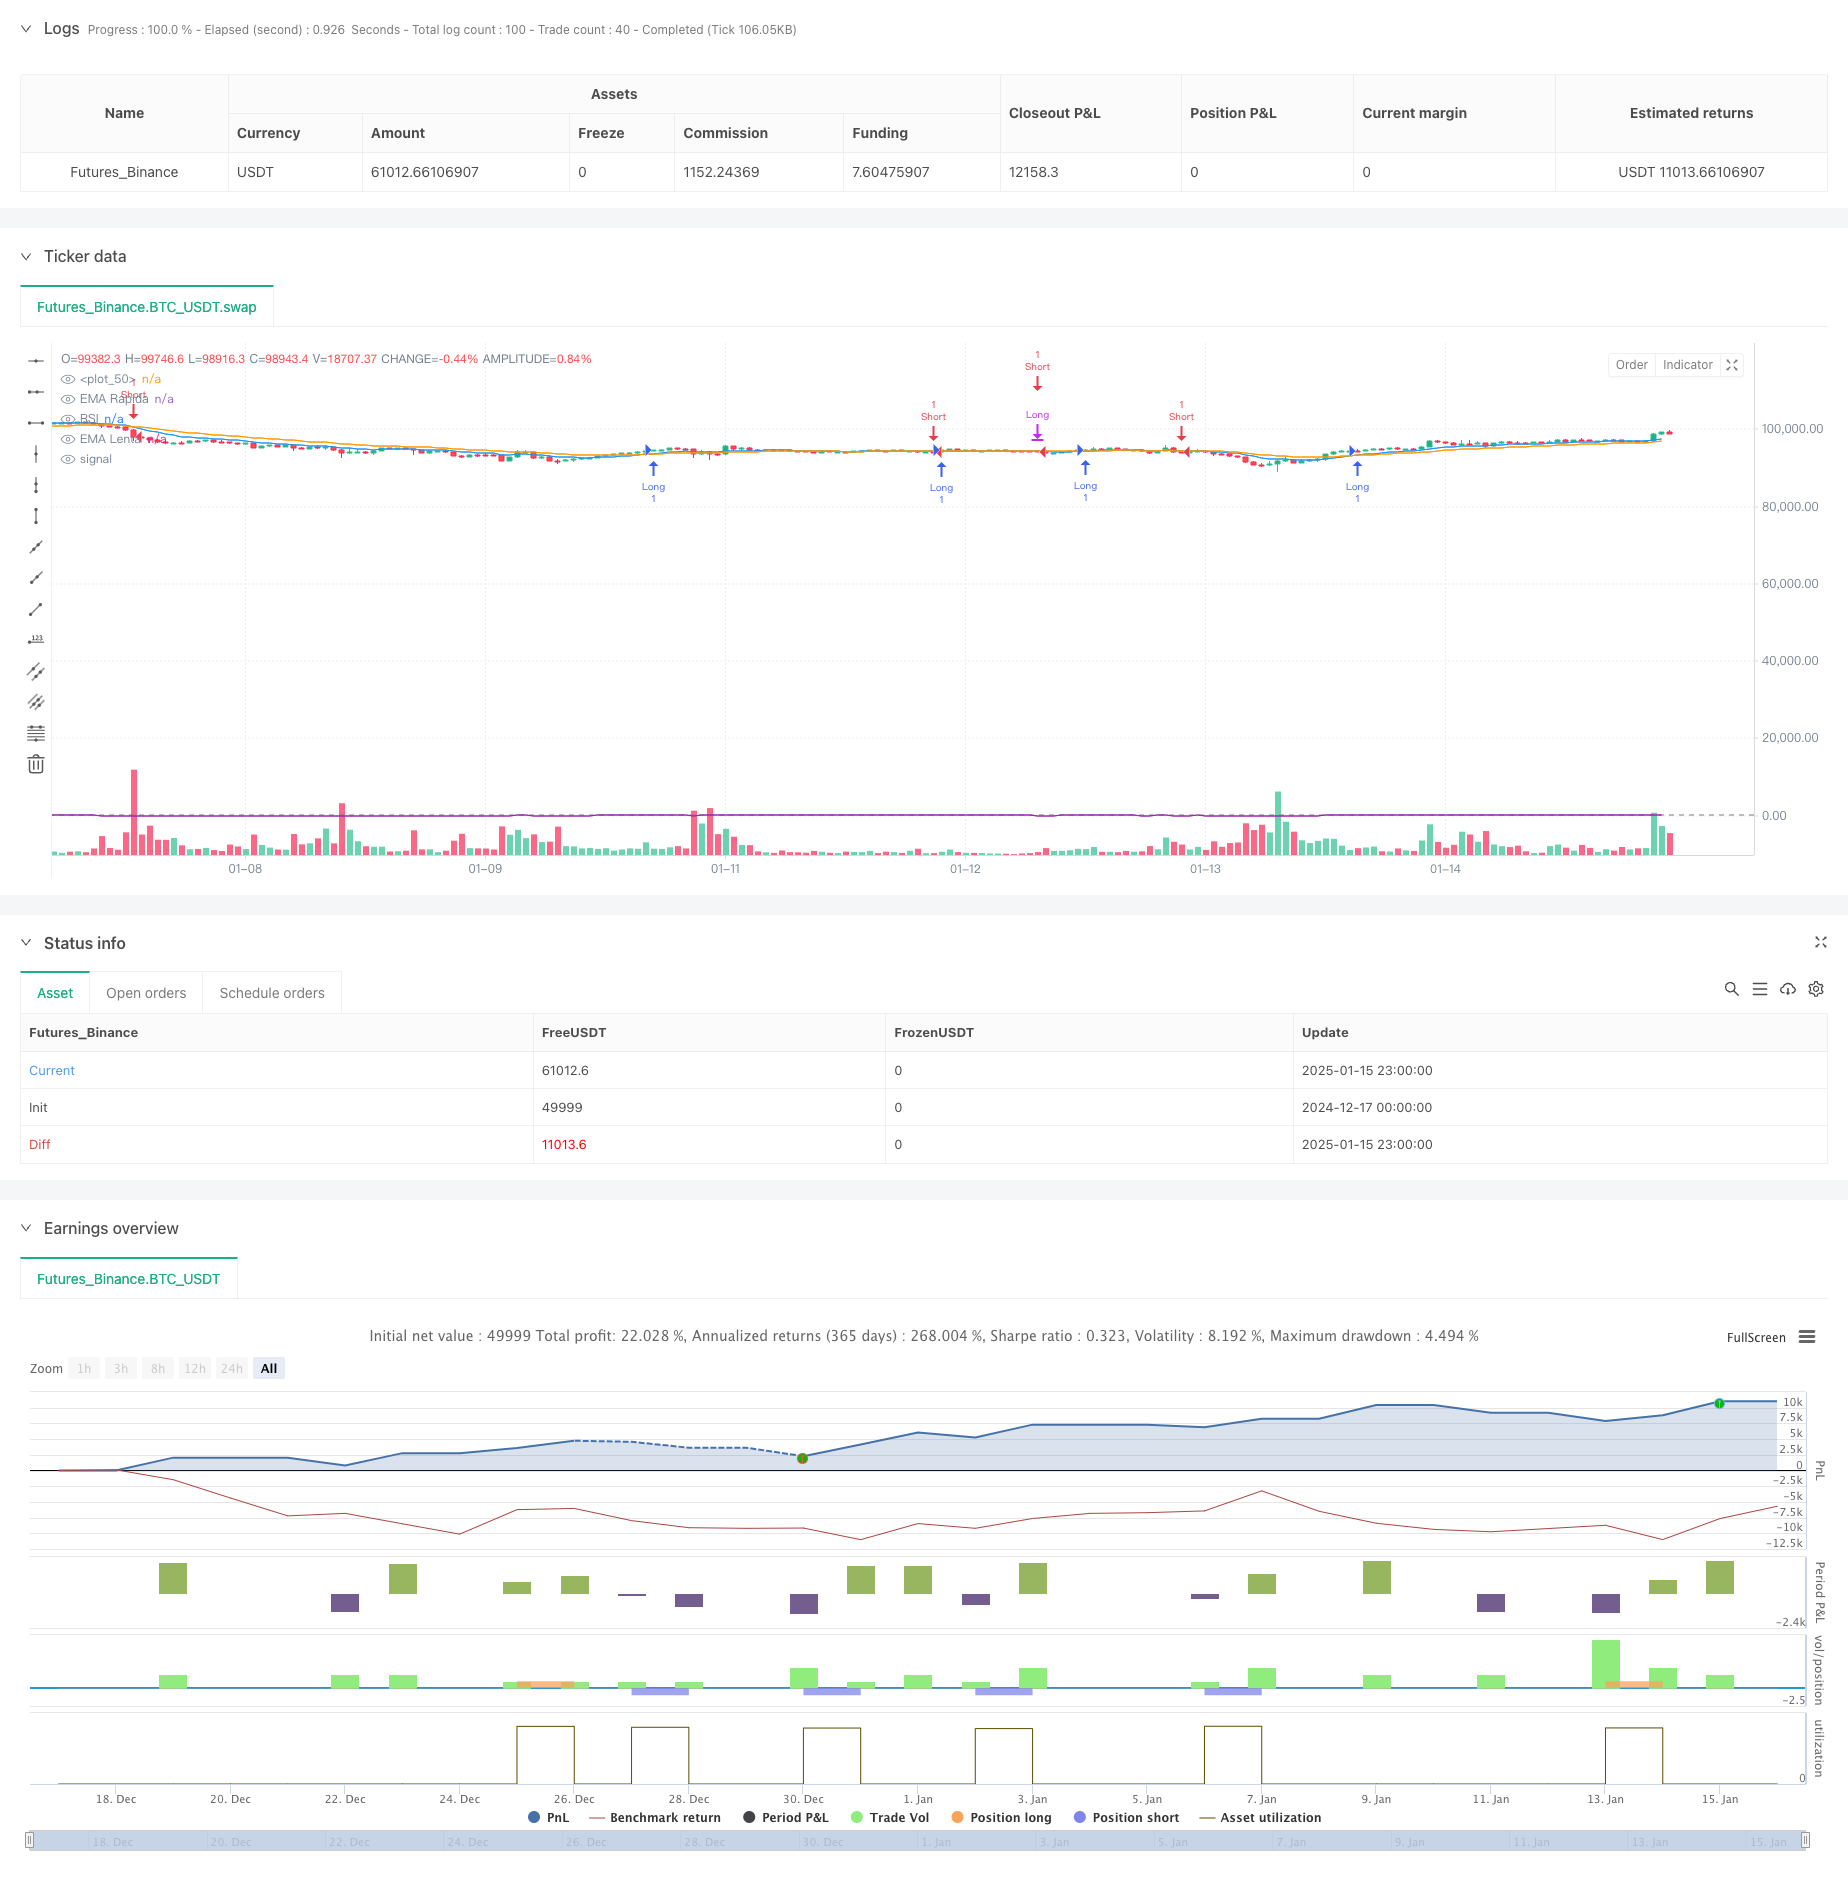
概述
这是一个基于双均线系统(EMA)和相对强弱指标(RSI)的日内交易策略。该策略通过快速和慢速指数移动平均线的交叉信号,结合RSI动量指标来识别市场趋势和交易机会,同时集成了止损和止盈机制以实现风险管理。策略采用资金管理模式,使用账户权益的固定百分比进行交易。
策略原理
策略的核心逻辑包括以下几个关键要素: 1. 使用两条不同周期(默认12和26)的指数移动平均线(EMA)作为趋势判断指标 2. 引入RSI指标(默认14周期)作为动量确认指标 3. 多头入场条件:快速EMA上穿慢速EMA且RSI大于50 4. 空头入场条件:快速EMA下穿慢速EMA且RSI小于50 5. 采用账户权益20%的固定比例进行仓位管理 6. 集成了可调节的止损(默认1%)和止盈(默认2%)机制 7. 在反向交叉信号出现时执行平仓操作
策略优势
- 系统化的交易逻辑,减少主观判断带来的情绪干扰
- 结合趋势和动量双重确认,提高交易信号的可靠性
- 完善的风险管理机制,包括固定比例仓位控制和止损止盈设置
- 策略参数可优化,适应不同市场环境
- 可应用于多个时间周期,具有良好的适应性
- 清晰的入场和出场机制,易于执行和回测
策略风险
- 震荡市场可能产生频繁的假突破信号
- EMA指标具有滞后性,可能错过重要转折点
- 固定的止损止盈设置可能不适合所有市场环境
- RSI指标在强势趋势中可能产生过早的反转信号
- 需要持续监控和调整参数以适应市场变化
策略优化方向
- 引入波动率指标(如ATR)来动态调整止损和止盈水平
- 添加成交量指标作为交易信号的额外确认
- 开发自适应的参数调整机制,提高策略的适应性
- 增加时间过滤器,避免在不利的交易时段操作
- 考虑添加趋势强度过滤器,提高交易质量
- 优化资金管理算法,实现更灵活的仓位控制
总结
该策略通过结合EMA趋势系统和RSI动量指标,构建了一个完整的交易系统。其优势在于系统化的交易逻辑和完善的风险管理机制,但仍需注意市场环境对策略表现的影响。通过持续优化和调整,策略可以更好地适应不同的市场条件,提高交易效果。
策略源码
/*backtest
start: 2024-12-17 00:00:00
end: 2025-01-16 00:00:00
period: 1h
basePeriod: 1h
exchanges: [{"eid":"Futures_Binance","currency":"BTC_USDT","balance":49999}]
*/

//@version=5
strategy("Estrategia Intradía - Cruce EMA + RSI - Optimizado", overlay=true, pyramiding=0, default_qty_type=strategy.percent_of_equity, default_qty_value=20)

// Parámetros CON rangos de optimización
ema_fast_length = input.int(title="Período EMA Rápida", defval=12, minval=5, maxval=30, step=1)
ema_slow_length = input.int(title="Período EMA Lenta", defval=26, minval=15, maxval=50, step=1)
rsi_length = input.int(title="Período RSI", defval=14, minval=7, maxval=21, step=1)
rsi_overbought = input.int(title="Nivel de Sobrecompra RSI", defval=70, minval=60, maxval=80, step=1)
rsi_oversold = input.int(title="Nivel de Sobreventa RSI", defval=30, minval=20, maxval=40, step=1)
stop_loss_percent = input.float(title="Stop Loss (%)", defval=1.0, minval=0.1, maxval=3.0, step=0.1)
take_profit_percent = input.float(title="Take Profit (%)", defval=2.0, minval=0.5, maxval=5.0, step=0.1)

// Cálculos
ema_fast = ta.ema(close, ema_fast_length)
ema_slow = ta.ema(close, ema_slow_length)
rsi = ta.rsi(close, rsi_length)

// Condiciones de entrada
longCondition = ta.crossover(ema_fast, ema_slow) and rsi > 50
shortCondition = ta.crossunder(ema_fast, ema_slow) and rsi < 50

// Gestión de entradas y salidas
var float longQty = na
var float shortQty = na

if longCondition
    longQty := 20 / close
    strategy.entry("Long", strategy.long, qty=longQty)
    if stop_loss_percent > 0 and take_profit_percent > 0
        strategy.exit("Exit Long", "Long", stop=close * (1 - stop_loss_percent / 100), limit=close * (1 + take_profit_percent / 100))

if strategy.position_size > 0 and ta.crossunder(ema_fast, ema_slow)
    strategy.close("Long")
    longQty := na

if shortCondition
    shortQty := 20 / close
    strategy.entry("Short", strategy.short, qty=shortQty)
    if stop_loss_percent > 0 and take_profit_percent > 0
        strategy.exit("Exit Short", "Short", stop=close * (1 + stop_loss_percent / 100), limit=close * (1 - take_profit_percent / 100))

if strategy.position_size < 0 and ta.crossover(ema_fast, ema_slow)
    strategy.close("Short")
    shortQty := na

// Visualizaciones
plot(ema_fast, color=color.blue, title="EMA Rápida")
plot(ema_slow, color=color.orange, title="EMA Lenta")
plot(rsi, color=color.purple, title="RSI")
hline(50, color=color.gray)
相关推荐