ইএমএ ট্রেন্ড ক্লাউড
লেখক:চাওঝাং, তারিখ: ২০২২-০৫-১৮ ১৫ঃ৩২ঃ৫১ট্যাগঃইএমএ
***এটি ট্রেডিং পরামর্শ নয় - কোন গ্যারান্টি নেই - আপনার নিজের ঝুঁকিতে ব্যবহার করুন***
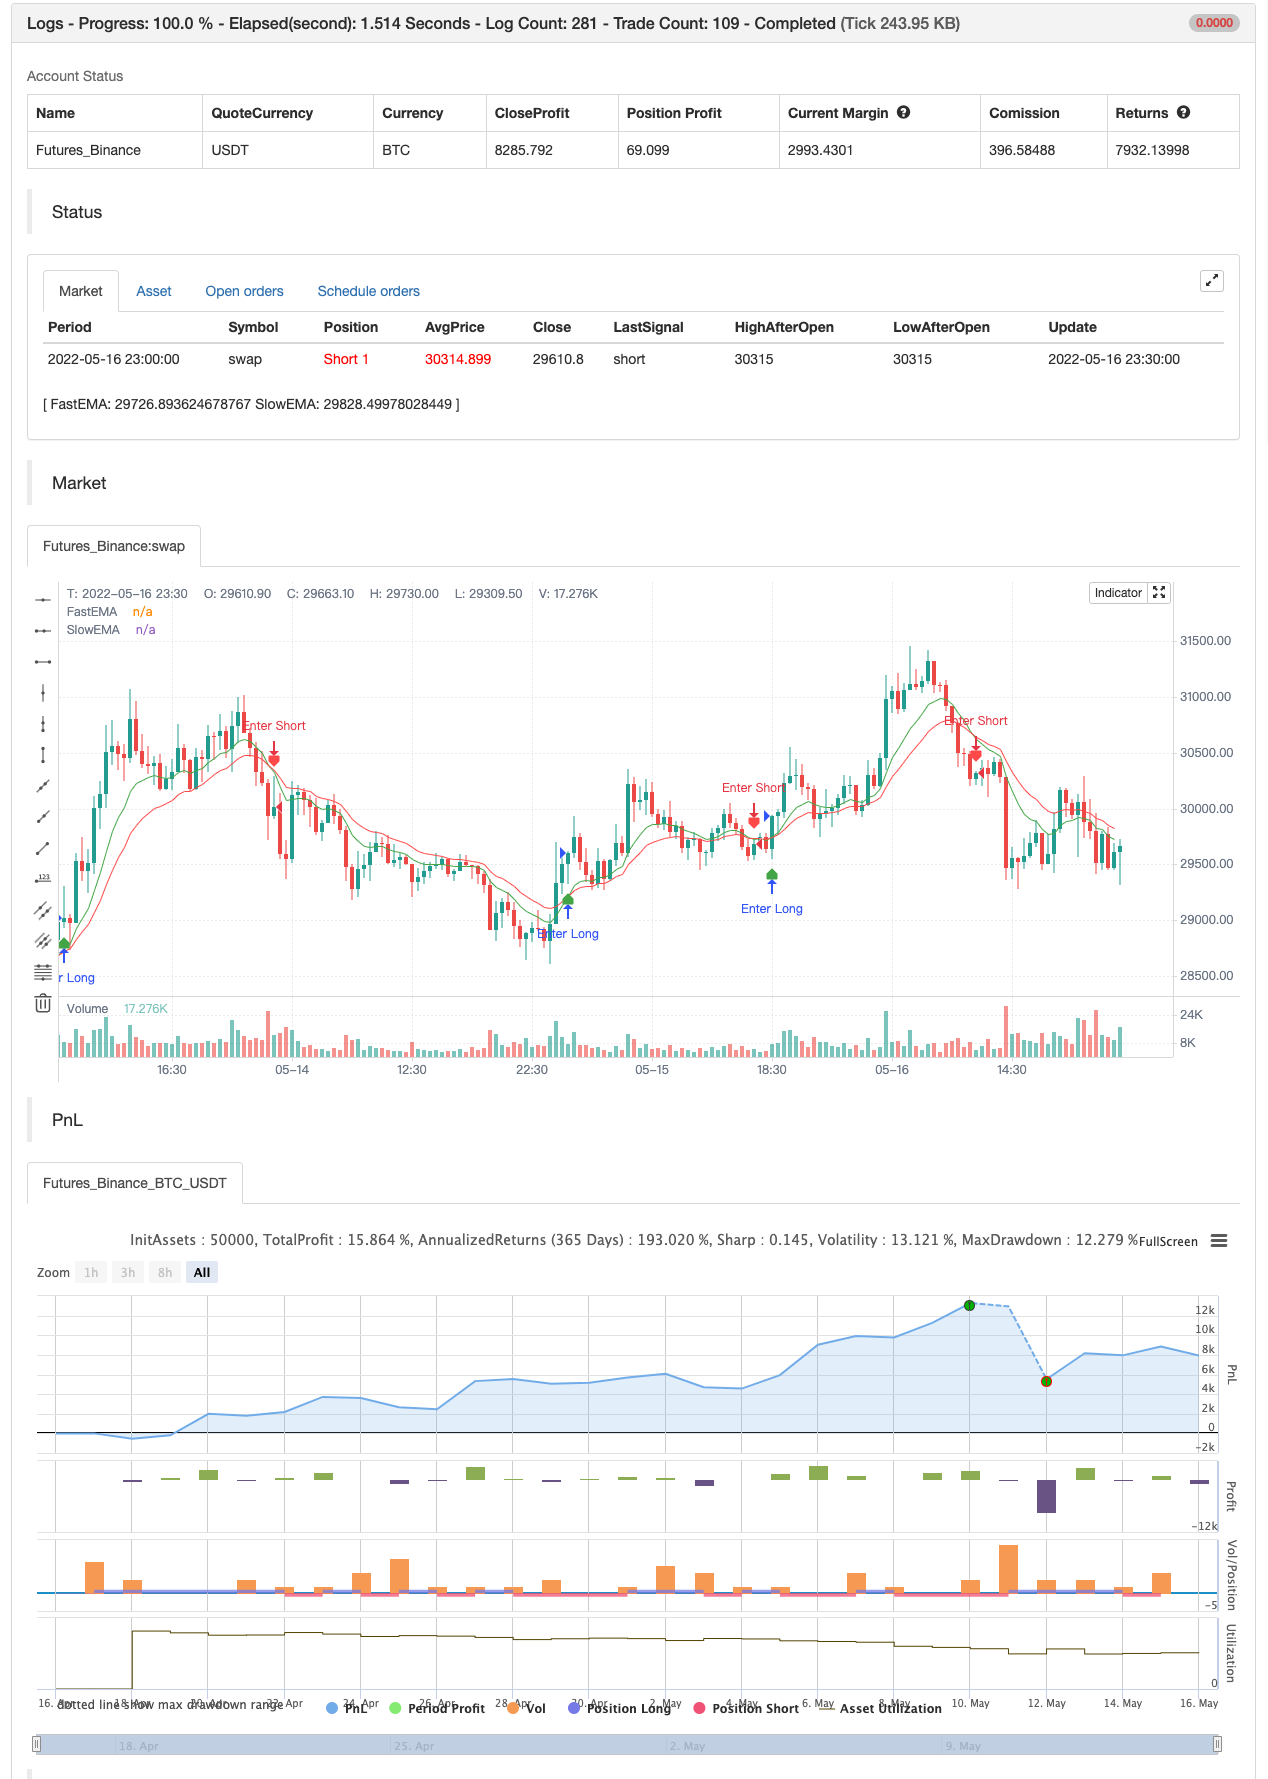
9 এবং 20 সময়ের এক্সপোনেন্সিয়াল মুভিং এভারেজ (ইএমএ) প্লট করে এবং এর মধ্যে একটি মেঘ আঁকে, ভিজ্যুয়ালি ইনট্রাডে ট্রেন্ড এবং এর শক্তি সনাক্ত করে। দীর্ঘ জন্য সবুজ মেঘ, সংক্ষিপ্ত জন্য লাল মেঘ। মেঘটি যত ঘন হবে প্রবণতা তত শক্তিশালী। লং প্লে এন্ট্রি হয় যখন 9 ইএমএ 20 ইএমএর উপরে অতিক্রম করে যার ফলে মেঘটি সবুজ হয়ে যায়, সংক্ষিপ্ত জন্য বিপরীত।
আক্রমণাত্মক এন্ট্রি হল ক্রস ঘটানোর জন্য বার বন্ধ করা। সংরক্ষণশীল এন্ট্রি হল যখন ক্রসের পরে দ্বিতীয় বারটি 9 EMA এর উপরে বন্ধ হয় এবং খেলার দিকের দিকে থাকে।
যখন মূল্য ক্লাউডে বা ক্লাউডের বিপরীত দিকে বন্ধ হয় বা যখন ব্যবসায়ের বিপরীত দিকে গড়গুলি ক্রস হয় তখন ব্যক্তির ঝুঁকি সহনশীলতার উপর নির্ভর করে প্রস্থানগুলি ঘটতে পারে।
***এটি ট্রেডিং পরামর্শ নয় - কোন গ্যারান্টি নেই - আপনার নিজের ঝুঁকিতে ব্যবহার করুন***
ব্যাকটেস্ট

/*backtest
start: 2022-04-17 00:00:00
end: 2022-05-16 23:59:00
period: 30m
basePeriod: 15m
exchanges: [{"eid":"Futures_Binance","currency":"BTC_USDT"}]
args: [["v_input_1",10],["v_input_2",18]]
*/

// This source code is subject to the terms of the Mozilla Public License 2.0 at https://mozilla.org/MPL/2.0/
// © Ron Westbrook (discord: disturbinglymellow#4075)
// Date: 5/17/2021
// Description: Plots two exponential moving averages and places a colored cloud between to indicate trend direction. Default values of 9 and 20 periods have worked well for me, but inputs are available if you choose to change them. If you like my work and want to support more of it please consider leaving me a tip here. https://tinyurl.com/tipron


//@version=5
indicator(title='EMA TREND CLOUD', overlay=true)

fastLen = input(title='Fast EMA Length', defval=9)
slowLen = input(title='Slow EMA Length', defval=20)
useTextLabels = input.bool(true, title='Use Text-Based Crossover Labels?', group='Crossover Moving Averages')

fastEMA = ta.ema(close, fastLen)
slowEMA = ta.ema(close, slowLen)

fema = plot(fastEMA, title='FastEMA', color=color.new(color.green, 0), linewidth=1, style=plot.style_line)
sema = plot(slowEMA, title='SlowEMA', color=color.new(color.red, 0), linewidth=1, style=plot.style_line)

fill(fema, sema, color=fastEMA > slowEMA ? color.new(#417505, 50) : color.new(#890101, 50), title='Cloud')

// Bull and Bear Alerts
Bull = ta.crossover(fastEMA, slowEMA)
Bear = ta.crossunder(fastEMA, slowEMA)

plotshape(Bull, title='Calls Label', color=color.new(color.green, 25), textcolor=useTextLabels ? color.white : color.new(color.white, 100), style=useTextLabels ? shape.labelup : shape.triangleup, text='Calls', location=location.belowbar)

plotshape(Bear, title='Puts Label', color=color.new(color.red, 25), textcolor=useTextLabels ? color.white : color.new(color.white, 100), style=useTextLabels ? shape.labeldown : shape.triangledown, text='Puts', location=location.abovebar)


if Bull
    alert('Calls Alert: 9ema crossed over 20ema', alert.freq_once_per_bar_close)
if Bear
    alert('Puts Alert: 9ema crossed under 20ema', alert.freq_once_per_bar_close)


if Bull
    strategy.entry("Enter Long", strategy.long)
else if Bear
    strategy.entry("Enter Short", strategy.short)
- মাল্টি-ডাইমেনশনাল ট্রেন্ড ডিসিশন এবং এটিআর ডায়নামিক স্টপ-ডাউন কৌশল
- উচ্চতর মাল্টি-পয়েন্টার ট্রেন্ড ট্রেডিং কৌশল নিশ্চিত
- স্বনির্ধারিত ট্রেন্ড ট্র্যাকিং এবং একাধিক নিশ্চিতকরণ লেনদেন কৌশল
- ডায়নামিক ওয়াইনারি সিস্টেমের সাথে RSI গতির সূচকগুলির সাথে দিনের ব্যবসায়ের অপ্টিমাইজেশন কৌশল
- একাধিক প্রযুক্তিগত সূচক ক্রস গতিশীলতা প্রবণতা ট্র্যাকিং কৌশল
- ইএমএ ট্রেন্ডের সাথে রুটিন রিপয়েন্ট ট্রেডিং কৌশলকে ভেঙে দেয়
- মাল্টি-ইউনিট্রি ক্রস-সাহায্যকারী আরএসআই ডায়নামিক প্যারামিটার পরিমাণগত ট্রেডিং কৌশল
- গতিশীল প্রবণতা RSI ক্রস কৌশল নির্ধারণ করে
- ডাবল ক্রস ট্রেন্ড ট্র্যাকিং কৌশলঃ সূচক সমান্তরাল এবং MACD সমন্বিত ট্রেডিং সিস্টেম
- মাল্টি-পরিমাপক মাল্টি-মাত্রিক প্রবণতা ক্রস উচ্চতর পরিমাণগত কৌশল
- মাল্টি স্লাইড মিডলাইন ডায়নামিক ক্রস ট্রেন্ড ট্র্যাকিং এবং মাল্টি কনফার্মেশন কোয়ালিফাইড ট্রেডিং কৌশল
- এটিআর সমতল
- অর্ডার ব্লক ফাইন্ডার
- TrendScalp-FractalBox-3EMA
- QQE সংকেত
- U বিট গ্রিডের মাত্রা ফিল্টার
- সিএম এমএসিডি কাস্টম ইন্ডিকেটর - মাল্টিপল টাইম ফ্রেম - ভি২
- হডল লাইন
- 2 চলমান গড় রঙের দিক সনাক্তকরণ
- Scalping PullBack টুল R1
- ক্রয় ও বিক্রয় কৌশল AO+Stoch+RSI+ATR এর উপর নির্ভর করে
- রেড কে ভলিউম-এক্সিলারেটেড দিকনির্দেশক শক্তির অনুপাত
- ডোনচিয়ান ব্রেকআউট কোন পুনরায় পেইন্ট
- রেড কে মোমেন্টাম বার
- সুপারজাম্প টার্ন ব্যাক বোলিঞ্জার ব্যান্ড
- ফুকুইজ ট্রেন্ড
- জনির বট
- এসএসএল হাইব্রিড
- চ্যান্ডেলিয়ারের প্রস্থান
- রিসোটো
- ইএমএ ক্লাউড ইনট্রা-ডে স্ট্র্যাটেজি
বিউসিয়াওকওগো, আমি ইংরেজি বুঝতে পারছি না।