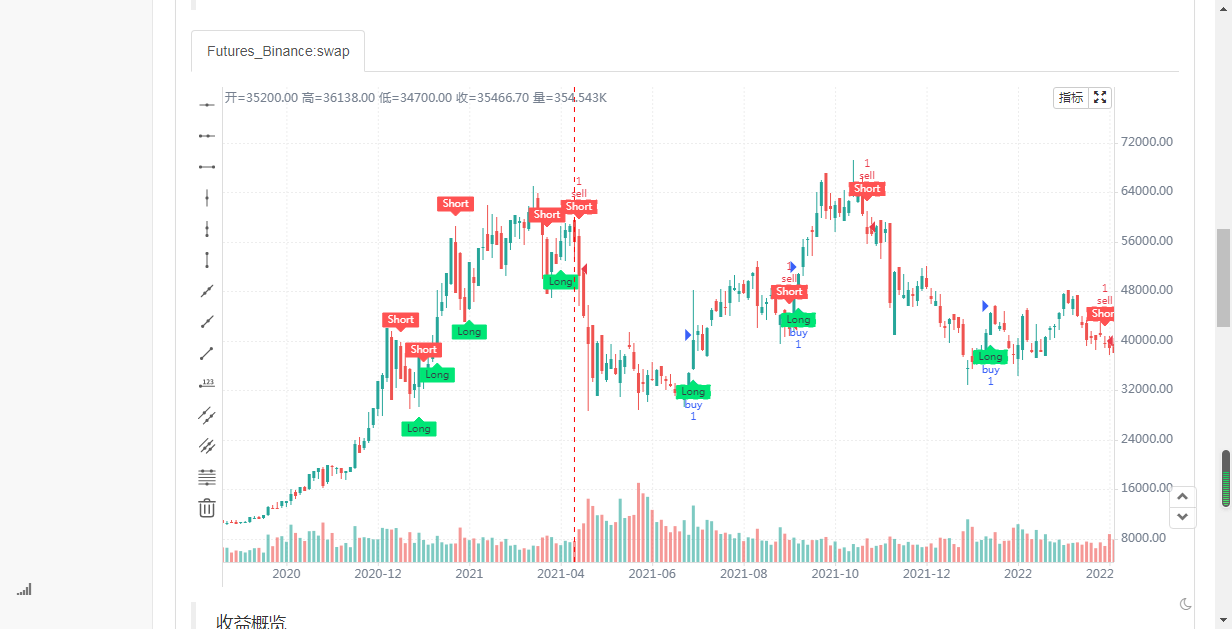
টুইন রেঞ্জ ফিল্টার
লেখক:Zer3192, তারিখ: ২০২২-০৬-০৪ ২০ঃ২৪ঃ৪৯ট্যাগঃইএমএ


/*backtest
start: 2021-05-08 00:00:00
end: 2022-05-07 23:59:00
period: 4h
basePeriod: 15m
exchanges: [{"eid":"Futures_Binance","currency":"BTC_USDT"}]
*/
// This source code is subject to the terms of the Mozilla Public License 2.0 at https://mozilla.org/MPL/2.0/
// © colinmck

//@version=4

study(title="Twin Range Filter", overlay=true)

source = input(defval=close, title="Source")

// Smooth Average Range

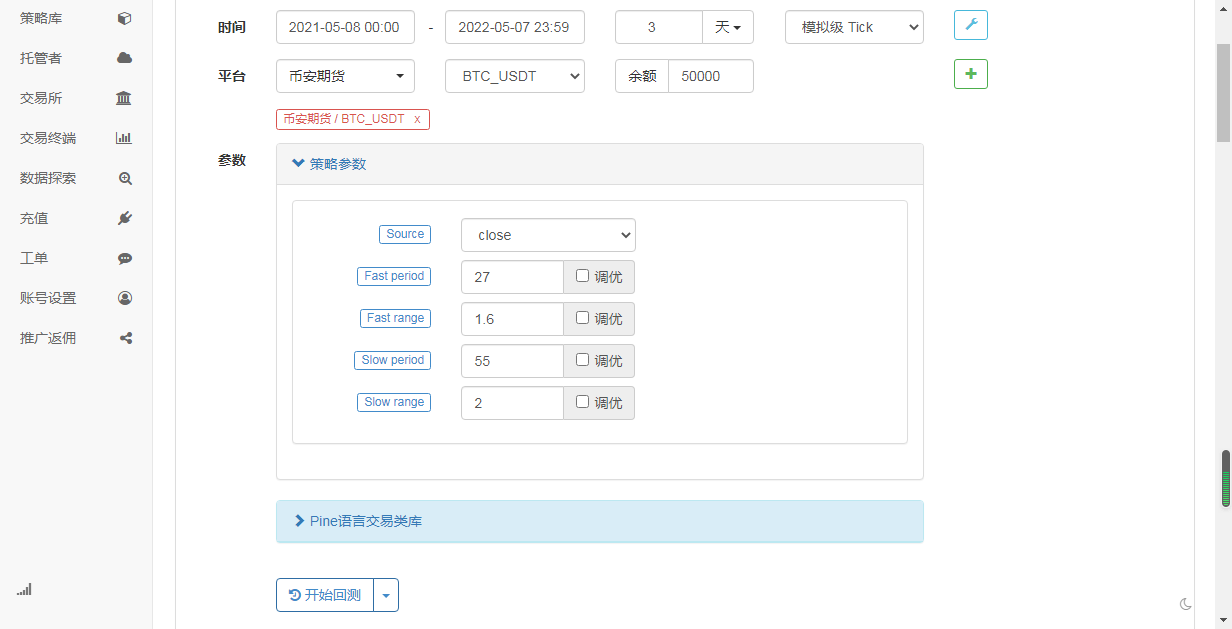
per1 = input(defval=27, minval=1, title="Fast period")
mult1 = input(defval=1.6, minval=0.1, title="Fast range")

per2 = input(defval=55, minval=1, title="Slow period")
mult2 = input(defval=2, minval=0.1, title="Slow range")

smoothrng(x, t, m) =>
    wper = t * 2 - 1
    avrng = ema(abs(x - x[1]), t)
    smoothrng = ema(avrng, wper) * m
    smoothrng
smrng1 = smoothrng(source, per1, mult1)
smrng2 = smoothrng(source, per2, mult2)
smrng = (smrng1 + smrng2) / 2

// Range Filter

rngfilt(x, r) =>
    rngfilt = x
    rngfilt := x > nz(rngfilt[1]) ? x - r < nz(rngfilt[1]) ? nz(rngfilt[1]) : x - r :
       x + r > nz(rngfilt[1]) ? nz(rngfilt[1]) : x + r
    rngfilt
filt = rngfilt(source, smrng)

upward = 0.0
upward := filt > filt[1] ? nz(upward[1]) + 1 : filt < filt[1] ? 0 : nz(upward[1])
downward = 0.0
downward := filt < filt[1] ? nz(downward[1]) + 1 : filt > filt[1] ? 0 : nz(downward[1])

hband = filt + smrng
lband = filt - smrng

longCond = bool(na)
shortCond = bool(na)
longCond := source > filt and source > source[1] and upward > 0 or source > filt and source < source[1] and upward > 0
shortCond := source < filt and source < source[1] and downward > 0 or source < filt and source > source[1] and downward > 0

CondIni = 0
CondIni := longCond ? 1 : shortCond ? -1 : CondIni[1]

long = longCond and CondIni[1] == -1
short = shortCond and CondIni[1] == 1

// Plotting

plotshape(long, title="Long", text="Long", style=shape.labelup, textcolor=color.black, size=size.tiny, location=location.belowbar, color=color.lime, transp=0)
plotshape(short, title="Short", text="Short", style=shape.labeldown, textcolor=color.white, size=size.tiny, location=location.abovebar, color=color.red, transp=0)

// Alerts

alertcondition(long, title="Long", message="Long")
alertcondition(short, title="Short", message="Short")
if long
   strategy.entry("buy", strategy.long)
else if short
    strategy.entry("sell", strategy.short)
সম্পর্কিত বিষয়বস্তু
- মাল্টি-ডাইমেনশনাল ট্রেন্ড ডিসিশন এবং এটিআর ডায়নামিক স্টপ-ডাউন কৌশল
- উচ্চতর মাল্টি-পয়েন্টার ট্রেন্ড ট্রেডিং কৌশল নিশ্চিত
- স্বনির্ধারিত ট্রেন্ড ট্র্যাকিং এবং একাধিক নিশ্চিতকরণ লেনদেন কৌশল
- ডায়নামিক ওয়াইনারি সিস্টেমের সাথে RSI গতির সূচকগুলির সাথে দিনের ব্যবসায়ের অপ্টিমাইজেশন কৌশল
- একাধিক প্রযুক্তিগত সূচক ক্রস গতিশীলতা প্রবণতা ট্র্যাকিং কৌশল
- ইএমএ ট্রেন্ডের সাথে রুটিন রিপয়েন্ট ট্রেডিং কৌশলকে ভেঙে দেয়
- মাল্টি-ইউনিট্রি ক্রস-সাহায্যকারী আরএসআই ডায়নামিক প্যারামিটার পরিমাণগত ট্রেডিং কৌশল
- গতিশীল প্রবণতা RSI ক্রস কৌশল নির্ধারণ করে
- ডাবল ক্রস ট্রেন্ড ট্র্যাকিং কৌশলঃ সূচক সমান্তরাল এবং MACD সমন্বিত ট্রেডিং সিস্টেম
- মাল্টি-পরিমাপক মাল্টি-মাত্রিক প্রবণতা ক্রস উচ্চতর পরিমাণগত কৌশল
- মাল্টি স্লাইড মিডলাইন ডায়নামিক ক্রস ট্রেন্ড ট্র্যাকিং এবং মাল্টি কনফার্মেশন কোয়ালিফাইড ট্রেডিং কৌশল
আরও দেখুন
- ডিরেকশনাল মুভমেন্ট অসিলেটর (ডিএমআই)
- রেভি এফএক্স ফিসার
- সহজ স্টক
- রেনকো বিপরীতমুখী সতর্কতা
- ডেমার্ক রিভার্স পয়েন্ট [সিসি]
- লাইন নির্দেশক অনুসরণ করুন
- ইট সংখ্যা (রেঙ্কো)
- রেঞ্জ ফিল্টার কিনুন এবং বিক্রয় 5 মিনিট [কৌশল]
- ইনভার্টেড হ্যামার - বর্ধিত বিকল্প
- TUE ADX/MACD কনফ্লুয়েন্স V1.0
- এসএআর - উচ্চ এবং নিম্ন
- সঠিক সুইং ট্রেডিং সিস্টেম
- রৈখিক প্রবণতা
- ফিবোনাচি টাইমিং প্যাটার্ন
- ডারভাস বক্স কিনুন বিক্রি করুন
- ডিমার্ক সেটআপ সূচক
- Bollinger Bands স্টোকাস্টিক RSI Extreme
- AK MACD BB INDICATOR V ১.০০
- প্যারাবোলিক এসএআর
- আরএসআই ডিভার্জেন্স ইন্ডিকেটর