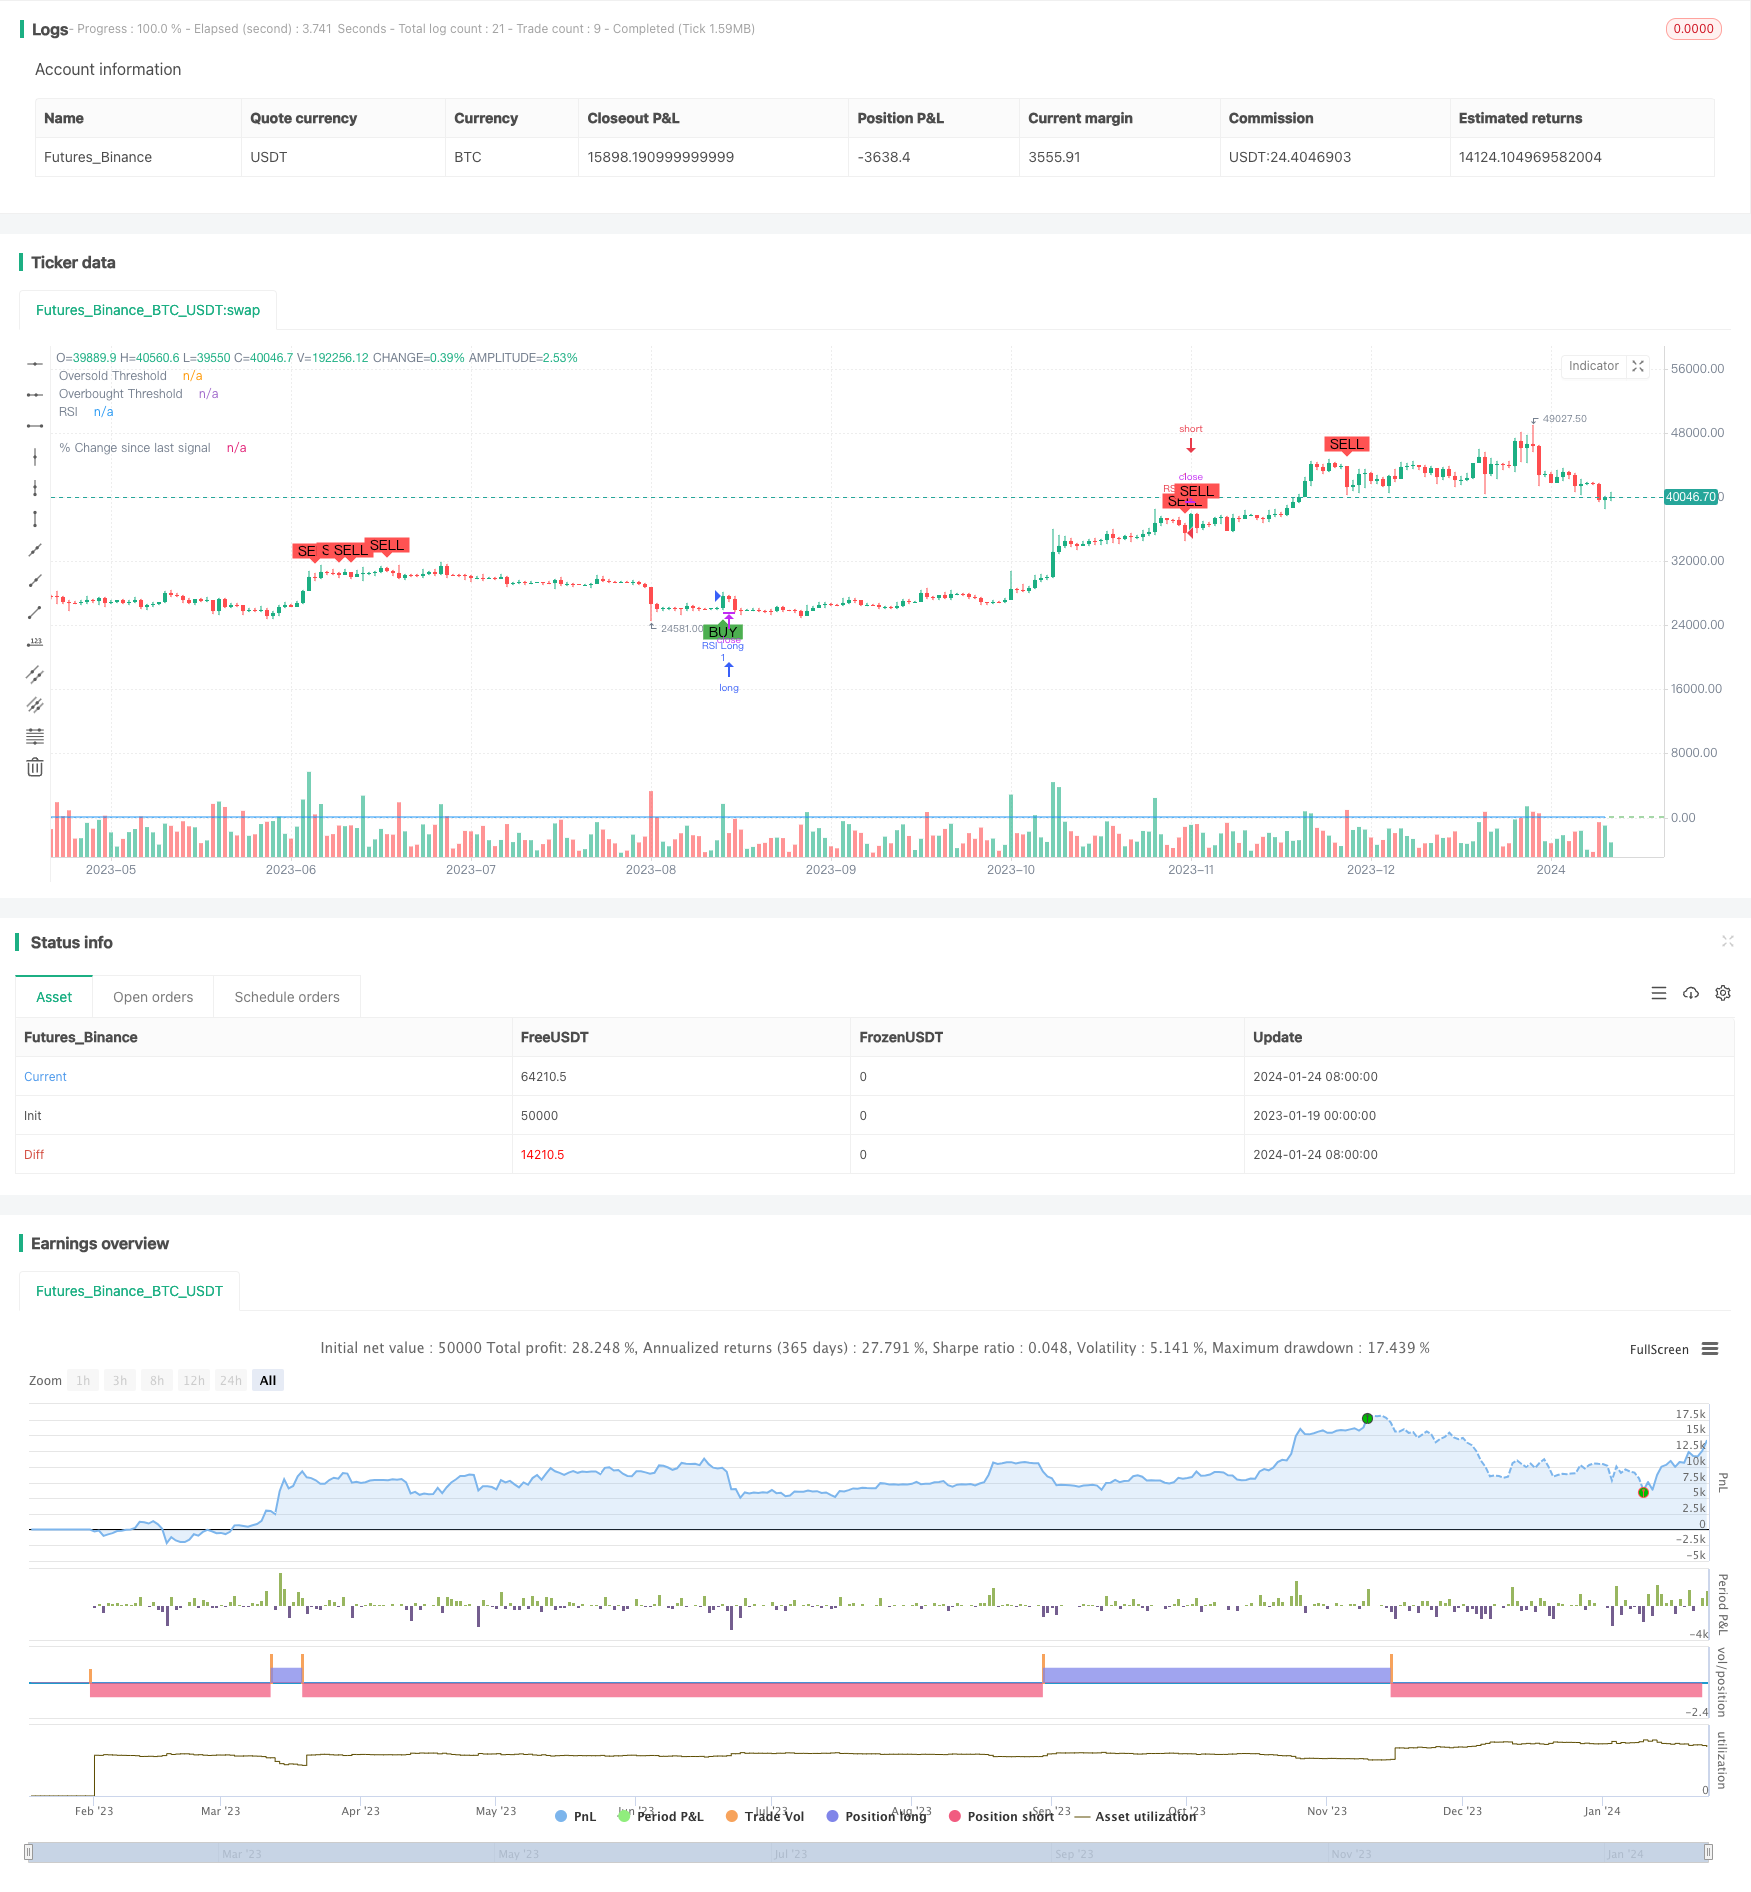
ইম্পটেম রিভার্সাল ট্রেডিং কৌশল
লেখক:চাওঝাংট্যাগঃ

সারসংক্ষেপ
কৌশলগত যুক্তি
সুবিধা বিশ্লেষণ
- রিভার্সাল কার্যকরভাবে চিহ্নিত করার জন্য ওভারকুপ / ওভারসোল্ড বিচার করার জন্য RSI এর ক্ষমতা ব্যবহার করে
ঝুঁকি বিশ্লেষণ
অপ্টিমাইজেশান নির্দেশাবলী
- একক ট্রেড লস নিয়ন্ত্রণে স্টপ লস যোগ করুন
- বিভিন্ন দৈর্ঘ্যের পরীক্ষার RSI সময়কাল
সংক্ষিপ্তসার
/*backtest
start: 2023-01-19 00:00:00
end: 2024-01-25 00:00:00
period: 1d
basePeriod: 1h
exchanges: [{"eid":"Futures_Binance","currency":"BTC_USDT"}]
*/

//@version=5
strategy("Improved RSI Strategy", overlay=true)

// Define RSI parameters
rsiLength = input(14, title="RSI Length")
rsiOversold = input(30, title="Oversold Threshold")
rsiOverbought = input(70, title="Overbought Threshold")

// Calculate RSI
rsiValue = ta.rsi(close, rsiLength)

// Define entry conditions
longCondition = ta.crossover(rsiValue, rsiOversold)
shortCondition = ta.crossunder(rsiValue, rsiOverbought)

// Plot RSI and thresholds
plot(rsiValue, title="RSI", color=color.blue)
hline(rsiOversold, title="Oversold Threshold", color=color.red)
hline(rsiOverbought, title="Overbought Threshold", color=color.green)

// Calculate percentage change since last signal
var float percentageChange = na
lastCloseValue = ta.valuewhen(longCondition or shortCondition, close, 1)

if longCondition or shortCondition
    percentageChange := (close - lastCloseValue) / lastCloseValue * 100

plot(percentageChange, color=color.blue, style=plot.style_histogram, linewidth=1, title="% Change since last signal")

// Execute strategy
if longCondition
    strategy.entry("RSI Long", strategy.long)

if shortCondition
    strategy.entry("RSI Short", strategy.short)

// Plot shapes and text for buy/sell signals
plotshape(series=longCondition, title="Buy Signal", location=location.belowbar, color=color.green, style=shape.labelup, text="BUY")
plotshape(series=shortCondition, title="Sell Signal", location=location.abovebar, color=color.red, style=shape.labeldown, text="SELL")
আরো
- অভিযোজিত ট্রিপল সুপারট্রেন্ড কৌশল
- চলমান গড় ক্রসওভার কৌশল
- একাধিক সূচকযুক্ত পরিমাণগত ট্রেডিং কৌশল
- মার্কেট সাইফার ওয়েভ বি অটোমেটেড ট্রেডিং কৌশল
- মূল বিপরীতমুখী ব্যাকটেস্ট কৌশল
- তিনটি ইএমএ স্টোকাস্টিক আরএসআই ক্রসওভার গোল্ডেন ক্রস কৌশল
- সুইং হাই লো প্রাইস চ্যানেল স্ট্র্যাটেজি V.1
- অ্যাডাপ্টিভ লিনিয়ার রিগ্রেশন চ্যানেল কৌশল
- চলমান গড় পার্থক্য শূন্য ক্রস কৌশল
- একাধিক সূচক কৌশল অনুসরণ করে
- কৌশল অনুসরণ করে দৃঢ় প্রবণতা
- কৌশল অনুসরণ করে মূল্য ক্রসিং চলমান গড় প্রবণতা
- ডাবল ইএমএ গোল্ডেন ক্রস ব্রেকআউট কৌশল
- ধীরে ধীরে বিবি কেসি ট্রেন্ড কৌশল
- ট্রিপল এসএমএ অটো-ট্র্যাকিং কৌশল
- বিটকয়েন ফিউচার ট্রেডিং কৌশল
- মেশিন লার্নিং এর উপর ভিত্তি করে স্টোকাস্টিক অপ্টিমাইজেশান সহ মূল্য EMA