Bitcoin Quantitative Band Trading Strategie basierend auf mehreren Zeitrahmen
Schriftsteller:ChaoZhang, Datum: 23.12.2023Tags:

Übersicht
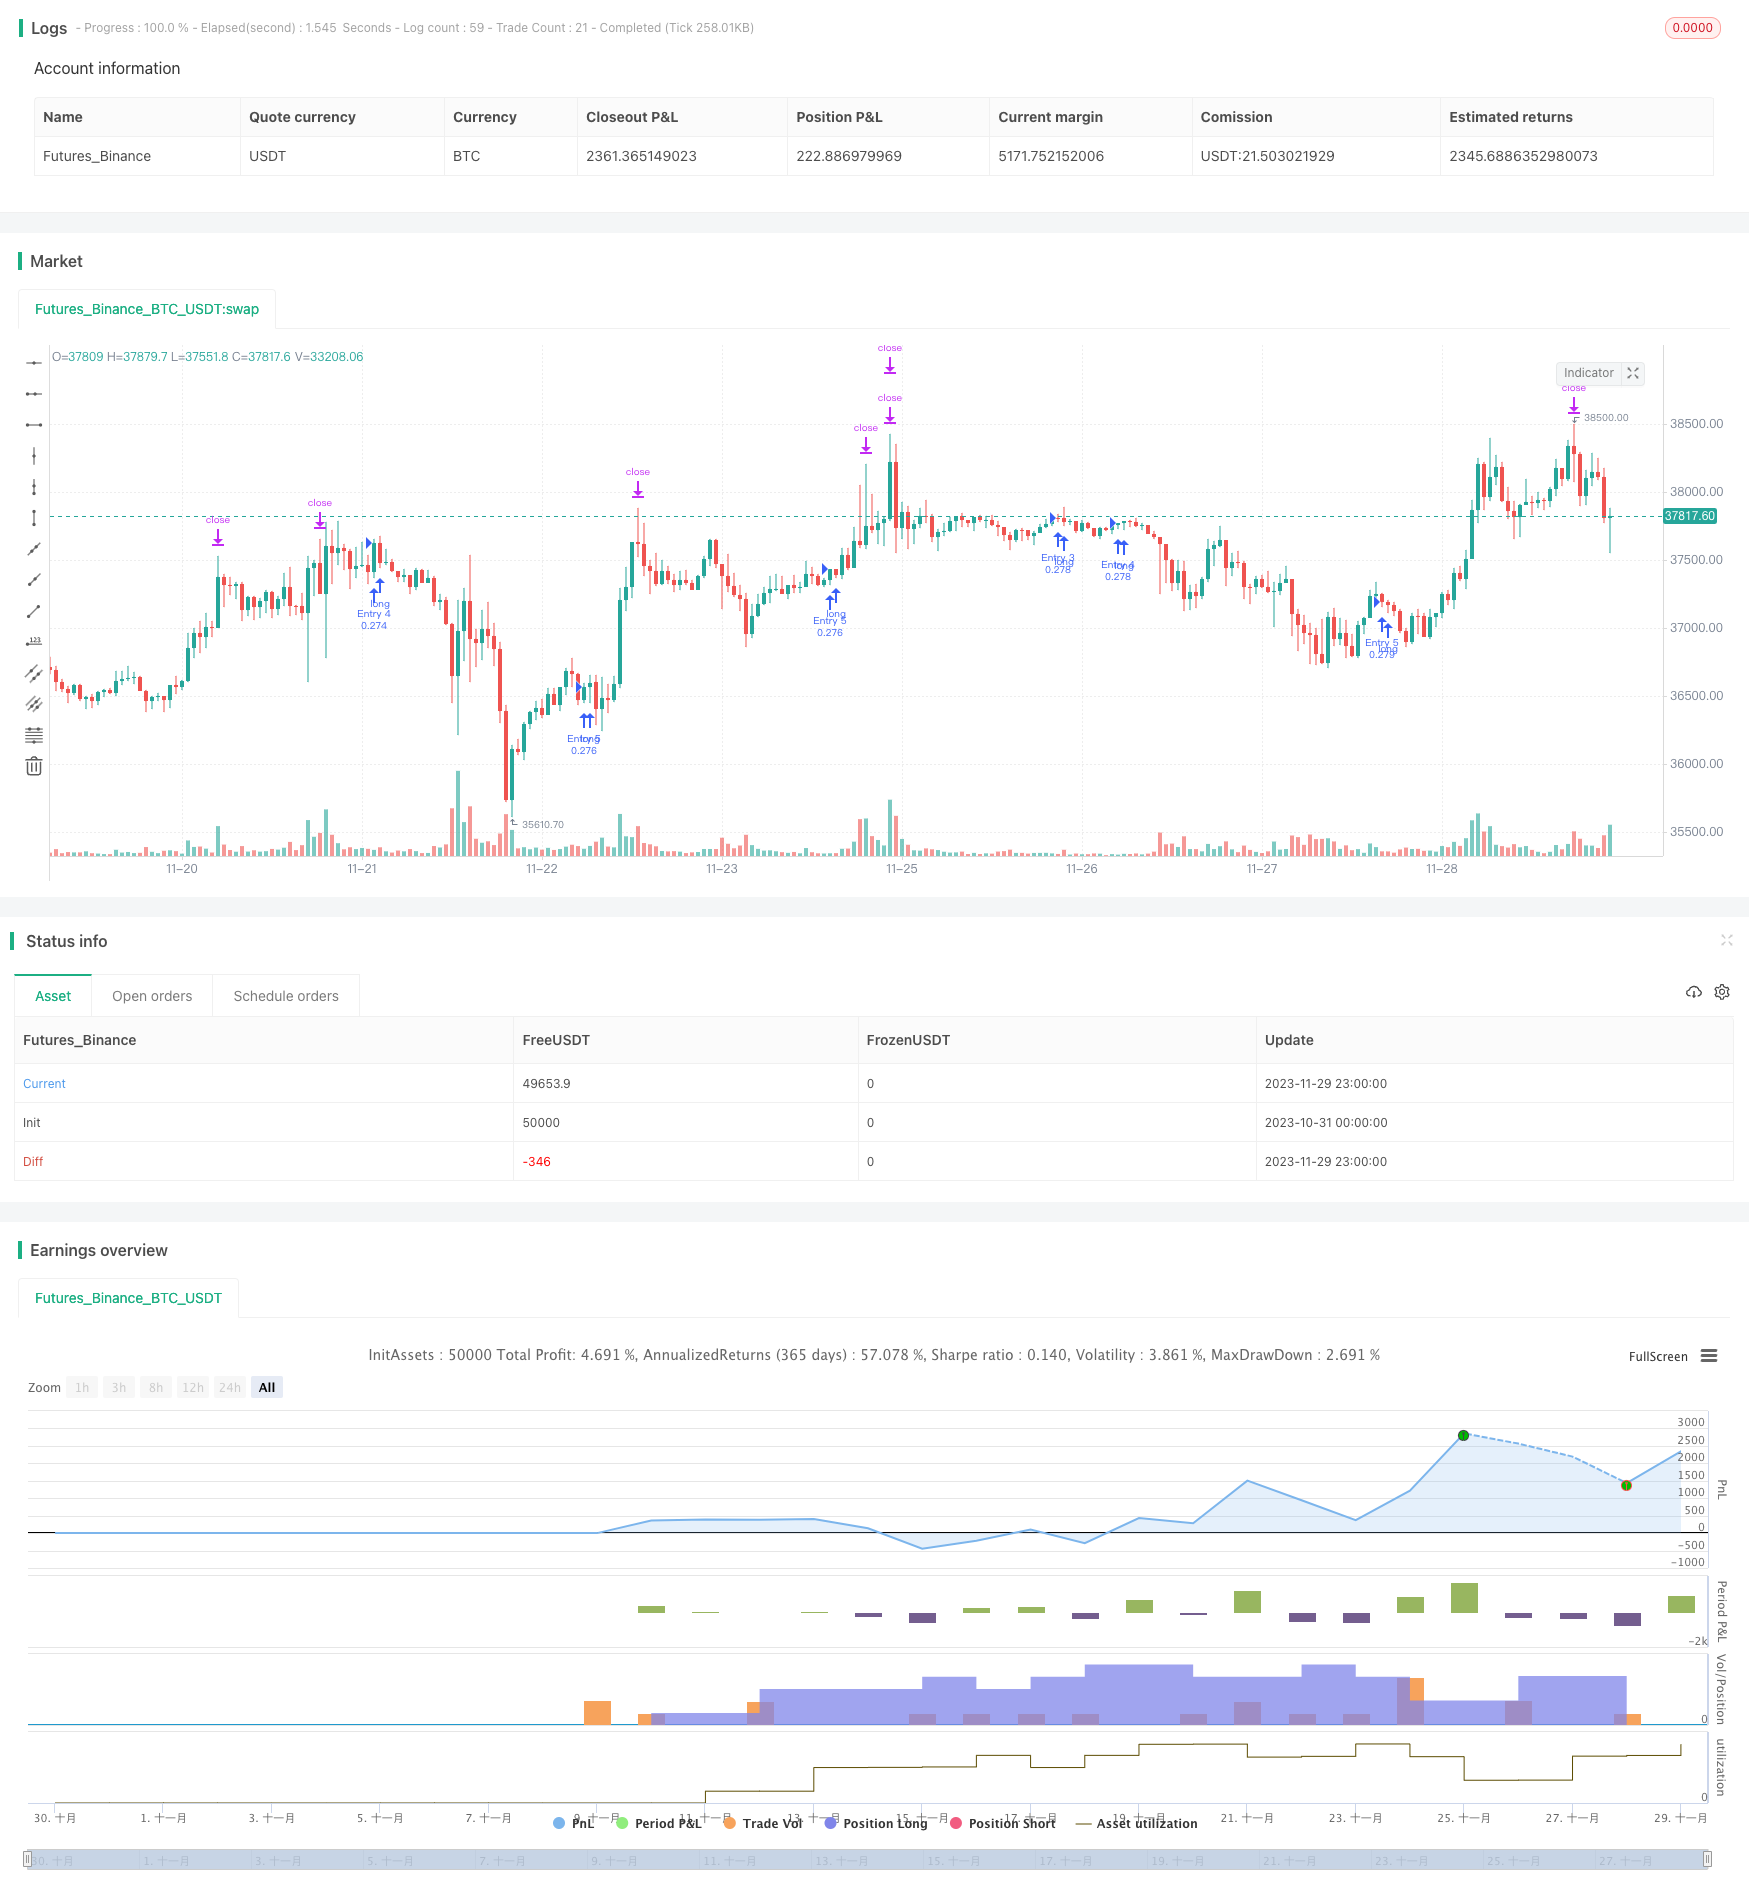
Diese Strategie identifiziert die Preisbänder von Bitcoin, indem sie quantitative Indikatoren über verschiedene Zeitrahmen hinweg kombiniert und Trends verfolgt.
Strategie Logik
- Der RSI-Indikator, der auf der Grundlage des täglichen Zeitrahmens berechnet wird, wird auf der Grundlage des Handelsvolumens gewogen, um falsche Ausbrüche zu filtern.
- Der tägliche RSI-Indikator wird durch eine EMA glättet, um einen quantitativen Band-Indikator zu erstellen.
- Der 5-minütige Zeitrahmen verwendet eine Kombination aus linearen Regressions- und HMA-Indikatoren, um Handelssignale zu erzeugen.
- Durch die Kombination des quantitativen Band-Indikators und der Handelssignale über Zeiträume hinweg werden mittelfristige bis langfristige Preisbereiche ermittelt.
Analyse der Vorteile
- Der volumengewichtete RSI-Indikator kann echte Bands effektiv identifizieren und falsche Ausbrüche filtern.
- Der HMA-Indikator ist anfälliger für Preisänderungen und kann Pünktlichkeiten erfassen.
- Die Kombination mehrerer Zeitrahmen führt zu einer genaueren Ermittlung der mittelfristigen bis langfristigen Bands.
- Der Handel im 5-minütigen Zeitrahmen ermöglicht eine höhere Betriebsfrequenz.
- Als Band-Tracking-Strategie erfordert sie keine genaue Auswahl von Punkten und kann länger halten.
Risikoanalyse
- Quantitative Indikatoren können falsche Signale erzeugen, eine Fundamentalanalyse wird empfohlen.
- Es kann sein, dass sich die Bands auf halbem Weg umkehren. Es sollten Stop-Loss-Mechanismen vorhanden sein.
- Signalverzögerungen können dazu führen, dass die besten Einstiegspunkte fehlen.
- Gewinnbringende Bands benötigen längere Haltedauer und erfordern Kapitaldrucktoleranz.
Optimierungsrichtlinien
- Prüfung der Wirksamkeit von RSI-Indikatoren mit verschiedenen Parametern.
- Versuchen Sie, andere Hilfsbandanzeigen einzuführen.
- Optimierung der Längenparameter des HMA-Indikators.
- Fügen Sie Stop-Loss- und Take-Profit-Strategien hinzu.
- Anpassung des Haltezyklus für Bandhandel.
Schlussfolgerung
Diese Strategie erfasst effektiv die mittelfristigen bis langfristigen Trends von Bitcoin, indem sie Zeitrahmen und Band-Tracking kombiniert. Im Vergleich zum kurzfristigen Handel sieht der mittelfristige bis langfristige Band-Handel kleinere Drawdowns und ein größeres Gewinnpotenzial.
/*backtest
start: 2023-10-31 00:00:00
end: 2023-11-30 00:00:00
period: 1h
basePeriod: 15m
exchanges: [{"eid":"Futures_Binance","currency":"BTC_USDT"}]
*/

//@version=4

strategy(title='Pyramiding BTC 5 min', overlay=true, pyramiding=5, initial_capital=10000, default_qty_type=strategy.percent_of_equity, default_qty_value=20, commission_type=strategy.commission.percent, commission_value=0.075)
//the pyramide based on this script  https://www.tradingview.com/script/7NNJ0sXB-Pyramiding-Entries-On-Early-Trends-by-Coinrule/
//
fastLength = input(250, title="Fast filter length ", minval=1)
slowLength = input(500,title="Slow filter length",  minval=1)
source=close
v1=ema(source,fastLength)
v2=ema(source,slowLength)
//
//Backtest dates
fromMonth = input(defval=1, title="From Month")
fromDay = input(defval=10, title="From Day")
fromYear = input(defval=2020, title="From Year")
thruMonth = input(defval=1, title="Thru Month")
thruDay = input(defval=1, title="Thru Day")
thruYear = input(defval=2112, title="Thru Year")

showDate = input(defval=true, title="Show Date Range")

start = timestamp(fromYear, fromMonth, fromDay, 00, 00)  // backtest start window
finish = timestamp(thruYear, thruMonth, thruDay, 23, 59)  // backtest finish window
window() =>  // create function "within window of time"
    time >= start and time <= finish ? true : false


leng=1
p1=close[1]

len55 = 10
//taken from https://www.tradingview.com/script/Ql1FjjfX-security-free-MTF-example-JD/
HTF = input("1D", type=input.resolution)
ti = change( time(HTF) ) != 0
T_c = fixnan( ti ? close : na )

vrsi = rsi(cum(change(T_c) * volume), leng)
pp=wma(vrsi,len55)

d=(vrsi[1]-pp[1])
len100 = 10
x=ema(d,len100)
//
zx=x/-1
col=zx > 0? color.lime : color.orange

//

tf10 = input("1", title = "Timeframe", type = input.resolution, options = ["1", "5", "15", "30", "60","120", "240","360","720", "D", "W"])

length = input(50, title = "Period", type = input.integer)
shift = input(1, title = "Shift", type = input.integer)

hma(_src, _length)=>
    wma((2 * wma(_src, _length / 2)) - wma(_src, _length), round(sqrt(_length)))

hma3(_src, _length)=>
    p = length/2
    wma(wma(close,p/3)*3 - wma(close,p/2) - wma(close,p),p)

b =security(syminfo.tickerid, tf10, hma3(close[1], length)[shift])
//plot(a,color=color.gray)
//plot(b,color=color.yellow)
close_price = close[0]
len = input(25)

linear_reg = linreg(close_price, len, 0)


filter=input(true)

buy=crossover(linear_reg, b)

longsignal = (v1 > v2 or filter == false ) and buy and window()

//set take profit

ProfitTarget_Percent = input(3)
Profit_Ticks = close * (ProfitTarget_Percent / 100) / syminfo.mintick

//set take profit

LossTarget_Percent = input(10)
Loss_Ticks = close * (LossTarget_Percent / 100) / syminfo.mintick


//Order Placing

strategy.entry("Entry 1", strategy.long, when=strategy.opentrades == 0 and longsignal)

strategy.entry("Entry 2", strategy.long, when=strategy.opentrades == 1 and longsignal)

strategy.entry("Entry 3", strategy.long, when=strategy.opentrades == 2 and longsignal)

strategy.entry("Entry 4", strategy.long, when=strategy.opentrades == 3 and longsignal)

strategy.entry("Entry 5", strategy.long, when=strategy.opentrades == 4 and longsignal)


if strategy.position_size > 0
    strategy.exit(id="Exit 1", from_entry="Entry 1", profit=Profit_Ticks, loss=Loss_Ticks)
    strategy.exit(id="Exit 2", from_entry="Entry 2", profit=Profit_Ticks, loss=Loss_Ticks)
    strategy.exit(id="Exit 3", from_entry="Entry 3", profit=Profit_Ticks, loss=Loss_Ticks)
    strategy.exit(id="Exit 4", from_entry="Entry 4", profit=Profit_Ticks, loss=Loss_Ticks)
    strategy.exit(id="Exit 5", from_entry="Entry 5", profit=Profit_Ticks, loss=Loss_Ticks)
Mehr
- Doppelindikatoren-Combo Crazy Intraday Scalping-Strategie
- Dynamische Netzhandelsstrategie
- Handelsstrategie mit doppelten gleitenden Durchschnitten
- Früherer Gewinnspiel mit gleitendem Durchschnitt Eröffnungsgespräch Exitstrategie
- Monatliche parabolische Ausbruchsstrategie
- Trendfilter gleitender Durchschnitt Quantifizierungsstrategie
- RSI und quantitative Handelsstrategie auf Basis gleitender Durchschnitte
- Strategie zur Erfassung der Volatilität des RSI-Bollinger-Band
- Umgekehrte Triaden-Quantitative Strategie
- FiboBuLL-Wellenstrategie basierend auf Bollinger-Band-Breakout
- Trend nach der Strategie des exponentiellen gleitenden Durchschnitts
- Strategie zur Umkehrung von Verlusten durch Trailing Stop
- Schnelle RSI-Umkehrstrategie
- Die Risikopositionen werden in der Tabelle 1 aufgeführt.
- RSI-Strategie für den Kreuzungstrend
- Dynamische Unterstützungs- und Widerstandsstrategie auf der Grundlage historischer Daten
- Noros Bollinger-Tracking-Strategie
- EMA-Umkehr-Kauf-Verkauf-Strategie
- Harami Schlusskursstrategie
- Momentum-Handelsstrategie auf der Grundlage von CMO und WMA