概述
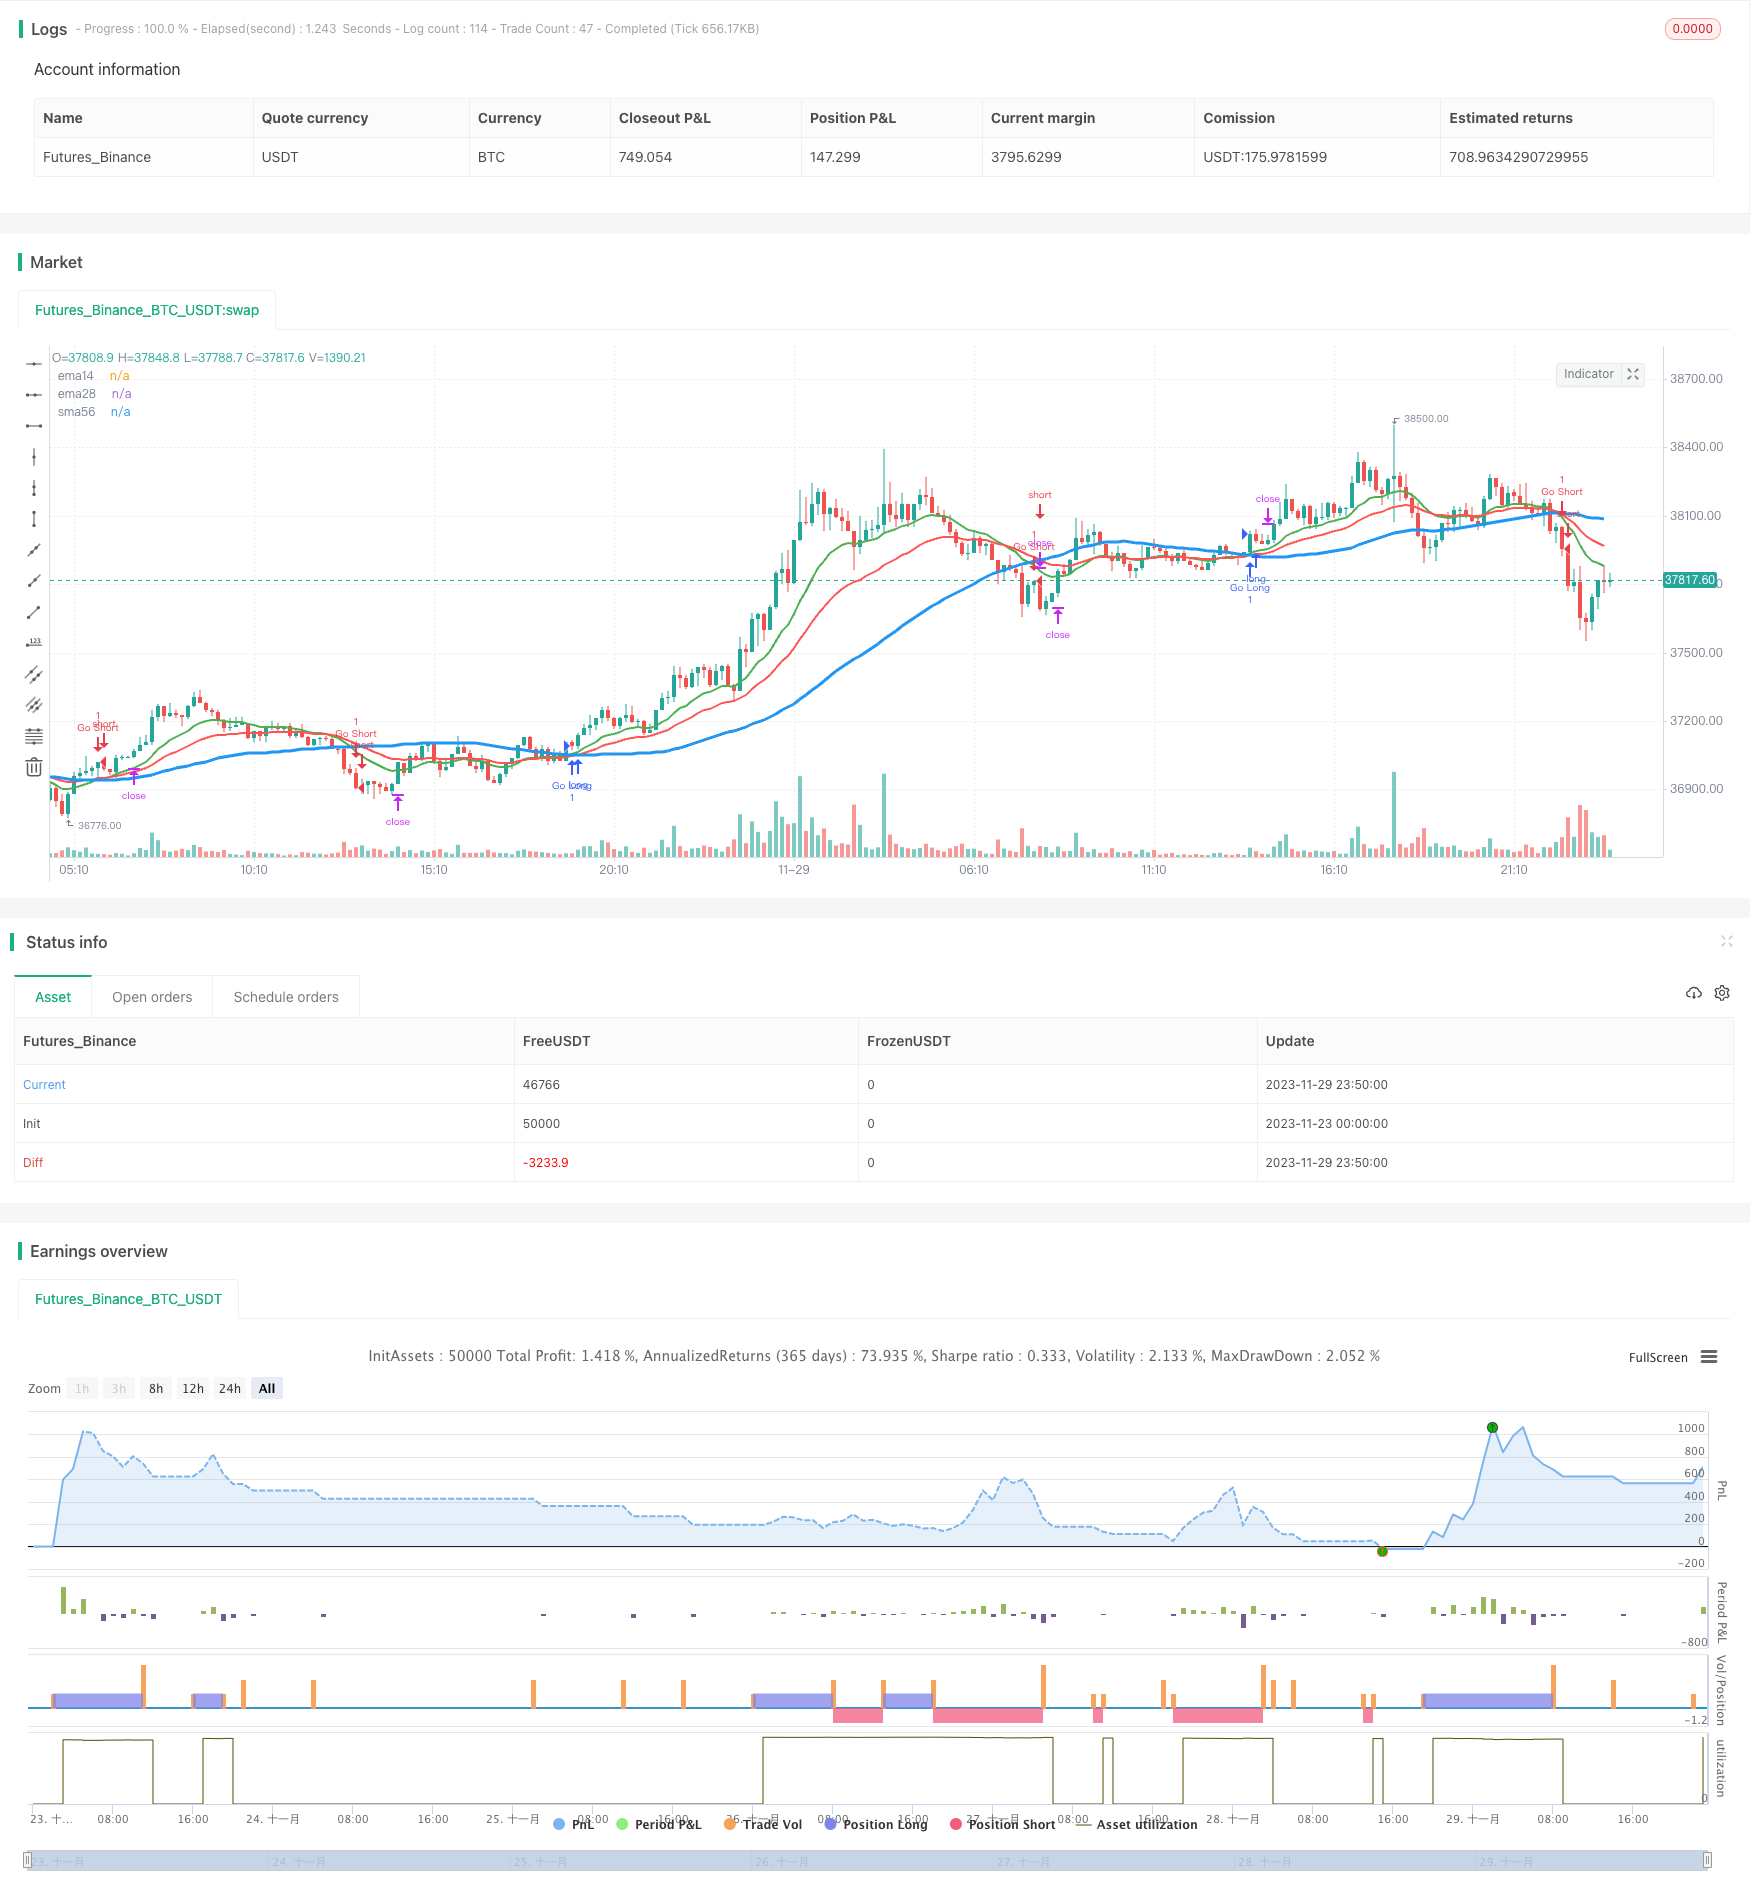
该策略基于移动平均线金叉和死叉实现长短做多做空,同时根据先机获利的统计数据,只在下午收盘止损和止盈,避免被早盘的高波动率套住。
策略原理
该策略使用3个不同参数的移动平均线:14日线、28日线和56日线。当14日线上穿56日线时做多;当14日线下穿56日线时做空。这是基本的追踪长线趋势的方法。为了过滤掉部分噪音,策略还加入28日线作为参考,只有当14日线同时高于或低于28日线时才会发出交易信号。
该策略的关键创新之处在于,它只在下午四点到五点之间止盈止损。根据统计数据,一天的最高价和最低价有70%的概率会在开盘第一个小时内产生。为了规避开盘时的高波动对策略的冲击,仅在下午交易时段止损止盈。
优势分析
该策略具有以下几个优势:
1. 追踪中长线趋势,避免被过多噪音影响
2. 利用开盘高波动的统计特征设计止损止盈逻辑,有效规避假突破
3. 简单直观的思路,容易理解和修改
风险及解决方法
该策略也存在以下风险:
1. 如果趋势在早盘就反转,会错过机会。可以测试是否适合股票本身的特征。
2. 如果盘后继续大幅波动,仍有被套的风险。可以测试适当放宽止损幅度。
3. 回测时间区间设置不当,可能导致过拟合。应扩大回测时间段。
优化方向
该策略可以从以下几个方面进一步优化:
- 测试不同的移动平均线组合,寻找最优参数
- 根据具体股票的波动特征微调止损幅度
- 结合交易量过滤信号,避免被套
- 增加动态止损,跟踪突破后的回撤
总结
本策略整体思路清晰易懂,有效利用了开盘特点设计止损逻辑,可避免早盘高波动的套牢,值得进一步测试和优化。但也存在被套和错过机会的风险,需针对个股调整参数。总体而言,该策略为初学者提供了一个简单有效的量化交易思路。
策略源码
/*backtest
start: 2023-11-23 00:00:00
end: 2023-11-30 00:00:00
period: 10m
basePeriod: 1m
exchanges: [{"eid":"Futures_Binance","currency":"BTC_USDT"}]
*/

//@version=2
strategy("MAC 1st Trading Hour Walkover", overlay=true)

// Setting up timeperiod for testing
startPeriodYear = input(2014, "Backtest Start Year")
startPeriodMonth = input(1, "Backtest Start Month")
startPeriodDay = input(2, "Backtest Start Day")
testPeriodStart = timestamp(startPeriodYear, startPeriodMonth, startPeriodDay, 0, 0)

stopPeriodYear = input(2025, "Backtest Stop Year")
stopPeriodMonth = input(12, "Backtest Stop Month")
stopPeriodDay = input(30, "Backtest Stop Day")
testPeriodStop = timestamp(stopPeriodYear, stopPeriodMonth, stopPeriodDay, 0, 0)

// Moving Averages
ema14 = ema(close, 14)
ema28 = ema(close, 28)
sma56 = sma(close, 56)

// Plot
plot(ema14, title="ema14", linewidth=2, color=green)
plot(ema28, title="ema28", linewidth=2, color=red)
plot(sma56, title="sma56", linewidth=3, color=blue)

// Strategy
goLong = cross(ema14, sma56) and ema14 > ema28
goShort = cross(ema14, sma56) and ema14 < ema28

// Strategy.When to enter
if time >= testPeriodStart
    if time <= testPeriodStop
        strategy.entry("Go Long", strategy.long, 1.0, when=goLong)
        strategy.entry("Go Short", strategy.short, 1.0, when=goShort)

// Strategy.When to take profit
if time >= testPeriodStart
    if time <= testPeriodStop
        strategy.exit("Close Long", "Go Long", profit=2000)
        strategy.exit("Close Short", "Go Short", profit=2000)

// Strategy.When to stop out
// Some studies show that 70% of the days high low happen in the first hour
// of trading. To avoid having that volatility fire our loss stop we
// ignore price action in the morning, but allow stops to fire in the afternoon.
if time("60", "1000-1600")
    strategy.exit("Close Long", "Go Long", loss=500)
    strategy.exit("Close Short", "Go Short", loss=500)
更多内容