概述
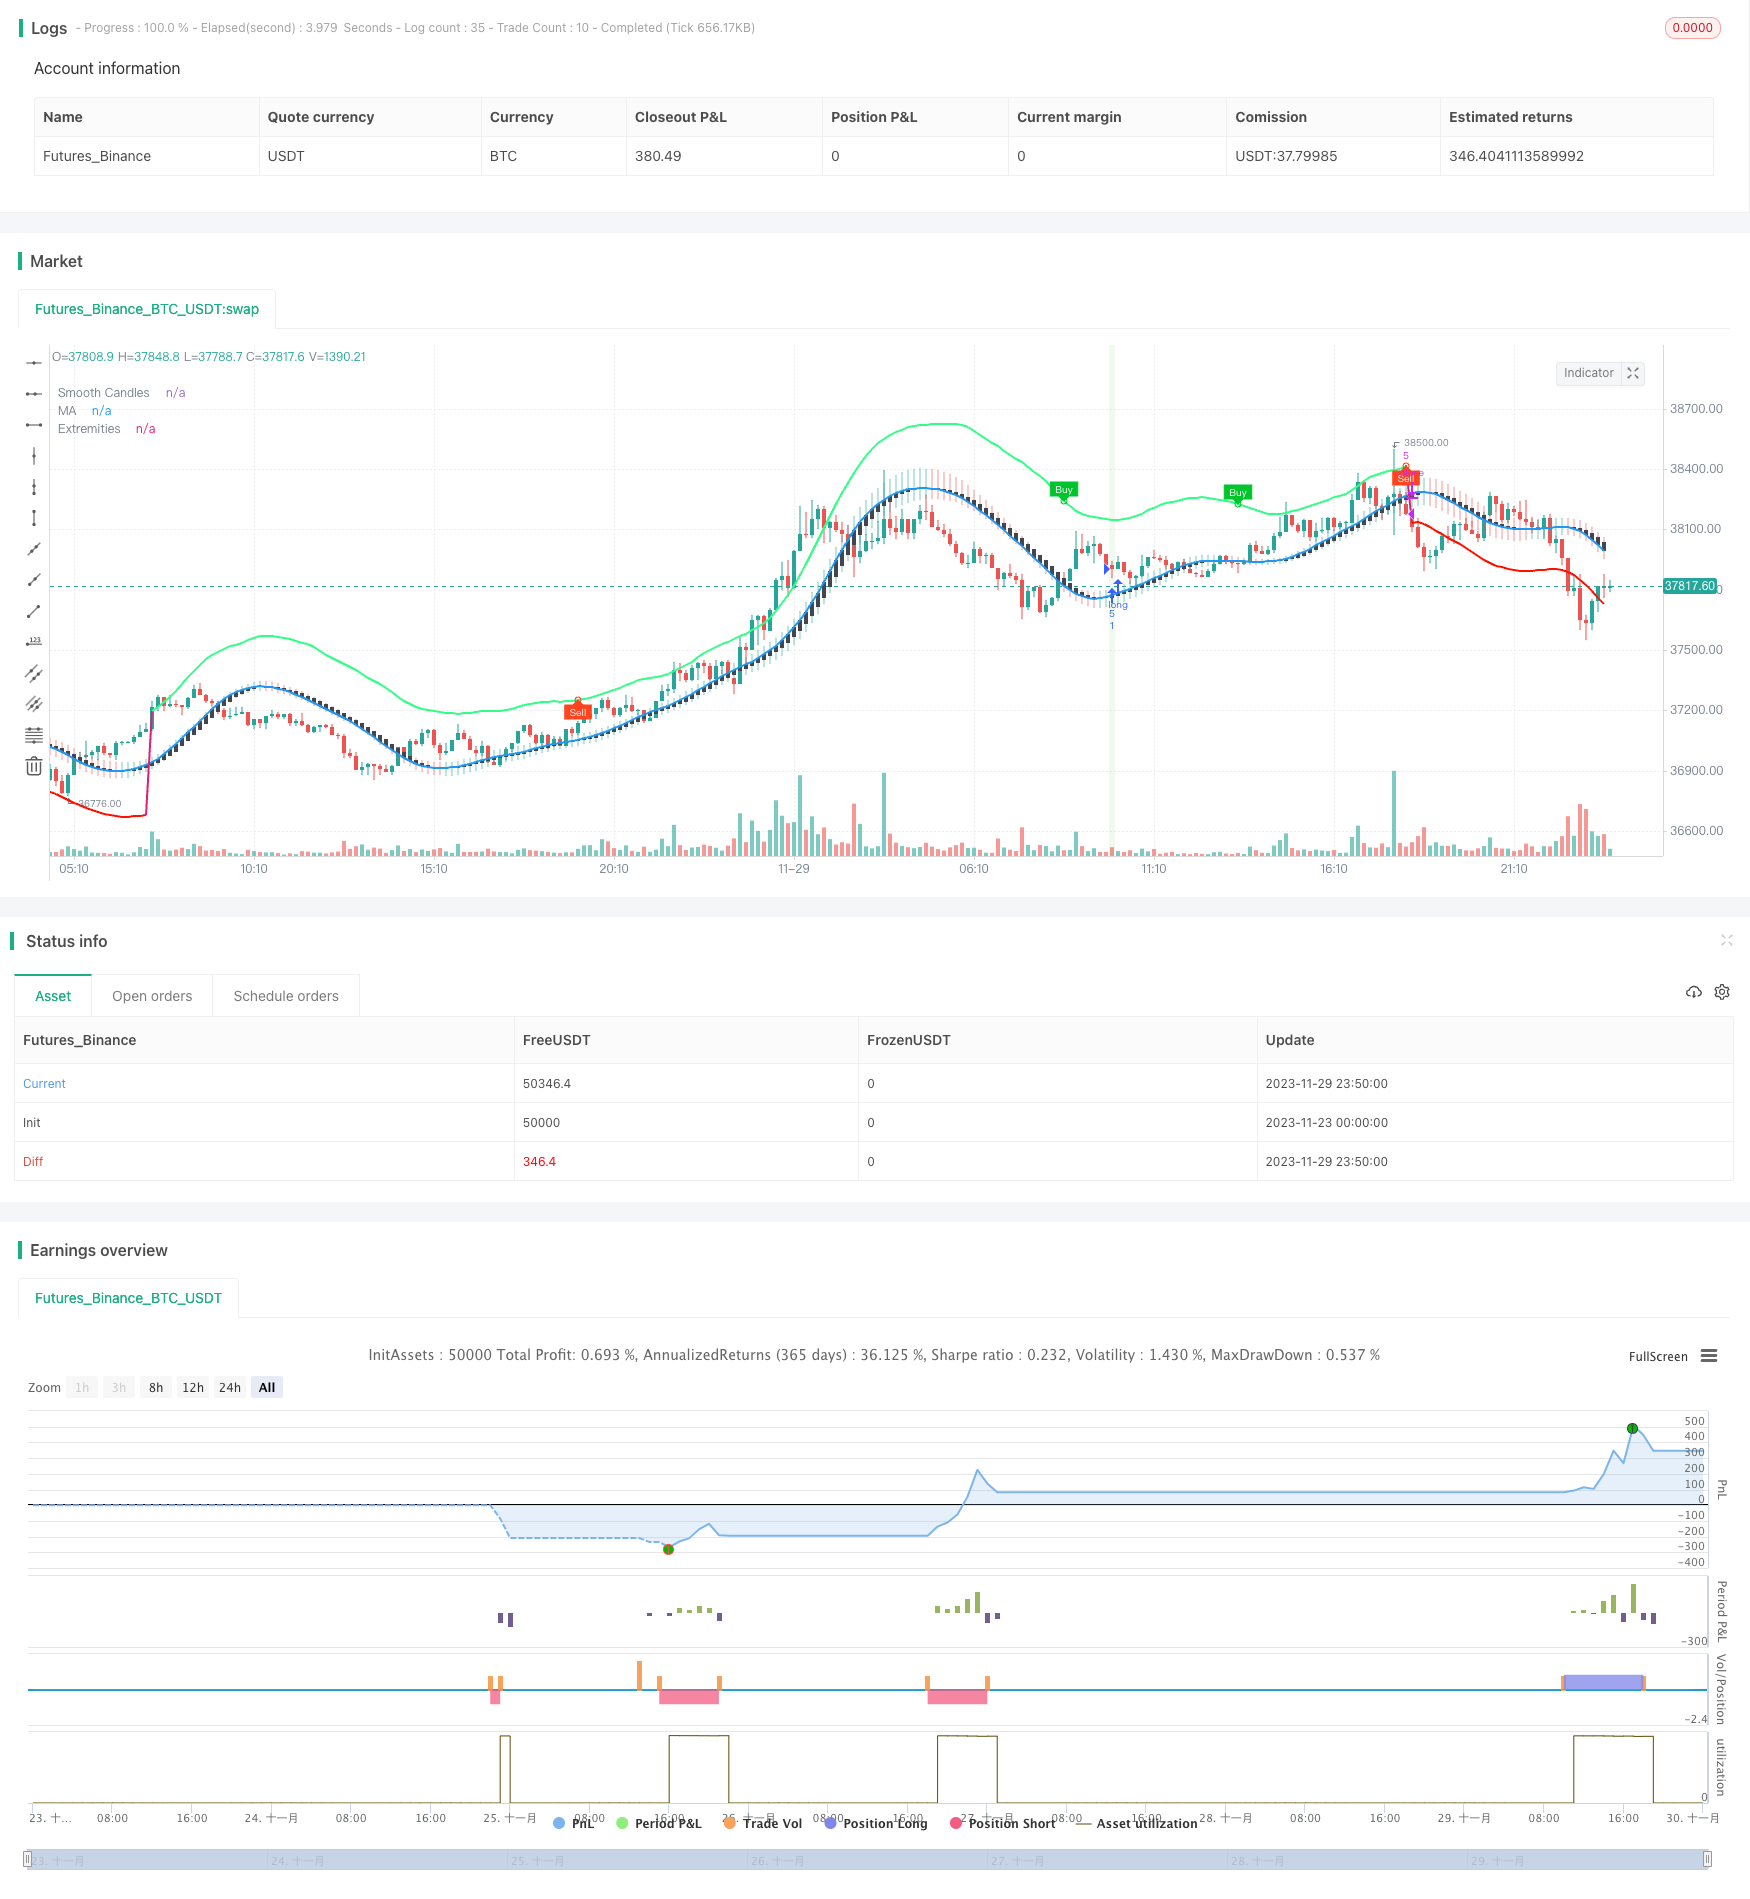
该策略将LuxAlgo开发的TMO和AMA两个指标的买卖信号进行组合,在震荡盘整理中捕捉趋势开始的机会。它会在满足TMO指标买卖信号、AMA指标买卖极值、K线实体量逐渐放大等多个条件后,做多做空。止损方式为最近N根K线的最高价最低价。
策略原理
TMO指标反映价格动量。它属于震荡指标类型,在价格出现背离时可以发出交易信号。AMA指标是一种平滑移动平均线指标。它显示价格波动的一个范围,价格接近上下轨时表示超买超卖现象。
该策略所依据的主要逻辑是:TMO指标能反映价格趋势背离提供交易信号,AMA指标能显示价格可能反转的区域,同时结合K线实体量放大来确认趋势启动。因此它们的组合可以提高交易成功率。具体来说,策略会在以下情况开仓做多或做空:
- TMO指标出现做多信号,即价格背离向上 AND AMA指标出现做多极大值
- TMO指标出现做空信号,即价格背离向下 AND AMA指标出现做空极小值
- 同时要求最近3根K线的实体量越来越大
这样它就解决了单一指标造成的假信号问题。止损方式选择了最近N根K线内最高价最低价,可以比较好地控制风险。
策略优势
该策略具有以下几个优势:
指标组合,提高信号准确率。TMO指标和AMA指标互相验证,可以减少假信号,从而提高信号准确率。
多个条件组合,捕捉趋势开始。策略所设定的TMO指标信号、AMA指标极值和K线实体量放大等多个条件,可以有效捕捉趋势开始的时机,这是Scalping策略追求的目标。
K线止损方式控制风险。采用K线最近最高价最低价作为止损方式,可以比较好地控制每单的风险。同时也不会因指标重新计算产生的滞后反转风险。
简洁有效的交易逻辑。该策略只用了两个指标就实现了比较完整的Scalping策略,不算复杂,逻辑简洁清晰。而且从示例结果来看,策略实现了不错的盈利。
策略风险
该策略主要存在以下风险:
频繁出入场风险。作为Scalping策略,它的持仓时间不长,如果交易费用较高,会对盈利造成一定影响。
K线止损过于激进风险。采用最近最高价最低价作为止损方式,可能会比较激进,无法完全过滤市场噪音,增加了止损被触发的概率。
参数优化困难风险。策略涉及多个参数,想找到最佳参数组合可能会比较困难。
优化方向
该策略还可以从以下几个方向进行优化:
添加更多过滤指标,如市场成交量,可以过滤掉一些假信号,进一步提高信号质量。
尝试在止损方式上增加过滤条件,避免止损过于激进。例如在触发止损前等待若干根K线确认,再止损。
进行参数优化,找到指标参数的最佳组合。这可能可以过滤更多噪音,提高策略胜率。主要优化TMO指标长度、AMA指标长度和倍数等参数。
尝试在不同品种和时间周期上进行回测和实盘,找到最匹配该策略逻辑的交易品种和周期。
总结
该策略通过组合TMO指标和AMA指标的交易信号,在震荡行情中寻找趋势开始的时机进行Scalping操盘。它具有信号准确率高、捕捉趋势早期且控制风险的优势。在进行进一步的参数和规则优化后,该策略可以成为具有很强实战价值的日内Scalping策略。
/*backtest
start: 2023-11-23 00:00:00
end: 2023-11-30 00:00:00
period: 10m
basePeriod: 1m
exchanges: [{"eid":"Futures_Binance","currency":"BTC_USDT"}]
*/

// This source code is subject to the terms of the Mozilla Public License 2.0 at https://mozilla.org/MPL/2.0/
// © Kaspricci

//@version=5
strategy("TradeIQ - Crazy Scalping Trading Strategy [Kaspricci]", overlay=true, initial_capital = 1000, currency = currency.USD)

headlineTMO = "TMO Settings"

tmoLength   = input.int(7, "TMO Length", minval = 1, group = headlineTMO)
tmoSource   = input.source(close, "TMO Source", group = headlineTMO)

// calculate values
osc         = ta.mom(ta.sma(ta.sma(tmoSource, tmoLength), tmoLength), tmoLength)

// determine color of historgram
oscColor    = osc > osc[1] and osc > 0 ? #00c42b : osc < osc[1] and osc > 0 ? #4ee567 : osc < osc[1] and osc < 0 ? #ff441f : osc > osc[1] and osc < 0 ? #c03920 : na

// plot histogram
//plot(osc, "OSC", oscColor, linewidth = 3, style = plot.style_histogram)

// conditon to find highs and lows
up          = ta.highest(tmoSource, tmoLength)
dn          = ta.lowest(tmoSource, tmoLength)

// define conditions to be used for finding divergence
phosc = ta.crossunder(ta.change(osc), 0)
plosc = ta.crossover (ta.change(osc), 0)

// test for divergence
bear = osc > 0 and phosc and ta.valuewhen(phosc,osc,0) < ta.valuewhen(phosc,osc,1) and ta.valuewhen(phosc,up,0) > ta.valuewhen(phosc,up,1) ? 1 : 0
bull = osc < 0 and plosc and ta.valuewhen(plosc,osc,0) > ta.valuewhen(plosc,osc,1) and ta.valuewhen(plosc,dn,0) < ta.valuewhen(plosc,dn,1) ? 1 : 0

// -------------------------------------------------------------------------------------------------------------

headlineAMA = "AMA Settings"

amaSource   = input.source(defval = close, title = "AMA Source", group = headlineAMA)
amaLength   = input.int(defval = 50, title = "AMA Length", minval = 2, group = headlineAMA)


amaMulti    = input.float(defval = 2.0, title = "Factor", minval = 1)

amaShowCd   = input(defval = true , title = "As Smoothed Candles")
amaShowEx   = input(defval = true,   title = "Show Alternating Extremities")

amaAlpha    = input.float(1.0, "Lag",       minval=0, step=.1, tooltip='Control the lag of the moving average (higher = more lag)', group= 'AMA Kernel Parameters')
amaBeta     = input.float(0.5, "Overshoot", minval=0, step=.1, tooltip='Control the overshoot amplitude of the moving average (higher = overshoots with an higher amplitude)', group='AMA Kernel Parameters')

// -------------------------------------------------------------------------------------------------------------

headlineSL = "Stop Loss Settings"

slLength    = input.int(defval = 10, title = "SL Period", minval = 1, group = headlineSL, tooltip = "Number of bars for swing high / low")

// -------------------------------------------------------------------------------------------------------------

var b       = array.new_float(0)
var float x = na

if barstate.isfirst
    for i = 0 to amaLength - 1
        x := i / (amaLength - 1)
        w = math.sin(2 * 3.14159 * math.pow(x, amaAlpha)) * (1 - math.pow(x, amaBeta))
        array.push(b, w)

// local function to filter the source
filter(series float x) =>
    sum = 0.

    for i = 0 to amaLength - 1
        sum := sum + x[i] * array.get(b,i)

    sum / array.sum(b)

// apply filter function on source series

srcFiltered = filter(amaSource)

deviation   = ta.sma(math.abs(amaSource - srcFiltered), amaLength) * amaMulti

upper       = srcFiltered + deviation
lower       = srcFiltered - deviation

//----
crossHigh   = ta.cross(high, upper)
crossLow    = ta.cross(low, lower)

var os      = 0
os          := crossHigh ? 1 : crossLow ? 0 : os[1]

ext         = os * upper + (1 - os) * lower

//----
os_css = ta.rsi(srcFiltered, amaLength) / 100

extColor    = os == 1 ? #30FF85 : #ff1100

plot(srcFiltered, "MA", amaShowCd ? na : color.black, 2, editable = false)
plot(amaShowEx ? ext : na, "Extremities", ta.change(os) ? na : extColor, 2, editable=false)

// handle smoothed candles
var float h = na
var float l = na
var float c = na
var float body = na

if amaShowCd
    h := filter(high)
    l := filter(low)
    c := filter(amaSource)
    body := math.abs(math.avg(c[1], c[2]) - c)

ohlc_os = ta.rsi(c, amaLength) / 100

plotcandle(math.avg(c[1], c[2]), h, l, c, "Smooth Candles", #434651, bordercolor = na, editable = false, display = amaShowCd ? display.all : display.none)

// -------------------------------------------------------------------------------------------------------------

plotshape(bull ? ext : na, "Bullish Circle", shape.circle,    location.absolute, color = #00c42b, size=size.tiny)
plotshape(bear ? ext : na, "Bearish Circle", shape.circle,    location.absolute, color = #ff441f, size=size.tiny)
plotshape(bull ? ext : na, "Bullish Label",  shape.labeldown, location.absolute, color = #00c42b, text="Buy", textcolor=color.white, size=size.tiny)
plotshape(bear ? ext : na, "Bearish Label",  shape.labelup,   location.absolute, color = #ff441f, text="Sell", textcolor=color.white, size=size.tiny)

// -------------------------------------------------------------------------------------------------------------

candleSizeIncreasing = body[2] < body[1] and body[1] < body[0]

longEntryCond   = os == 1 and bull
shortEntryCond  = os == 0 and bear

longEntry       = strategy.opentrades == 0 and candleSizeIncreasing and not candleSizeIncreasing[1] and ta.barssince(longEntryCond)  < ta.barssince(os == 0) and ta.barssince(longEntryCond) < ta.barssince(bear)
shortEntry      = strategy.opentrades == 0 and candleSizeIncreasing and not candleSizeIncreasing[1] and ta.barssince(shortEntryCond) < ta.barssince(os == 1) and ta.barssince(shortEntryCond) < ta.barssince(bull)

longExit        = strategy.opentrades > 0 and strategy.position_size > 0 and (bear or os == 0)
shortExit       = strategy.opentrades > 0 and strategy.position_size < 0 and (bull or os == 1)

recentSwingHigh = ta.highest(high, slLength) // highest high of last candles
recentSwingLow  = ta.lowest(low,   slLength) // lowest low of recent candles

bgcolor(longEntry  ? color.rgb(76, 175, 79, 90) : na)
bgcolor(shortEntry ? color.rgb(255, 82, 82, 90) : na)

slLong          = (close - recentSwingLow) / syminfo.mintick  // stop loss in ticks
slShort         = (recentSwingHigh - close) / syminfo.mintick // stop loss in ticks

newOrderID         = str.tostring(strategy.closedtrades + strategy.opentrades + 1)
curOrderID         = str.tostring(strategy.closedtrades + strategy.opentrades)

alertMessageForEntry = "Trade {0} - New {1} Entry at price: {2} with stop loss at: {3}"

if (longEntry)
    alertMessage = str.format(alertMessageForEntry, newOrderID, "Long", close, recentSwingLow)

    strategy.entry(newOrderID, strategy.long, alert_message = alertMessage)
    strategy.exit("Stop Loss Long", newOrderID, loss = slLong, alert_message = "Stop Loss for Trade " + newOrderID)

if(longExit)
    strategy.close(curOrderID, alert_message = "Close Trade " + curOrderID)

if (shortEntry)
    alertMessage = str.format(alertMessageForEntry, newOrderID, "Short", close, recentSwingLow)

    strategy.entry(newOrderID, strategy.short, alert_message = alertMessage)
    strategy.exit("Stop Loss Short", newOrderID, loss = slShort, alert_message = "Stop Loss for Trade " + newOrderID)

if(shortExit)
    strategy.close(curOrderID, alert_message = "Close Trade " + curOrderID)