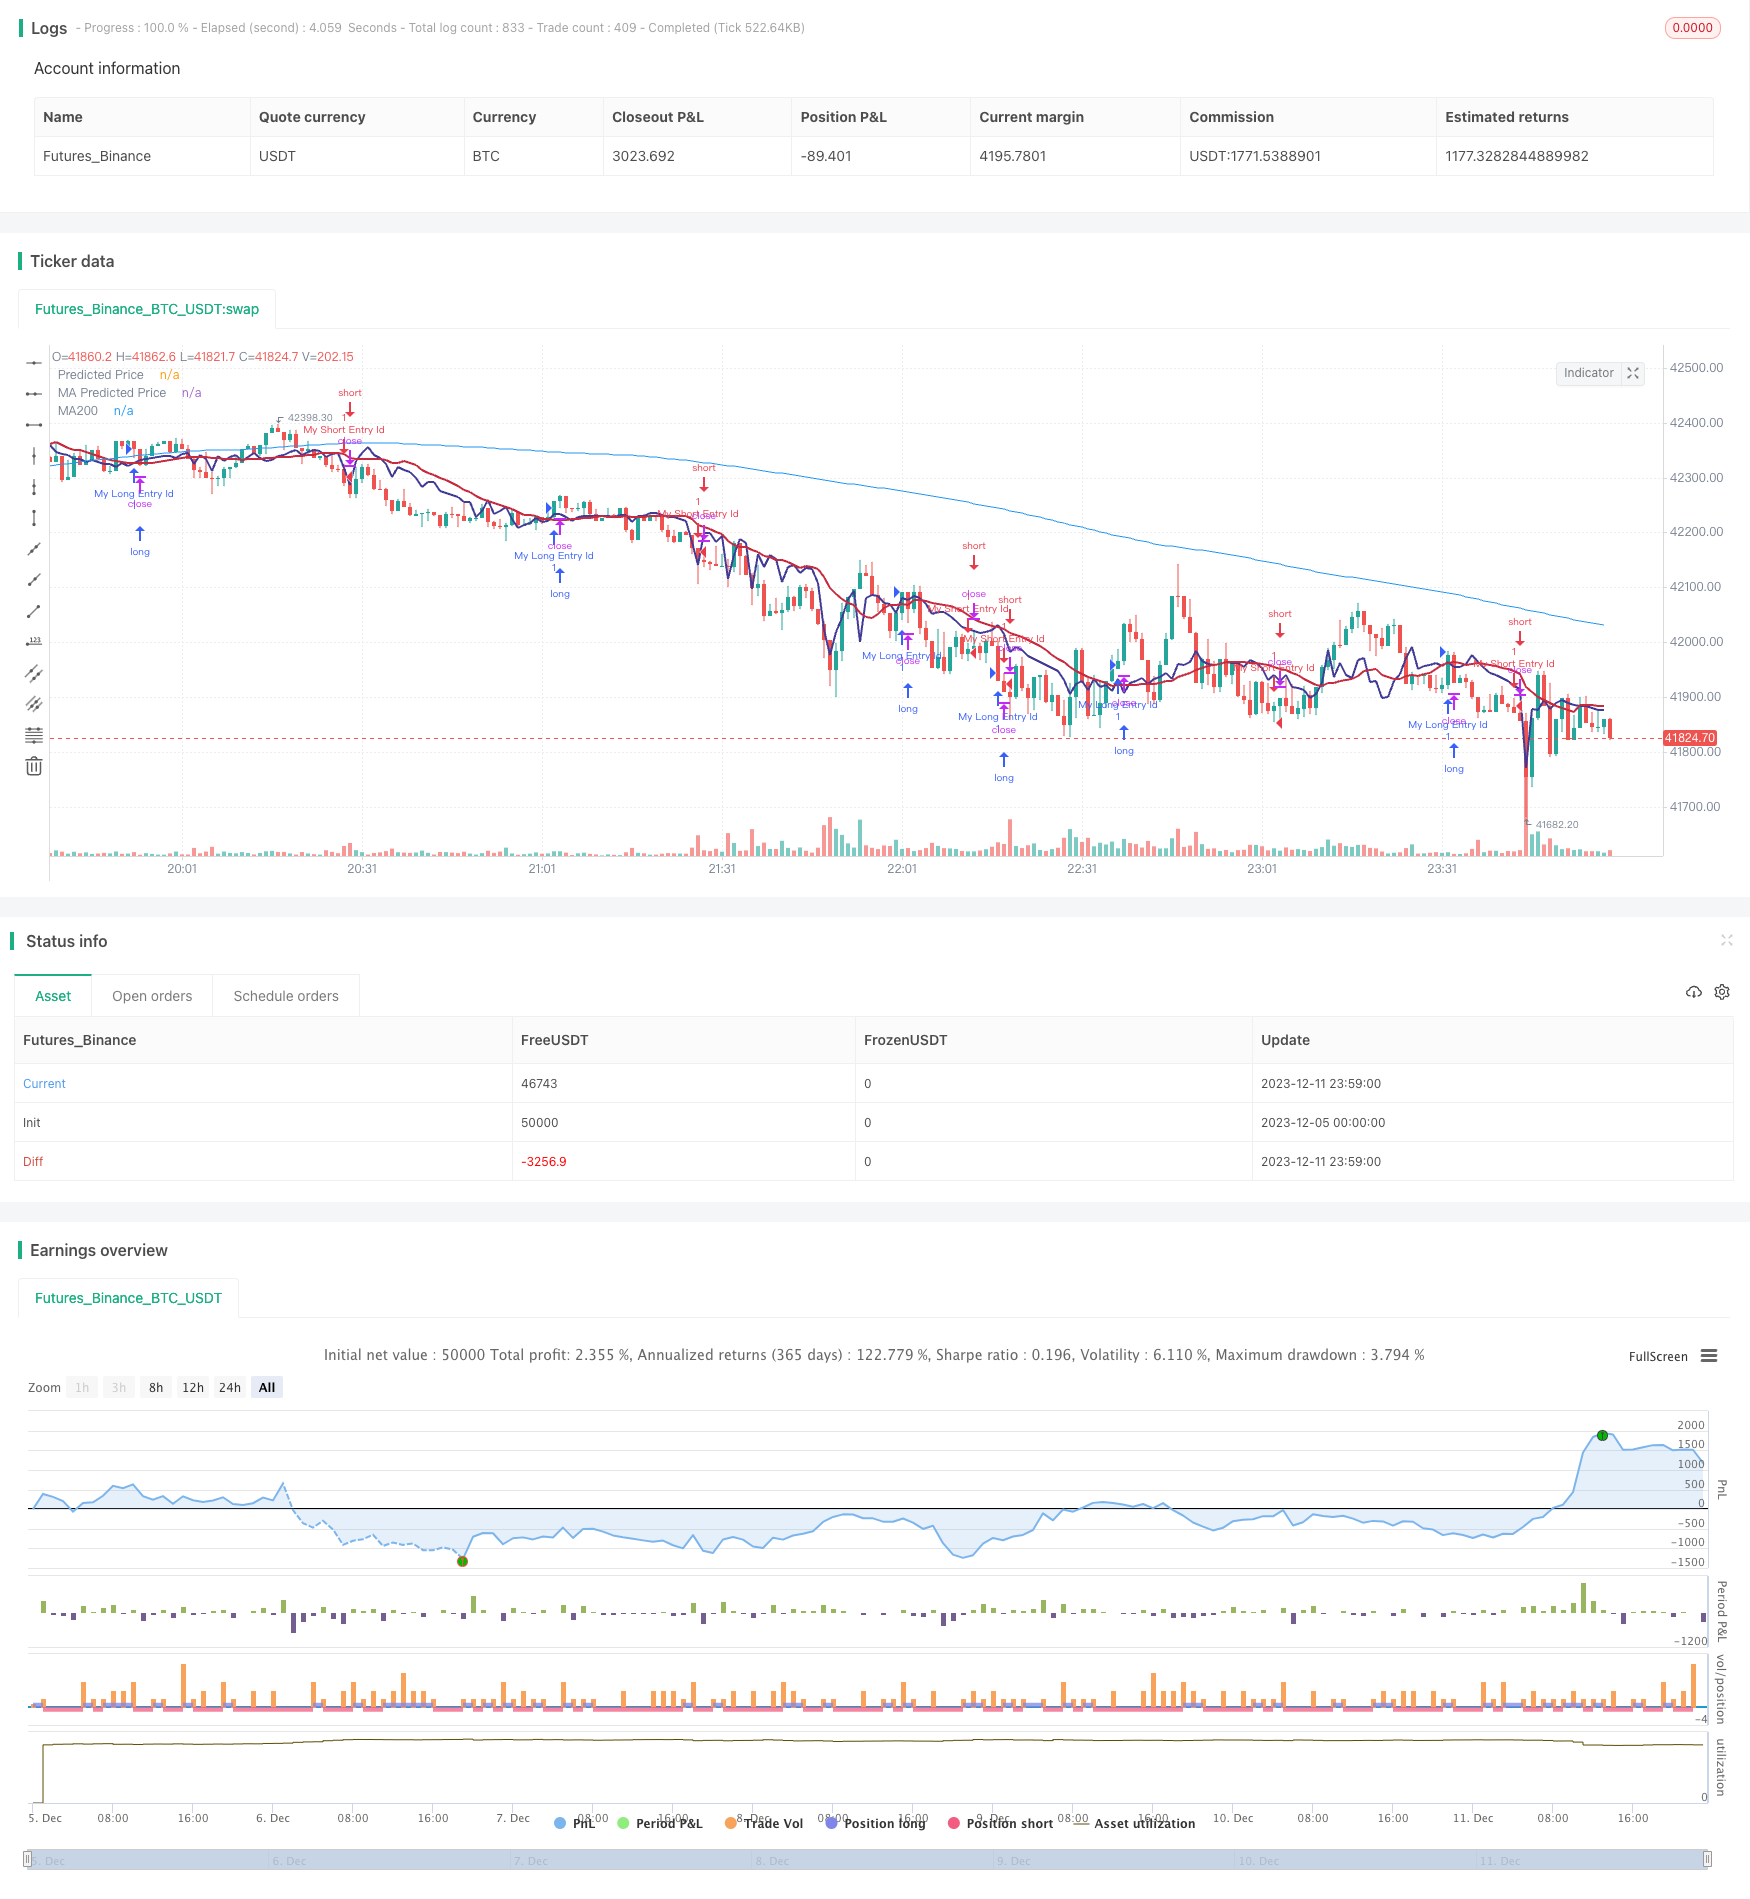
Dynamische ideologische Trendumkehrstrategie

Überblick
Die dynamische Ideologie Trendwende-Strategie nutzt die lineare Regression der prognostizierten Preise und kombiniert mit der Ideologie, die den Moving Average bildet, um Handelssignale zu erzeugen. Es erzeugt ein Kaufsignal, wenn der prognostizierte Preis den Moving Average von unten nach oben durchquert. Es erzeugt ein Verkaufsignal, wenn der prognostizierte Preis den Moving Average von oben nach unten durchquert.
Strategieprinzip
- Lineare Regression des Aktienpreises berechnet auf Basis des Transaktionsvolumens und erhält die Prognose des Preises
- Berechnung eines Moving Averages unter verschiedenen Bedingungen
- Wenn der prognostizierte Preis den Moving Average von unten nach oben durchquert, wird ein Kaufsignal erzeugt.
- Wenn der prognostizierte Preis den Moving Average von oben nach unten durchquert, wird ein Verkaufssignal erzeugt.
- Der MACD-Konjunktor beurteilt die Zeit für eine Trendwende
Die oben genannten Signale kombinieren mehrere Confirmations, um falsche Durchbrüche zu vermeiden und so die Genauigkeit der Signale zu verbessern.
Analyse der Stärken
- Lineare Regression zur Vorhersage von Preistrends und zur Verbesserung der Signalgenauigkeit
- Die Ideologie des Moving Averages und die Umkehrung des Trends
- Lineare Regression auf Basis von Transaktionsvolumen ist wirtschaftlicher
- Multiple-Confirmation in Verbindung mit MACD und anderen Indikatoren, um falsche Signale zu reduzieren
Risikoanalyse
- Die Einstellung der Parameter für die lineare Regression hat einen großen Einfluss auf die Ergebnisse
- Die Einstellung des Moving Averages beeinflusst auch die Signalqualität
- Es besteht die Gefahr von Falschmeldungen, obwohl es Bestätigungsmechanismen gibt.
- Der Code kann weiter optimiert werden, um die Anzahl der Transaktionen zu reduzieren und die Gewinnquote zu erhöhen.
Optimierungsrichtung
- Parameter zur Optimierung von Linearregression und Moving Averages
- Erhöhung der Bestätigungsbedingungen und Verringerung der Falschmeldungen
- Mehr Faktoren, um die Qualität zu beurteilen
- Optimierung von Stop-Loss-Strategien und Verringerung des Einmal-Handelsrisikos
Zusammenfassen
Dynamische Ideologie Trendwende-Strategie Ideologie, die lineare Regression-Vorhersagen und die Bildung von Moving Averages integriert, um den Zeitpunkt der Trendwende zu erfassen. Im Vergleich zu einem einzelnen Indikator hat die Strategie eine höhere Zuverlässigkeit. Gleichzeitig kann die Strategie die Signalqualität und den Gewinn durch Parameteranpassung und Optimierung der Bestätigungsbedingungen weiter verbessern.
/*backtest
start: 2023-12-05 00:00:00
end: 2023-12-12 00:00:00
period: 1m
basePeriod: 1m
exchanges: [{"eid":"Futures_Binance","currency":"BTC_USDT"}]
*/

// This source code is subject to the terms of the Mozilla Public License 2.0 at https://mozilla.org/MPL/2.0/
// © stocktechbot
//@version=5
strategy("Linear Cross", overlay=true, margin_long=100, margin_short=0)

//Linear Regression

vol = volume

// Function to calculate linear regression
linregs(y, x, len) =>
    ybar = math.sum(y, len)/len
    xbar = math.sum(x, len)/len
    b = math.sum((x - xbar)*(y - ybar),len)/math.sum((x - xbar)*(x - xbar),len)
    a = ybar - b*xbar
    [a, b]

// Historical stock price data
price = close

// Length of linear regression
len = input(defval = 21, title = 'Strategy Length')
linearlen=input(defval = 9, title = 'Linear Lookback')
[a, b] = linregs(price, vol, len)

// Calculate linear regression for stock price based on volume
//eps = request.earnings(syminfo.ticker, earnings.actual)
//MA For double confirmation

out = ta.sma(close, 200)
outf = ta.sma(close, 50)
outn = ta.sma(close, 90)
outt = ta.sma(close, 21)
outthree = ta.sma(close, 9)

// Predicted stock price based on volume
predicted_price = a + b*vol

// Check if predicted price is between open and close
is_between = open < predicted_price and predicted_price < close

//MACD
//[macdLine, signalLine, histLine] = ta.macd(close, 12, 26, 9)

// Plot predicted stock price
plot(predicted_price, color=color.rgb(65, 59, 150), linewidth=2, title="Predicted Price")
plot(ta.sma(predicted_price,linearlen), color=color.rgb(199, 43, 64), linewidth=2, title="MA Predicted Price")
//offset = input.int(title="Offset", defval=0, minval=-500, maxval=500)
plot(out, color=color.blue, title="MA200")
[macdLine, signalLine, histLine] = ta.macd(predicted_price, 12, 26, 9)

//BUY Signal

longCondition=false
mafentry =ta.sma(close, 50) > ta.sma(close, 90)
//matentry = ta.sma(close, 21) > ta.sma(close, 50)
matwohun = close > ta.sma(close, 200)
twohunraise = ta.rising(out, 2)
twentyrise = ta.rising(outt, 2)
macdrise = ta.rising(macdLine,2)
macdlong = ta.crossover(predicted_price, ta.wma(predicted_price,linearlen))  and (signalLine < macdLine)
if macdlong and macdrise
    longCondition := true

if (longCondition)
    strategy.entry("My Long Entry Id", strategy.long)
//Sell Signal
lastEntryPrice = strategy.opentrades.entry_price(strategy.opentrades - 1)
daysSinceEntry = len
daysSinceEntry := int((time - strategy.opentrades.entry_time(strategy.opentrades - 1)) / (24 * 60 * 60 * 1000))
percentageChange = (close - lastEntryPrice) / lastEntryPrice * 100
//trailChange = (ta.highest(close,daysSinceEntry) - close) / close * 100

//label.new(bar_index, high, color=color.black, textcolor=color.white,text=str.tostring(int(trailChange)))
shortCondition=false
mafexit =ta.sma(close, 50) < ta.sma(close, 90)
matexit = ta.sma(close, 21) < ta.sma(close, 50)
matwohund = close < ta.sma(close, 200)
twohunfall = ta.falling(out, 3)
twentyfall = ta.falling(outt, 2)
shortmafall = ta.falling(outthree, 1)
macdfall = ta.falling(macdLine,1)
macdsell = macdLine < signalLine
if macdfall and macdsell and (macdLine < signalLine) and ta.falling(low,2)
    shortCondition := true

if (shortCondition)
    strategy.entry("My Short Entry Id", strategy.short)