概述
该策略运用坎夫曼自适应移动平均线(KAMA)来判断趋势方向,以捕捉中长线趋势为主。当KAMA线上涨时做多,当KAMA线下跌时做空。该策略融合了移动平均线的趋势跟踪功能和坎夫曼自适应平均线的动态调整特性,旨在提高交易信号的质量。
策略原理
该策略的核心指标是坎夫曼自适应移动平均线(KAMA)。KAMA根据市场波动度的大小来动态调整自己的加权因子,从而提高曲线的灵敏度。具体来说,当市场波动加大时,KAMA的曲线变得更加平滑;当市场波动减小时,KAMA的曲线变得更加灵敏。这样可以过滤掉部分噪音,同时又可以及时捕捉新的趋势转折。
策略首先计算KAMA的值。然后判断KAMA线的多空状态:当close价格上穿KAMA线时产生买入信号;当close价格下穿KAMA线时产生卖出信号。根据这些交易信号开仓做多做空。
优势分析
该策略最大的优势在于利用KAMA指标进行趋势判断。KAMA指标本身就具有很强的趋势跟踪能力,它可以动态调整参数来适应市场状况,从而产生更可靠的交易信号。相比简单移动平均线和指数移动平均线,KAMA指标可以更好地识别趋势,减少虚假信号。
另外,该策略只利用KAMA的多空状态来判断趋势方向。没有设置额外的过滤条件,这简化了策略逻辑,也使参数较少,降低了过度优化的风险,有利于参数稳定性和跨市场适应性。
风险分析
该策略主要风险在于KAMA本身作为滞后指标,交易信号产生时市场趋势可能已经发生反转。这会导致止损风险。另外,KAMA曲线当中也会出现短期的震荡态势,这可能产生一些频繁的错误信号。
为降低风险,可以考虑结合其他指标来确认交易信号,比如波动率指标、成交量指标等。也可以适当调整参数,Identification使KAMA曲线更加平滑。
优化方向
该策略优化空间还很大,主要可以从以下几个方面入手:
结合其他指标进行信号过滤,如MACD、震荡指标等,提高信号质量
增加止损策略,利用移动止损或余额曲线止损来控制单笔损失
优化参数,使KAMA更有效地捕捉趋势
增加多时间周期分析,利用更高时间周期确定大趋势方向
利用机器学习方法自动优化参数,使参数适应不同品种
总结
该策略整体思路清晰,通过KAMA指标判断趋势方向,具有趋势跟踪能力强、逻辑简单、参数较少等优点。但也存在滞后识别趋势反转的风险。可以通过多种方式来优化该策略,使其效果更好,适应性更广。
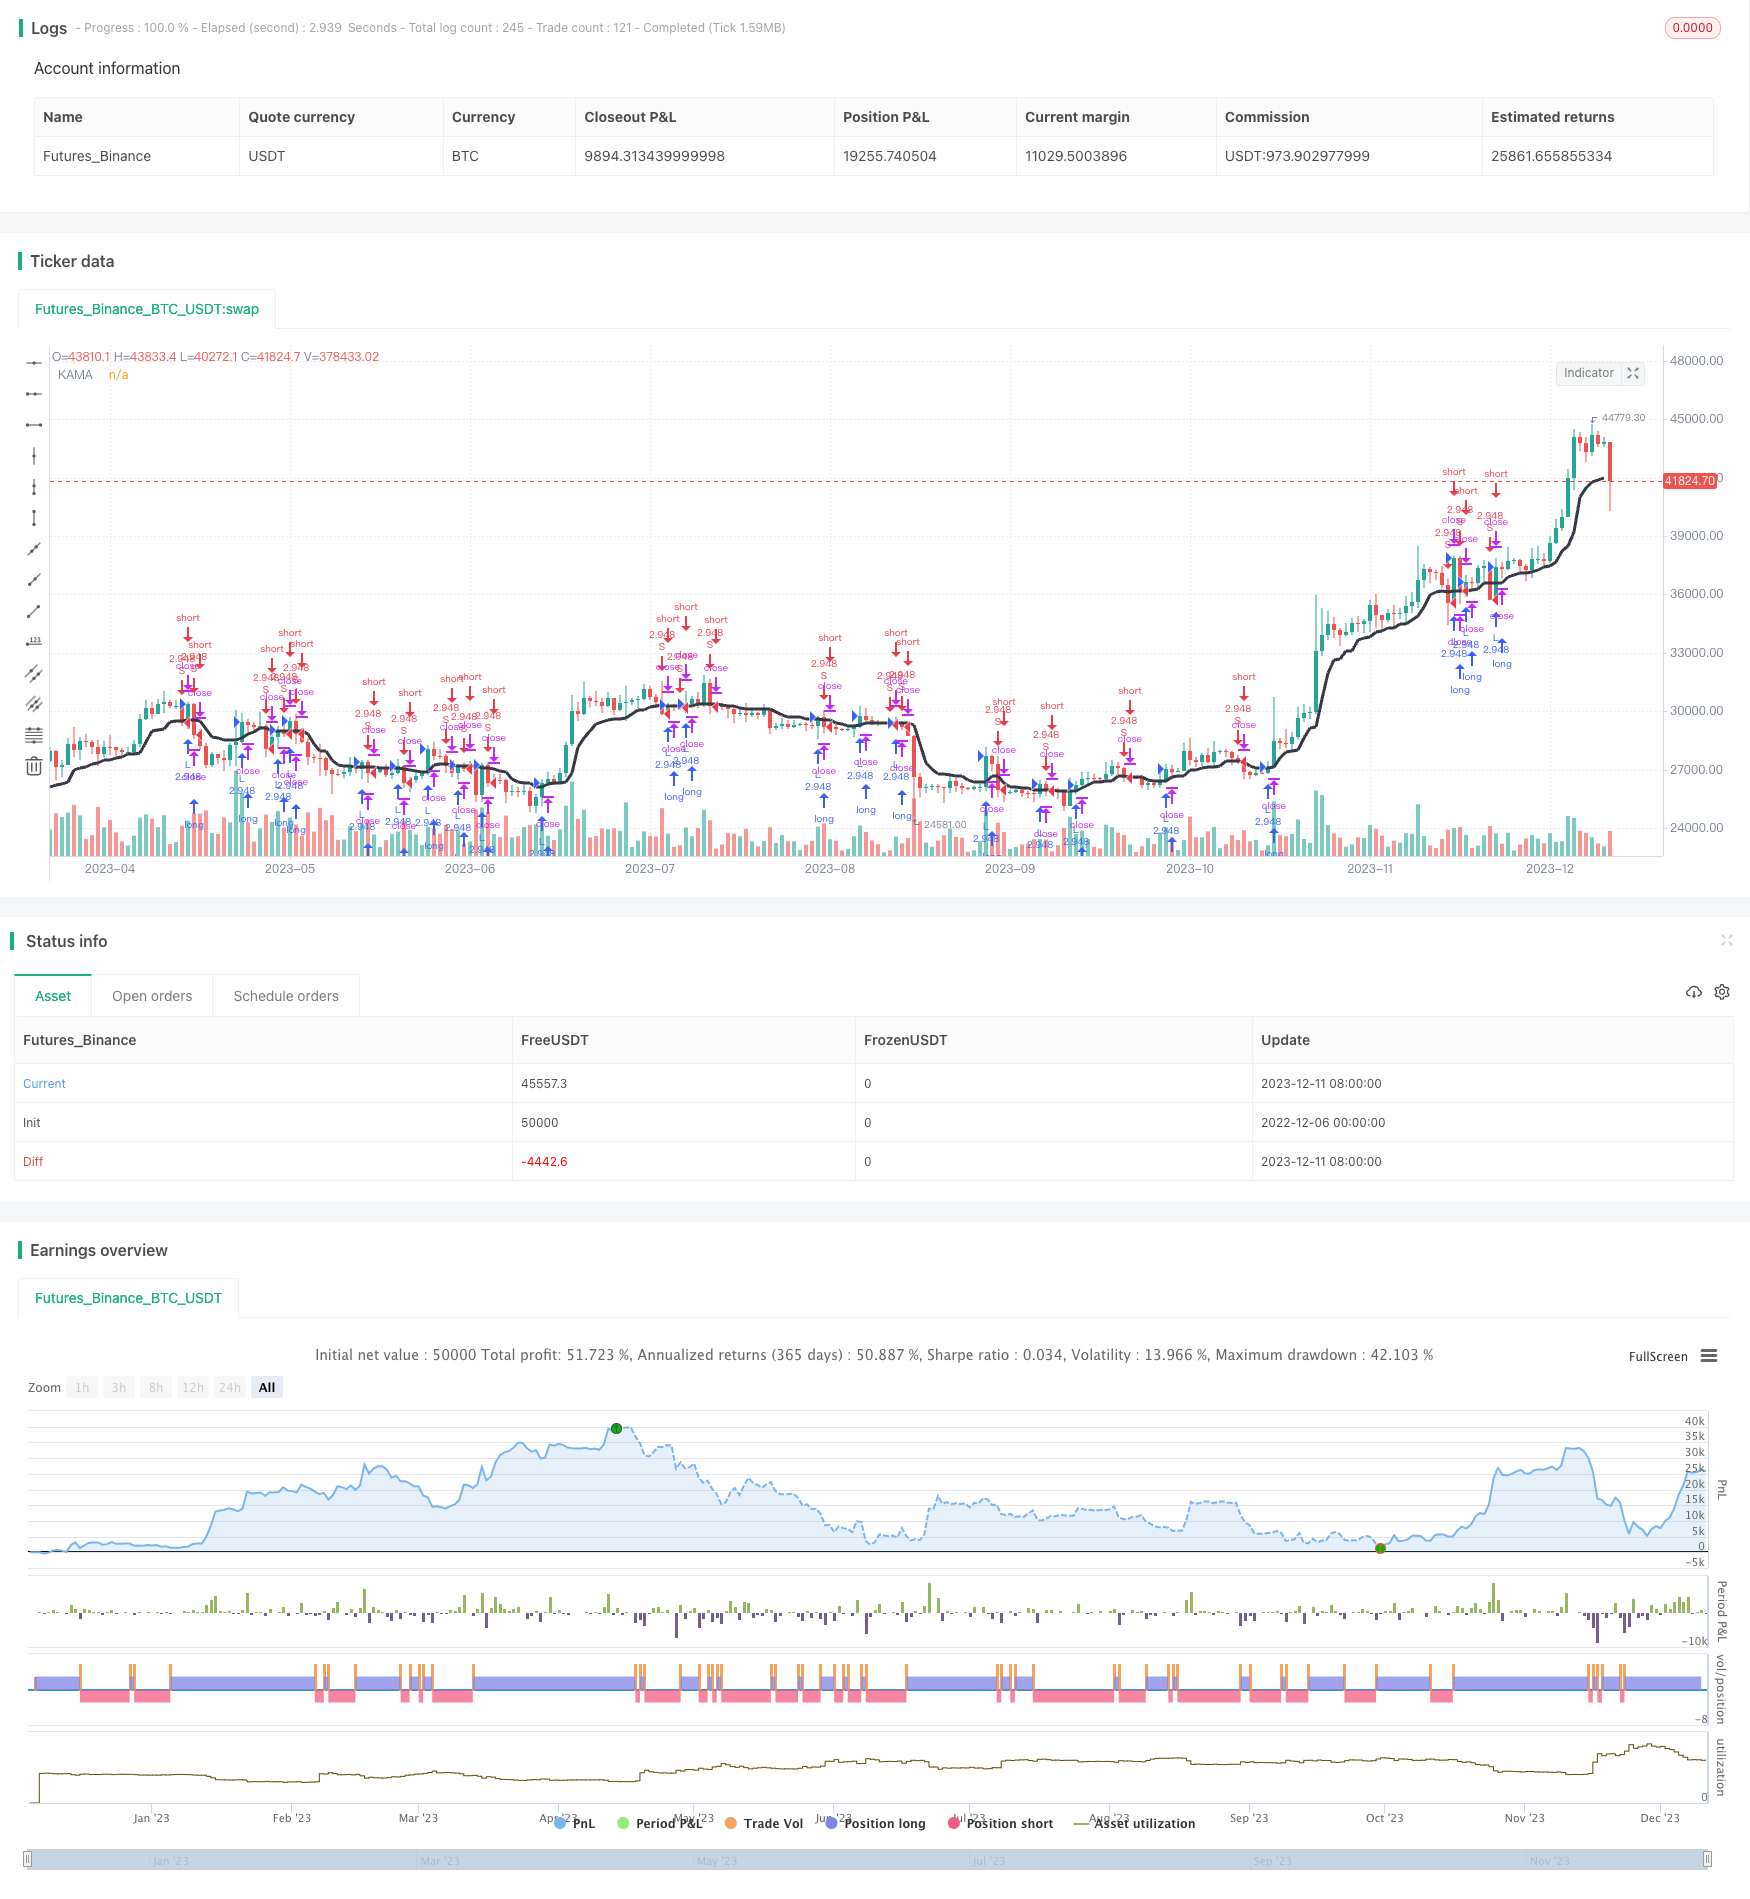
/*backtest
start: 2022-12-06 00:00:00
end: 2023-12-12 00:00:00
period: 1d
basePeriod: 1h
exchanges: [{"eid":"Futures_Binance","currency":"BTC_USDT"}]
*/

//Noro
//2019

//@version=3
strategy(title = "Noro's KAMA Strategy", shorttitle="KAMA str", overlay=true, default_qty_type = strategy.percent_of_equity, default_qty_value = 100, pyramiding = 0)

//Settings
needlong = input(true, defval = true, title = "Long")
needshort = input(true, defval = true, title = "Short")
capital = input(100, defval = 100, minval = 1, maxval = 10000, title = "Lot")
length = input(3, minval = 1)
fast = input(2, minval = 1)
slow = input(30, minval = 1)
src = input(title = "Source",  defval = close)
type = input(defval = "Trend", options = ["Trend", "Crossing"], title = "Type")
fromyear = input(1900, defval = 1900, minval = 1900, maxval = 2100, title = "From Year")
toyear = input(2100, defval = 2100, minval = 1900, maxval = 2100, title = "To Year")
frommonth = input(01, defval = 01, minval = 01, maxval = 12, title = "From Month")
tomonth = input(12, defval = 12, minval = 01, maxval = 12, title = "To Month")
fromday = input(01, defval = 01, minval = 01, maxval = 31, title = "From day")
today = input(31, defval = 31, minval = 01, maxval = 31, title = "To day")

//KAMA
volatility = sum(abs(src-src[1]), length)
change = abs(src[1]-src[length])
er = iff(volatility != 0, change/volatility, 0)
fastSC = 2/(fast+1)
slowSC = 2/(slow+1)
sc = pow((er*(fastSC-slowSC))+slowSC, 2)
bid = hl2
kama = 0.0
kama := nz(kama[1])+(sc*(bid-nz(kama[1])))
plot(kama, color = black, title = "KAMA", trackprice = false, style = line, linewidth = 3)

//Signals
up = false
dn = false
up := (type == "Crossing" and kama > kama[1]) or (type == "Trend" and close > kama)
dn := (type == "Crossing" and kama < kama[1]) or (type == "Trend" and close < kama)

//Trading
size = strategy.position_size
lot = 0.0
lot := size == 0 ? strategy.equity / close * capital / 100 : lot[1]
if up
    strategy.entry("L", strategy.long, needlong ? lot : 0, when = (time > timestamp(fromyear, frommonth, fromday, 00, 00) and time < timestamp(toyear, tomonth, today, 23, 59)))

if dn
    strategy.entry("S", strategy.short, needshort ? lot : 0, when = (time > timestamp(fromyear, frommonth, fromday, 00, 00) and time < timestamp(toyear, tomonth, today, 23, 59)))