概述
该策略运用双波带指标识别盘整区域,配合突破策略实现低买高卖的交易策略。当价格突破中立区时,表明价格开始启动新的趋势,这时入场做多;当价格再次跌破中立区时,表明价格趋势结束,这时平仓。
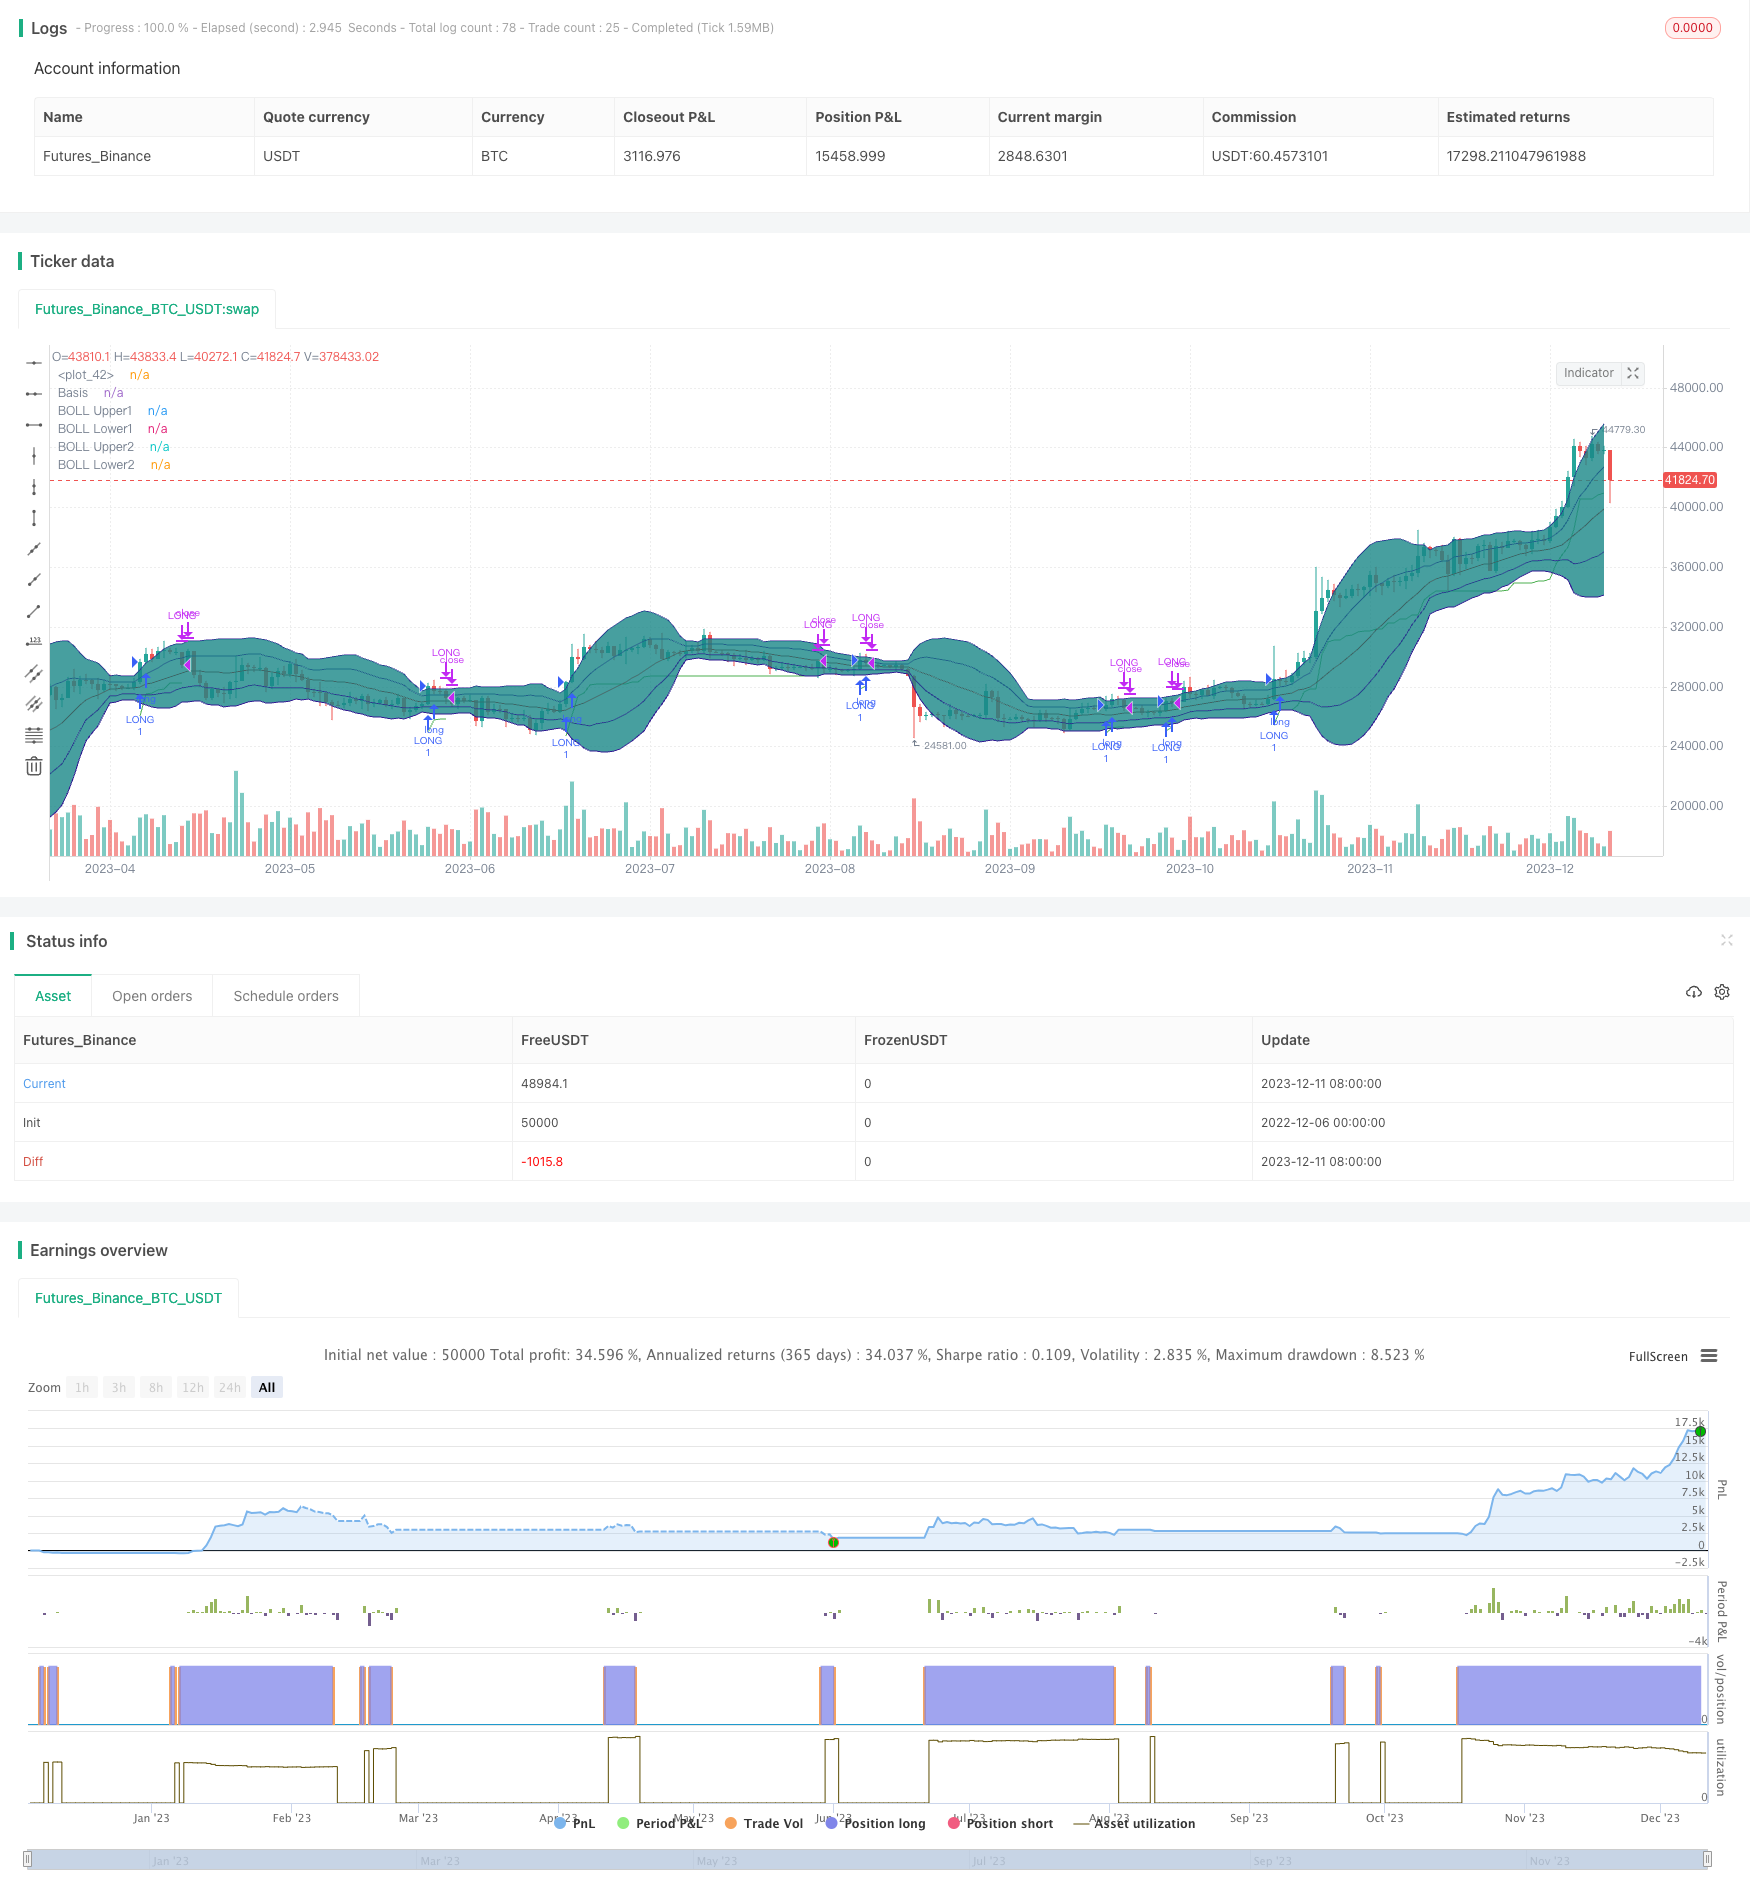
策略原理
该策略使用两个布林带。内层布林带的上下轨为20日简单移动均线±1倍标准差;外层布林带的上下轨为20日简单移动均线±2倍标准差。当价格位于内外布林带之间时,定义为中立区。
当价格连续两个K线都位于中立区时,认为处于盘整;当价格连续两个K线盘整后,第三根K线收盘价超过内布林带上轨时,产生做多信号。
做多后,设置止损线为最低价-2倍ATR,以锁定利润和控制风险;当价格跌破内布林带上轨时,平仓。
优势分析
该策略结合指标和趋势两个因素,能够识别盘整区域并判断价格是否启动新一轮趋势,实现低买高卖,收益空间大。止损策略可以锁定利润和控制风险,使得策略稳定性较高。
风险分析
该策略依赖价格突破布林带上轨形成的做多信号,如果出现假突破,则会形成错单和亏损。此外,止损点过于接近也可能被秒止损。
可以通过优化布林带的参数、增加过滤条件等方法来减少假突破的概率。此外可以适当放宽止损点,确保有足够的空间。
优化方向
- 优化布林带的参数,调整布林带的宽度,降低假突破概率
- 增加其他指标过滤,例如成交量,避免低量的假突破
- 调整止损策略,防止被套和秒止损
- 增加分批建仓策略,降低单笔风险
总结
该策略整合双波带指标和趋势策略,实现低买高卖,收益空间大。同时,止损策略也使得策略较为稳定。通过进一步优化,可以提高策略效果,值得实盘验证。
策略源码
/*backtest
start: 2022-12-06 00:00:00
end: 2023-12-12 00:00:00
period: 1d
basePeriod: 1h
exchanges: [{"eid":"Futures_Binance","currency":"BTC_USDT"}]
*/

// This source code is subject to the terms of the Mozilla Public License 2.0 at https://mozilla.org/MPL/2.0/
// © DojiEmoji

//@version=4
strategy("[KL] Double BB Strategy",overlay=true,pyramiding=1)
ENUM_LONG = "LONG"

// Timeframe {
backtest_timeframe_start = input(defval = timestamp("01 Apr 2020 13:30 +0000"), title = "Backtest Start Time", type = input.time)
USE_ENDTIME = input(false,title="Define backtest end-time (If false, will test up to most recent candle)")
backtest_timeframe_end = input(defval = timestamp("19 Apr 2021 19:30 +0000"), title = "Backtest End Time (if checked above)", type = input.time)
within_timeframe = true
// }

// Bollinger bands
BOLL_length = 20, BOLL_src = close, SMA20 = sma(BOLL_src, BOLL_length)
BOLL_sDEV = stdev(BOLL_src, BOLL_length)
BOLL_upper1 = SMA20 + BOLL_sDEV, BOLL_lower1 = SMA20 - BOLL_sDEV
BOLL_upper2 = SMA20 + BOLL_sDEV*2, BOLL_lower2 = SMA20 - BOLL_sDEV*2
SMA_20_plot = plot(SMA20, "Basis", color=#872323, offset = 0)
BOLL_upper1_plot = plot(BOLL_upper1, "BOLL Upper1", color=color.navy, offset = 0, transp=50)
BOLL_lower1_plot = plot(BOLL_lower1, "BOLL Lower1", color=color.navy, offset = 0, transp=50)
BOLL_upper2_plot = plot(BOLL_upper2, "BOLL Upper2", color=color.navy, offset = 0, transp=50)
BOLL_lower2_plot = plot(BOLL_lower2, "BOLL Lower2", color=color.navy, offset = 0, transp=50)
fill(BOLL_upper2_plot, BOLL_upper1_plot, title = "Background", color=#198787, transp=85)
fill(BOLL_upper1_plot, SMA_20_plot, title = "Background", color=#198787, transp=75)
fill(SMA_20_plot, BOLL_lower1_plot, title = "Background", color=#198787, transp=75)
fill(BOLL_lower1_plot, BOLL_lower2_plot, title = "Background", color=#198787, transp=85)


// Trailing stop loss {
ATR_X2_TSL = atr(input(14,title="Length of ATR for trailing stop loss")) * input(2.0,title="ATR Multiplier for trailing stop loss",type=input.float)
TSL_source = low
var stop_loss_price = float(0)
TSL_line_color = color.green, TSL_transp = 100
if strategy.position_size == 0 or not within_timeframe
    TSL_line_color := color.black
    stop_loss_price := TSL_source - ATR_X2_TSL
else if strategy.position_size > 0
    stop_loss_price := max(stop_loss_price, TSL_source - ATR_X2_TSL)
    TSL_transp := 0
plot(stop_loss_price, color=color.new(TSL_line_color, TSL_transp))
// }

// Signals for entry
is_neutral = close < BOLL_upper1 and close > BOLL_lower2
is_consol = is_neutral and is_neutral[2]
entry_signal = is_consol[1] and close > BOLL_upper1


// MAIN:
if within_timeframe
    // EXIT ::::::::::::::::::::::::::::::::::::::::::::::::::::::::::::::::::::
	exit_msg = close <= strategy.position_avg_price ? "stop loss" : "take profit"
	end_of_rally = close < BOLL_upper1 and strategy.position_avg_price > stop_loss_price	// also detects false breakouts
	if strategy.position_size > 0 and (TSL_source <= stop_loss_price or end_of_rally)
        strategy.close(ENUM_LONG, comment=exit_msg)

    // ENTRY :::::::::::::::::::::::::::::::::::::::::::::::::::::::::::::::::::
    if (strategy.position_size == 0 or (strategy.position_size > 0 and close > stop_loss_price)) and entry_signal
		entry_msg = strategy.position_size > 0 ? "adding" : "initial"
		strategy.entry(ENUM_LONG, strategy.long, comment=entry_msg)

// CLEAN UP:
if strategy.position_size == 0
	stop_loss_price := float(0)