Bollinger-Bänder und Kombinationsstrategie des RSI
Schriftsteller:ChaoZhang, Datum: 2024-01-30 15:15:32Tags:

Übersicht
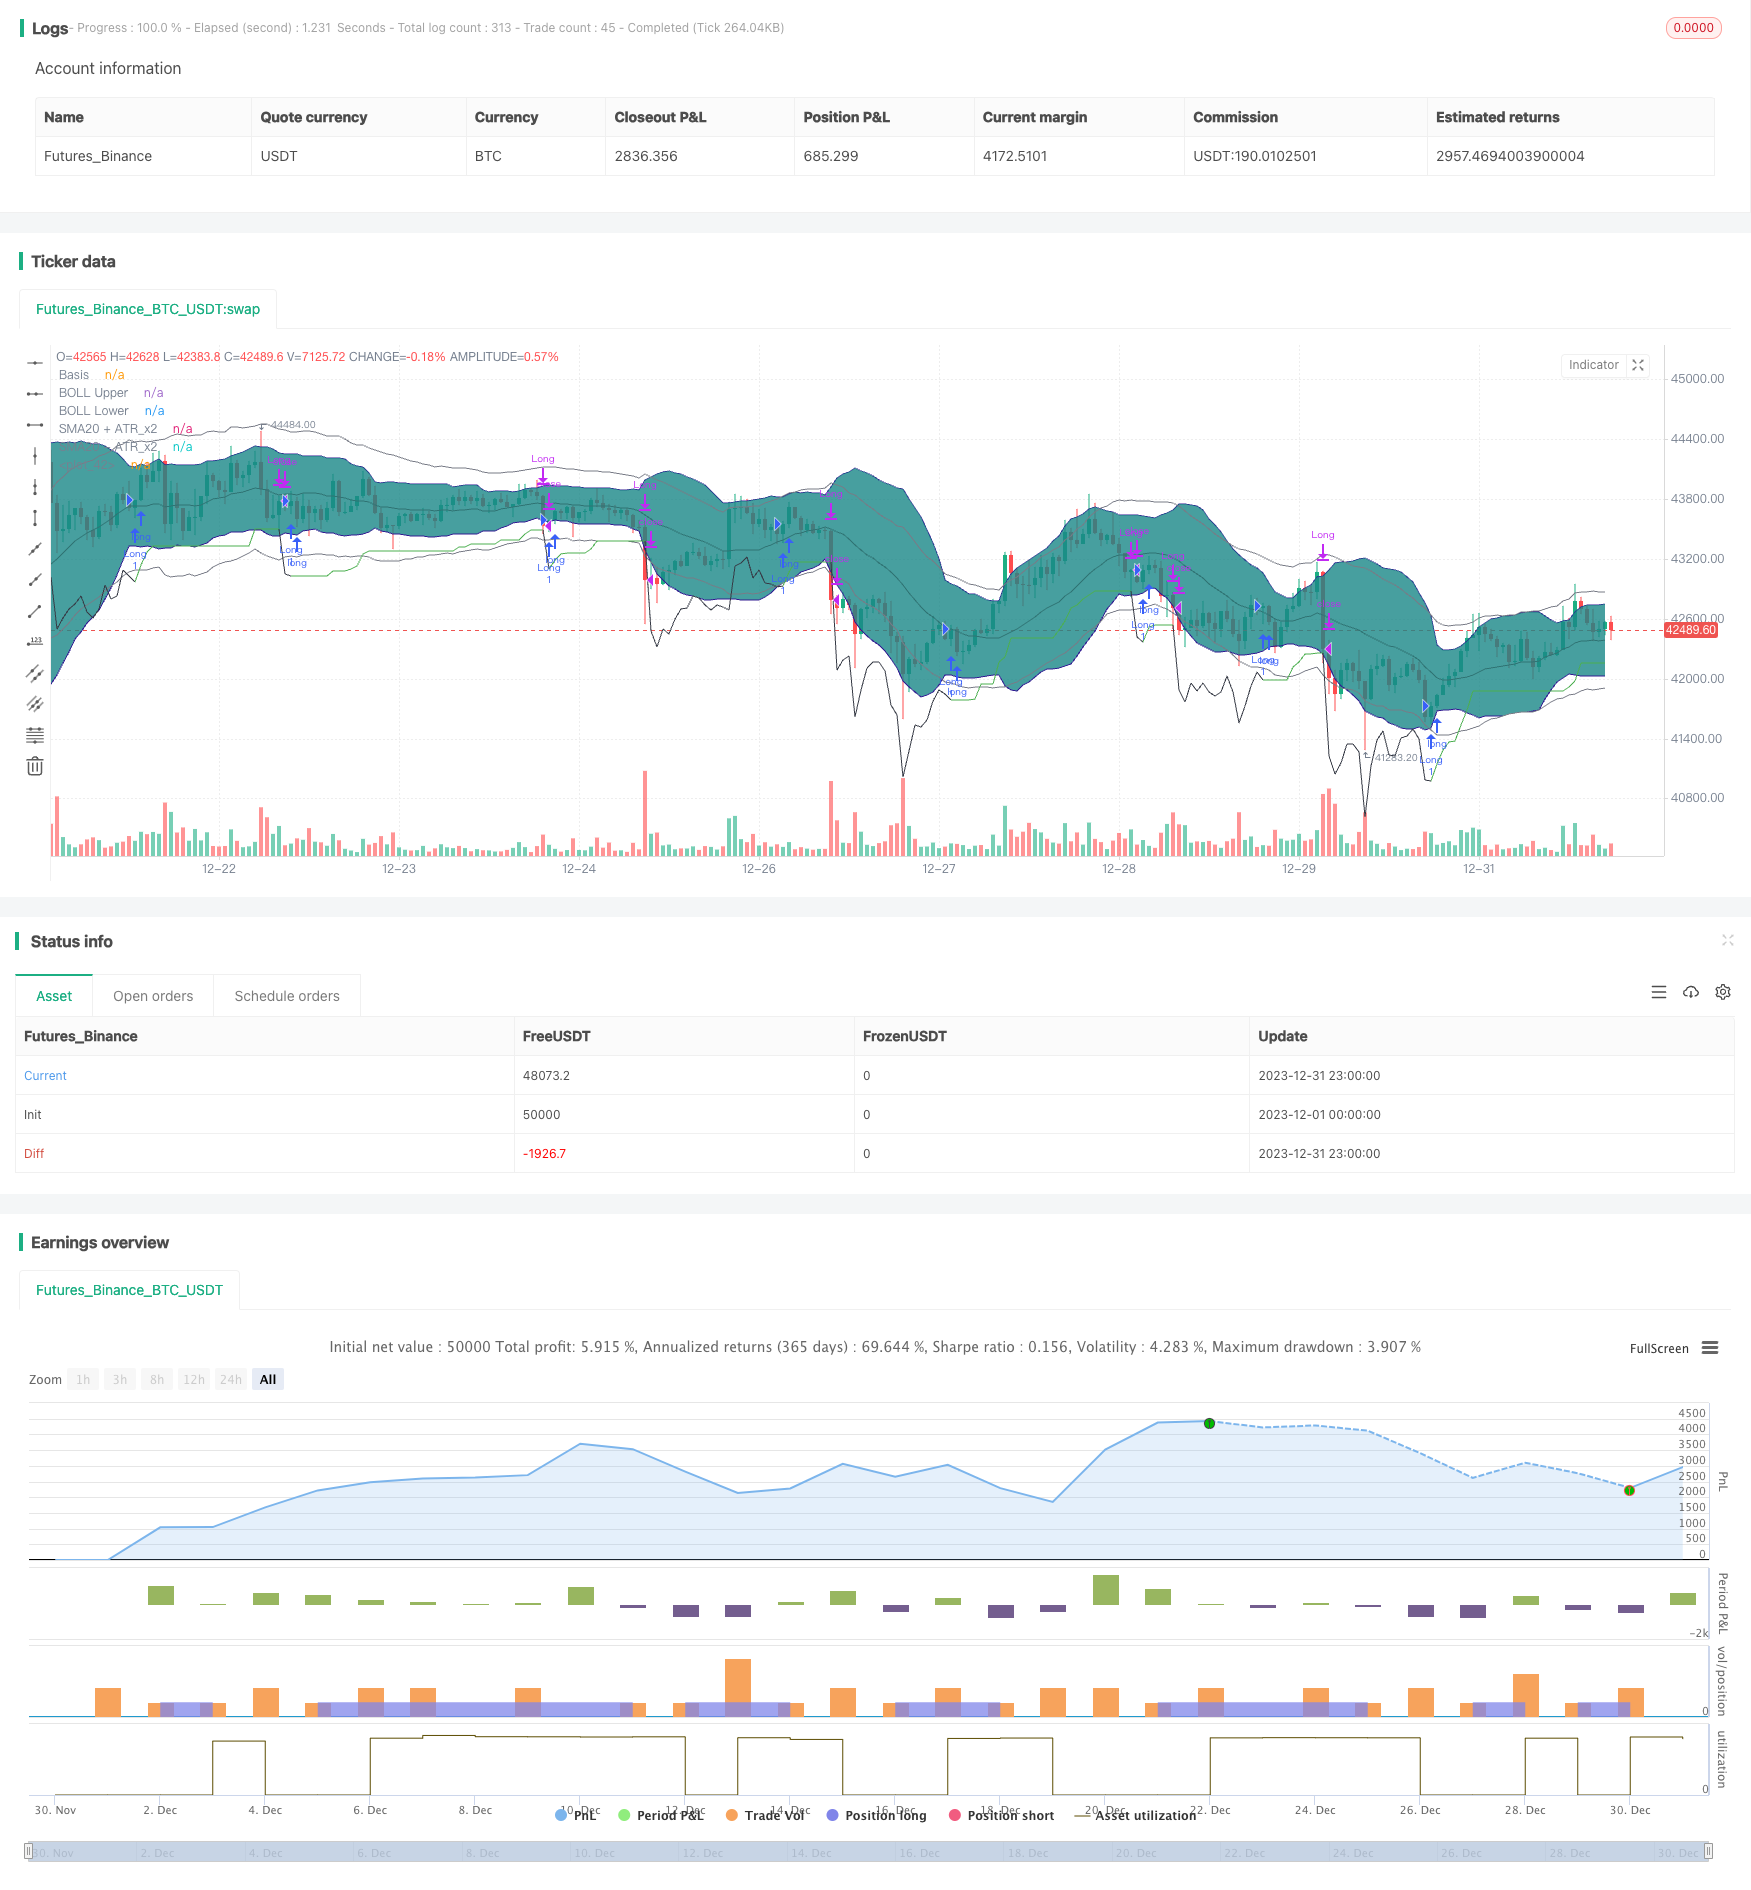
Diese Strategie kombiniert Bollinger Bands und Relative Strength Index (RSI), um Chancen zu identifizieren, wenn Bollinger Bands zusammenquetschen und der RSI steigt, wobei ein Stop-Loss angewendet wird, um Risiken zu kontrollieren.
Strategie Logik
Die Kernlogik dieser Strategie besteht darin, Bollinger-Bands zu identifizieren und den Preis-Ausbruch vorherzusagen, wenn der RSI im Aufwärtstrend ist. Insbesondere, wenn die 20-Perioden-BB-Mittelabweichung kleiner als ATR*2 ist, bestimmen wir, dass der BB-Ausbruch eintritt; In der Zwischenzeit, wenn sowohl der 10- als auch der 14-Perioden-RSI steigt, prognostizieren wir, dass die Preise bald über das obere Band von BB brechen und lang gehen können.
Nach dem Markteintritt verwenden wir ATR Safety Distance + Adaptive Stop Loss, um Gewinn zu erzielen und Risiken zu managen. Positionen werden geschlossen, wenn der Preis einen Stop-Loss erreicht oder der RSI überkauft wird (14-Perioden-RSI über 70 und 10-Perioden-RSI über 14).
Analyse der Vorteile
Der größte Vorteil dieser Strategie besteht darin, die Konsolidierungsperiode mit BB-Squeeze zu identifizieren und die Breakout-Richtung mit RSI vorherzusagen.
Risikoanalyse
Das Hauptrisiko dieser Strategie ist die falsche Identifizierung von BB-Squeeze und RSI-Aufwärtstrend, was zu einem falschen Ausbruch führen kann. Darüber hinaus kann adaptive Stop-Loss möglicherweise nicht in der Lage sein, Positionen rechtzeitig während hoher Volatilität zu schließen. Die Verbesserung von Stop-Loss-Methoden wie Curve Stop-Loss kann dieses Risiko mindern.
Optimierungsrichtlinien
Diese Strategie kann in folgenden Bereichen weiter optimiert werden:
-
Verbessern der BB-Parameter, um die Pressen genauer zu erkennen
-
Versuche verschiedene Werte für RSI-Perioden
-
Überprüfen Sie andere Stop-Loss-Techniken wie Kurve SL oder rückwärts gerichtete SL
-
Anpassung der Parameter anhand der Symbolmerkmale
Schlussfolgerung
Diese Strategie nutzt die Komplementarität von BB und RSI, um eine gute risikobereinigte Rendite zu erzielen.
/*backtest
start: 2023-12-01 00:00:00
end: 2023-12-31 23:59:59
period: 1h
basePeriod: 15m
exchanges: [{"eid":"Futures_Binance","currency":"BTC_USDT"}]
*/

// This source code is subject to the terms of the Mozilla Public License 2.0 at https://mozilla.org/MPL/2.0/
// © DojiEmoji
//

//@version=4
strategy("[KL] BOLL + RSI Strategy",overlay=true,pyramiding=1)

// Timeframe {
backtest_timeframe_start = input(defval = timestamp("01 Apr 2016 13:30 +0000"), title = "Backtest Start Time", type = input.time)
USE_ENDTIME = input(false,title="Define backtest end-time (If false, will test up to most recent candle)")
backtest_timeframe_end = input(defval = timestamp("01 May 2021 19:30 +0000"), title = "Backtest End Time (if checked above)", type = input.time)
within_timeframe = true
// }

// Bollinger bands (sdv=2, len=20) {
BOLL_length = 20, BOLL_src = close, SMA20 = sma(BOLL_src, BOLL_length), BOLL_sDEV_x2 = 2 * stdev(BOLL_src, BOLL_length)
BOLL_upper = SMA20 + BOLL_sDEV_x2, BOLL_lower = SMA20 - BOLL_sDEV_x2
plot(SMA20, "Basis", color=#872323, offset = 0)
BOLL_p1 = plot(BOLL_upper, "BOLL Upper", color=color.navy, offset = 0, transp=50)
BOLL_p2 = plot(BOLL_lower, "BOLL Lower", color=color.navy, offset = 0, transp=50)
fill(BOLL_p1, BOLL_p2, title = "Background", color=#198787, transp=85)
// }

// Volatility Indicators {
ATR_x2 = atr(BOLL_length) * 2 // multiplier aligns with BOLL
avg_atr = sma(ATR_x2, input(1,title="No. of candles to lookback when determining ATR is decreasing"))
plot(SMA20+ATR_x2, "SMA20 + ATR_x2", color=color.gray, offset = 0, transp=50)
plot(SMA20-ATR_x2, "SMA20 - ATR_x2", color=color.gray, offset = 0, transp=50)
plotchar(ATR_x2, "ATR_x2", "", location = location.bottom)
//}

// Trailing stop loss {
TSL_source = low
var entry_price = float(0), var stop_loss_price = float(0)

trail_profit_line_color = color.green
if strategy.position_size == 0 or not within_timeframe
    trail_profit_line_color := color.black
    stop_loss_price := TSL_source - ATR_x2
else if strategy.position_size > 0
    stop_loss_price := max(stop_loss_price, TSL_source - ATR_x2)
plot(stop_loss_price, color=trail_profit_line_color)

if strategy.position_size > 0 and stop_loss_price > stop_loss_price[1]
	alert("Stop loss limit raised", alert.freq_once_per_bar)

// } end of Trailing stop loss

//Buy setup - Long positions {
is_squeezing = ATR_x2 > BOLL_sDEV_x2
if is_squeezing and within_timeframe and not is_squeezing[1]
	alert("BOLL bands are squeezing", alert.freq_once_per_bar)
else if not is_squeezing and within_timeframe and is_squeezing[1]
	alert("BOLL bands stopped squeezing", alert.freq_once_per_bar)

ema_trend = ema(close, 20)

concat(a, b) =>
	concat = a
	if a != ""
		concat := concat + ", "
	concat := concat + b
	concat
// }

// Sell setup - Long position {
rsi_10 = rsi(close, 10), rsi_14 = rsi(close, 14)
overbought = rsi_14 > input(70,title="[Exit] RSI(14) value considered as overbought") and rsi_10 > rsi_14
// } end of Sell setup - Long position

// MAIN: {
if within_timeframe
	entry_msg = ""
	exit_msg = ""

    // ENTRY {
	conf_count = 0
    volat_decr = avg_atr <= avg_atr[1]
	rsi_upslope = rsi_10 > rsi_10[1] and rsi_14 > rsi_14[1]

	if volat_decr and rsi_upslope and is_squeezing and strategy.position_size == 0
		strategy.entry("Long",strategy.long, comment=entry_msg)
		entry_price := close
		stop_loss_price := TSL_source - ATR_x2
	// }

    // EXIT	{
	if strategy.position_size > 0
		bExit = false
		if close <= entry_price and TSL_source <= stop_loss_price
            exit_msg := concat(exit_msg, "stop loss [TSL]")
			bExit := true
        else if close > entry_price and TSL_source <= stop_loss_price
            exit_msg := concat(exit_msg, "take profit [TSL]")
            bExit := true
		else if overbought
			exit_msg := concat(exit_msg, "overbought")
			bExit := true

        strategy.close("Long", when=bExit, comment=exit_msg)
	// }
// }

// CLEAN UP:
if strategy.position_size == 0 and not is_squeezing
	entry_price := 0
	stop_loss_price := float(0)
- 5-minütige Handelsstrategie auf Basis von MACD und RSI
- Doppelfraktaler Ausbruch
- Noro verlagert die Strategie für den gleitenden Durchschnittlichen Stop Loss
- Handelsstrategie für den doppelten exponentiellen gleitenden Durchschnitt
- Einfache Querschnittstrategie für gleitende Durchschnitte
- Scalping-Strategie auf der Grundlage von Marktliquidität und -trend
- Grenzüberschreitende kurzfristige Strategie zur Umkehrung des Durchbruchs
- Aktienhandel auf Basis von RSI-Indikatoren
- Alles über die Handelsstrategie der EMA-Kanäle
- Handelsstrategie für den RSI mit Doppeldecker
- Doppel Innenbalken & Trendstrategie
- Erstaunliche Preis-Breakout-Strategie
- Strategie zur Fortsetzung des starken Trends
- Trendverfolgung der Kreuzung von gleitenden Durchschnitten
- Ausfallumkehrmodell auf Basis der Schildkrötenhandelsstrategie
- Strategie für die Dynamikentwicklung
- PEAUNT 123 Kurzfristige Handelsstrategie für Umkehr- und Ausbruchbereiche
- Ausgerichtete RSI-basierte Aktienhandelsstrategie
- Strategie für eine glatte Volatilitätsspanne
- Handelsstrategie zur Umkehrung des Rohstoffkanalindex