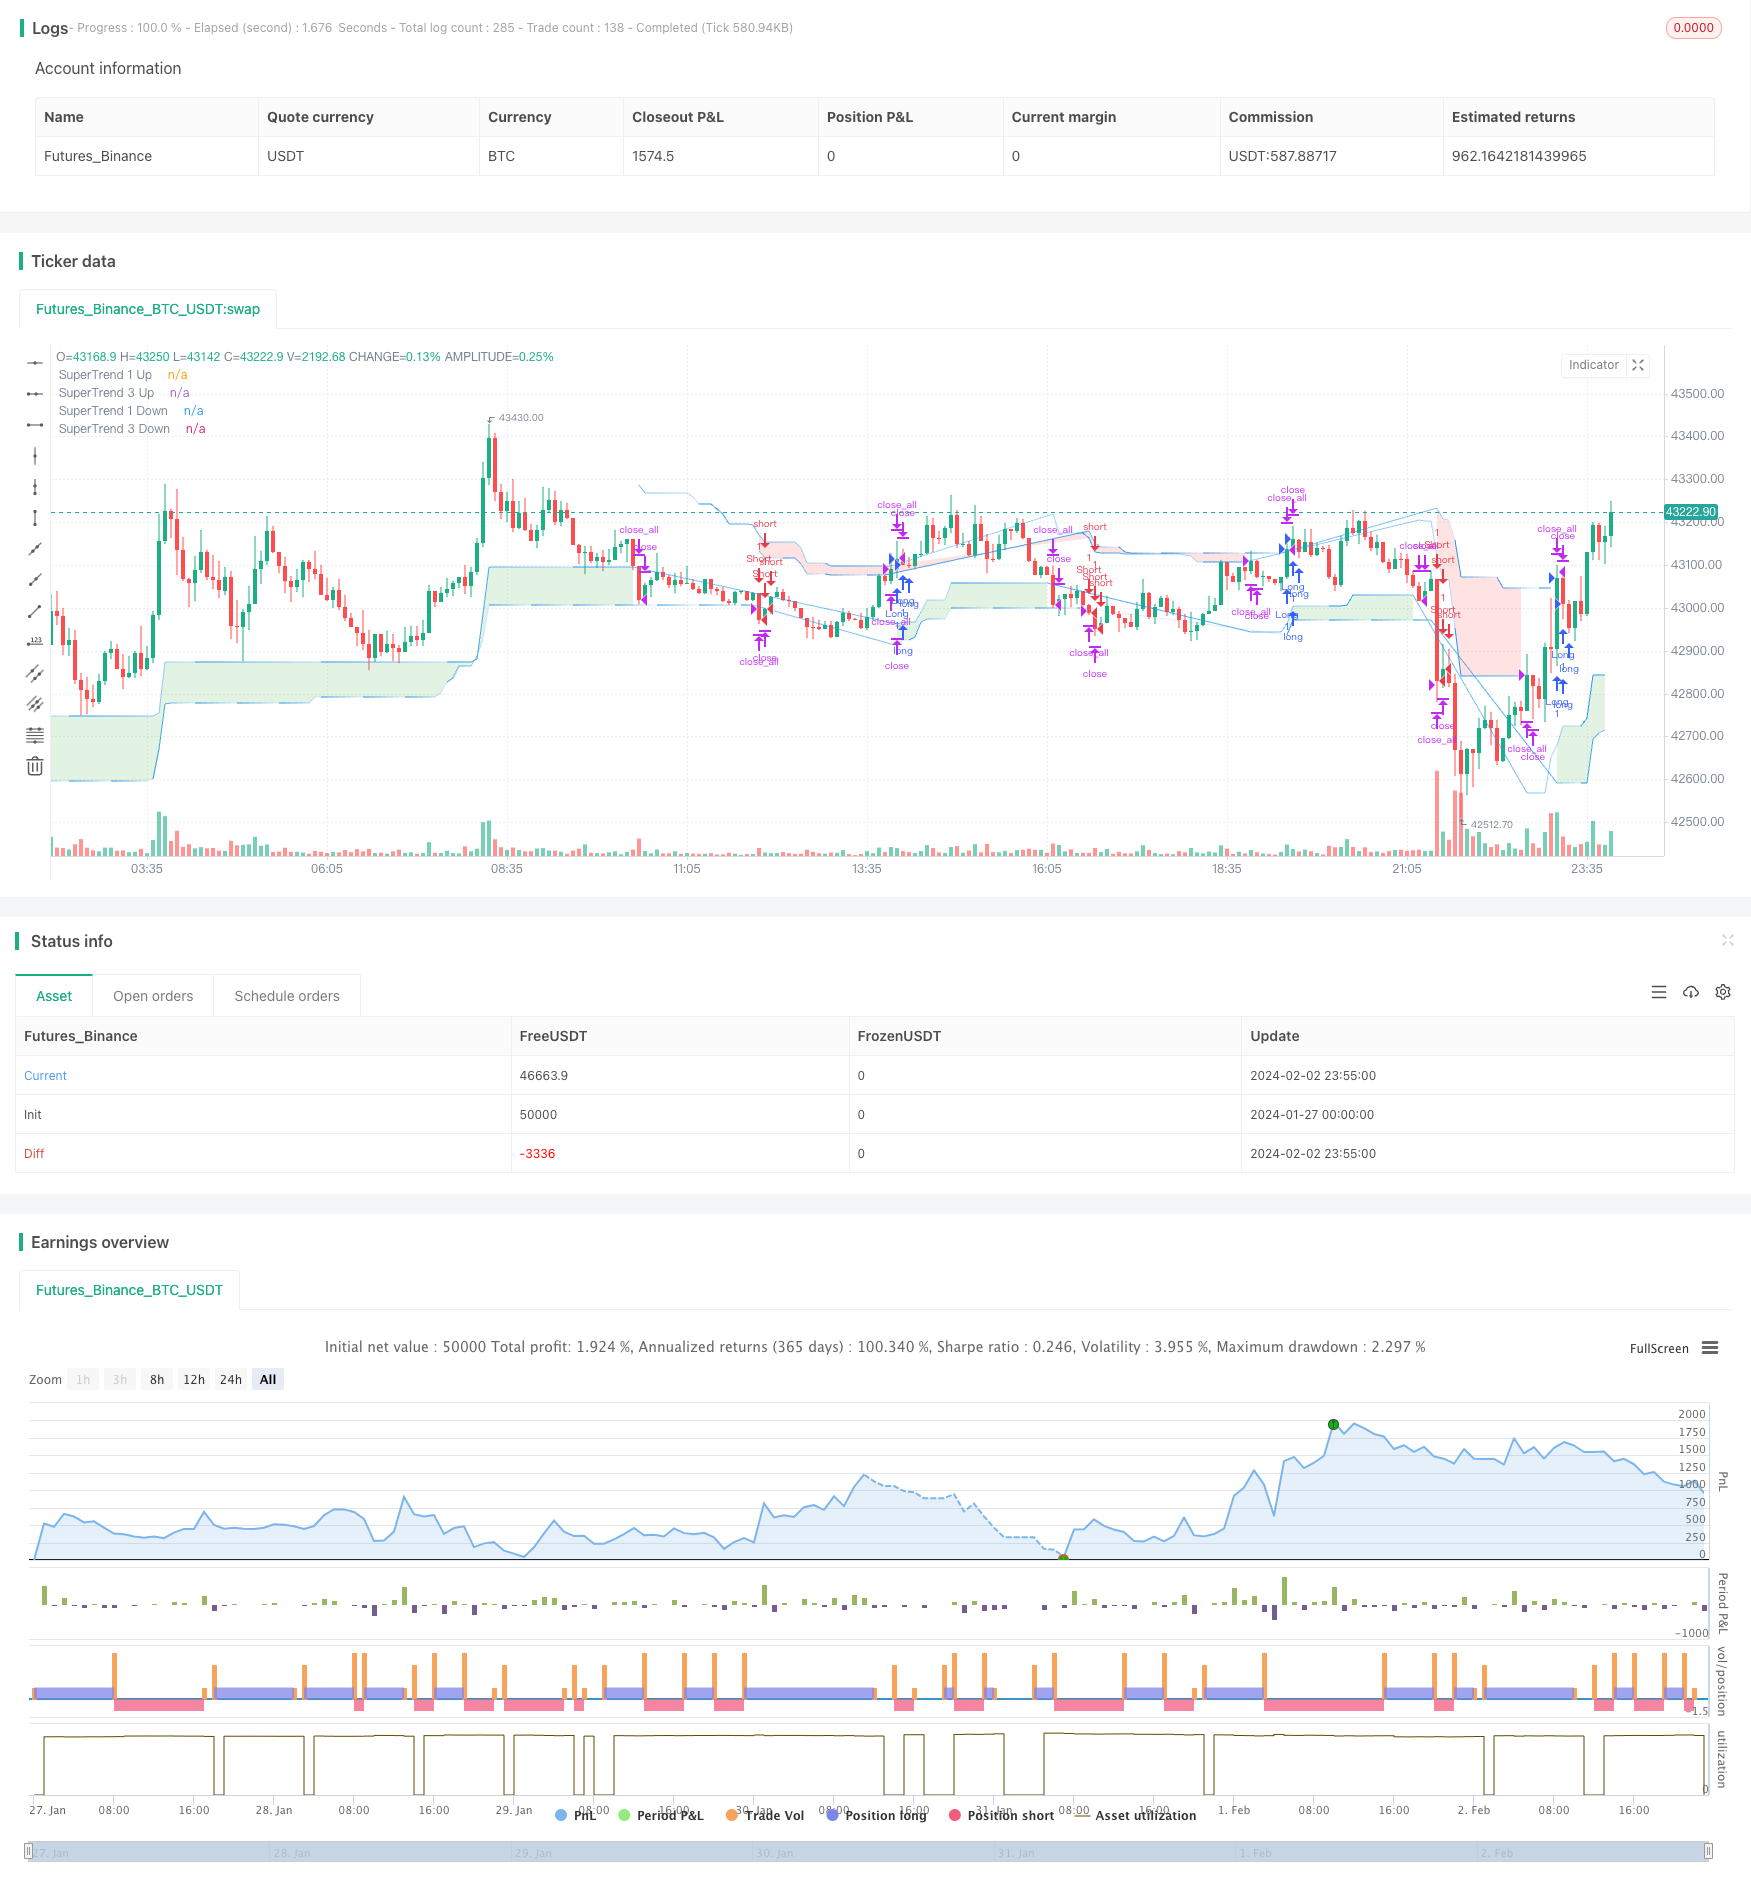
Übertrend-Wochentwicklung bei der Wahl von doppelten Indikatoren
Schriftsteller:ChaoZhang, Datum: 2024-02-04 15:53:48Tags:

Übersicht
Die Strategie kombiniert Hypertrendindicator und Elliott-Wellen-Theorie, um ein solides technisches Handelsinstrument zu schaffen. Sie verwendet eine vielschichtige Trendanalyse, um eine umfassendere Marktperspektive zu bieten, die potenzielle Trendumkehrungen und wichtige Preisänderungen im Early Capture-Markt ermöglicht.
Die Strategie
Der Kerngedanke liegt in seiner vielschichtigen Methode:
- Mit 4 hypertrendigen Indikatoren, die jeweils unterschiedliche ATR-Längen und Multiplikatoren verwenden, werden Trends von kurz bis langfristig beurteilt
- Durch die Verschmelzung der Indikatoren können wir ein solides Signal für mehr und weniger finden.
- Verwenden Sie die Methode der Elliott-Wellen-Mustererkennung, um ähnliche Marktverhaltensmuster zu erkennen und Handelssignale zu bestätigen
So wurden sowohl mehrere Indikatoren genutzt als auch die Patternerkennung erhöht, was die Strategie stabilisierte.
Stärkenanalyse
- Multikondensationsdesign bietet ein umfassendes Urteil
- Wellentheorie inspiriert, Mustererkennung erhöht Stabilität
- In Echtzeit anpassen, um sich dem Markt anzupassen
- Parameter konfigurierbar für verschiedene Sorten und Zeitzyklen
Risikoanalyse
- Die Einstellung der Parameter hängt von der Erfahrung ab und muss angepasst werden, um die optimale Parameterkombination zu bestimmen.
- Multiplikatoren sind komplizierter und erhöhen die Rechenlast
- Es ist nicht möglich, die Erzeugung falscher Signale vollständig zu vermeiden.
Optimale Parameter können durch Parameteroptimierung schrittweise ermittelt werden; Cloud-Computing kann die Rechenleistung verbessern; Stopp-Loss-Systeme können eingerichtet werden, um das Risiko zu kontrollieren.
Optimierung
Es gibt verschiedene Optimierungsmöglichkeiten:
- Zusätzliche adaptive Anpassungsmodule, die dynamisch anpassbar sind, je nach Marktlage
- Erweiterung von Modellen für maschinelles Lernen, um die Zuverlässigkeit von Transaktionssignalen zu bestimmen
- Zusammengefasst mit externen Faktoren wie Stimmungskennzahlen, Nachrichten und so weiter, wird das Marktmodell bestimmt.
- Unterstützung für eine Vielzahl von Parametervorlagen, reduziert die Testarbeit
Dies wird die strategischen Parameter intelligenter machen, die Urteile genauer machen und die praktischen Anwendungen einfacher machen.
Zusammenfassung
Die Strategie berücksichtigt die beiden Dimensionen Trend und Modell, die sowohl die Stabilität der Urteile als auch die Flexibilität der Strategie gewährleisten. Mehrfache Indikatoren und Parameter-Einstellungen gewährleisten eine marktweite Anwendbarkeit.
/*backtest
start: 2024-01-27 00:00:00
end: 2024-02-03 00:00:00
period: 5m
basePeriod: 1m
exchanges: [{"eid":"Futures_Binance","currency":"BTC_USDT"}]
*/

//@version=5
strategy("Elliott's Quadratic Momentum - Strategy [presentTrading]",shorttitle = "EQM Strategy [presentTrading]", overlay=true )

// Inputs for selecting trading direction
tradingDirection = input.string("Both", "Select Trading Direction", options=["Long", "Short", "Both"])


// SuperTrend Function
supertrend(src, atrLength, multiplier) =>
    atr = ta.atr(atrLength)
    up = hl2 - (multiplier * atr)
    dn = hl2 + (multiplier * atr)
    trend = 1
    trend := nz(trend[1], 1)
    up := src > nz(up[1], 0) and src[1] > nz(up[1], 0) ?   math.max(up, nz(up[1], 0)) : up
    dn := src < nz(dn[1], 0) and src[1] < nz(dn[1], 0) ? math.min(dn, nz(dn[1], 0)) : dn
    trend := src > nz(dn[1], 0) ?  1 : src < nz(up[1], 0)? -1 : nz(trend[1], 1)
    [up, dn, trend]

// Inputs for SuperTrend settings
atrLength1 = input(7, title="ATR Length for SuperTrend 1")
multiplier1 = input(4.0, title="Multiplier for SuperTrend 1")
atrLength2 = input(14, title="ATR Length for SuperTrend 2")
multiplier2 = input(3.618, title="Multiplier for SuperTrend 2")
atrLength3 = input(21, title="ATR Length for SuperTrend 3")
multiplier3 = input(3.5, title="Multiplier for SuperTrend 3")
atrLength4 = input(28, title="ATR Length for SuperTrend 3")
multiplier4 = input(3.382, title="Multiplier for SuperTrend 3")

// Calculate SuperTrend
[up1, dn1, trend1] = supertrend(close, atrLength1, multiplier1)
[up2, dn2, trend2] = supertrend(close, atrLength2, multiplier2)
[up3, dn3, trend3] = supertrend(close, atrLength3, multiplier3)
[up4, dn4, trend4] = supertrend(close, atrLength4, multiplier4)


// Entry Conditions based on SuperTrend and Elliott Wave-like patterns
longCondition = trend1 == 1 and trend2 == 1 and trend3 == 1 and trend4 == 1
shortCondition = trend1 == -1 and trend2 == -1 and trend3 == -1 and trend4 == - 1

// Strategy Entry logic based on selected trading direction
if tradingDirection == "Long" or tradingDirection == "Both"
    if longCondition
        strategy.entry("Long", strategy.long)
        // [Any additional logic for long entry]

if tradingDirection == "Short" or tradingDirection == "Both"
    if shortCondition
        strategy.entry("Short", strategy.short)
        // [Any additional logic for short entry]


// Exit conditions - Define your own exit strategy
// Example: Exit when any SuperTrend flips
if trend1 != trend1[1] or trend2 != trend2[1] or trend3 != trend3[1] or trend4 != trend4[1]
    strategy.close_all()

// Function to apply gradient effect
gradientColor(baseColor, length, currentBar) =>
    var color res = color.new(baseColor, 100)
    if currentBar <= length
        res := color.new(baseColor, int(100 * currentBar / length))
    res

// Apply gradient effect
color1 = gradientColor(color.blue, atrLength1, bar_index % atrLength1)
color4 = gradientColor(color.blue, atrLength4, bar_index % atrLength3)


// Plot SuperTrend with gradient for upward trend
plot1Up = plot(trend1 == 1 ? up1 : na, color=color1, linewidth=1, title="SuperTrend 1 Up")
plot4Up = plot(trend4 == 1 ? up4 : na, color=color4, linewidth=1, title="SuperTrend 3 Up")

// Plot SuperTrend with gradient for downward trend
plot1Down = plot(trend1 == -1 ? dn1 : na, color=color1, linewidth=1, title="SuperTrend 1 Down")
plot4Down = plot(trend4 == -1 ? dn4 : na, color=color4, linewidth=1, title="SuperTrend 3 Down")

// Filling the area between the first and third SuperTrend lines for upward trend
fill(plot1Up, plot4Up, color=color.new(color.green, 80), title="SuperTrend Upward Band")

// Filling the area between the first and third SuperTrend lines for downward trend
fill(plot1Down, plot4Down, color=color.new(color.red, 80), title="SuperTrend Downward Band")
- Williwangka hat seine Strategie durchbrochen
- Trend-Tracking-Strategien in Kombination mit dem RSI
- Die doppelte Strategie, um Trends umzukehren und dynamische Stopp-Losses zu erfassen
- Die Goldparallell-Strategie wird durchbrochen
- SAR-basierte Umkehrverfolgungsstrategie
- Dynamische RSI-Handelsstrategien
- Mehrzeitrahmen-Gleichlinie-Kreuzung folgt der Strategie
- Die Quantifizierung der Handelsstrategie durch die doppelte Gleichlinie
- Die Strategie basiert auf einem mobilen Durchschnitt.
- Zweimobil-Trendverfolgungsstrategien
- Trendverfolgungsstrategien basierend auf Renko und dem Relative Dynamics Index
- Trends-tracking mobile Durchschnittsstrategien
- Kombination von Handelsstrategien basierend auf dem Braunband, dem gleitenden Durchschnitt und dem MACD
- Kryptowährungsstrategien, die den Preis steigern
- Dynamische Handelsstrategien basierend auf einem Multifaktormodell
- Verbesserte RSI-Breakthrough-Strategie mit Stop-Loss-Bindungen
- Quantifizierte Handelsstrategien basierend auf RSI und Blinken
- Quantitative Handelsstrategien basierend auf SMA und Rolltrendlinien
- Strategie für den Handel mit periodischen Optionen basierend auf Stochastic-Indikatoren