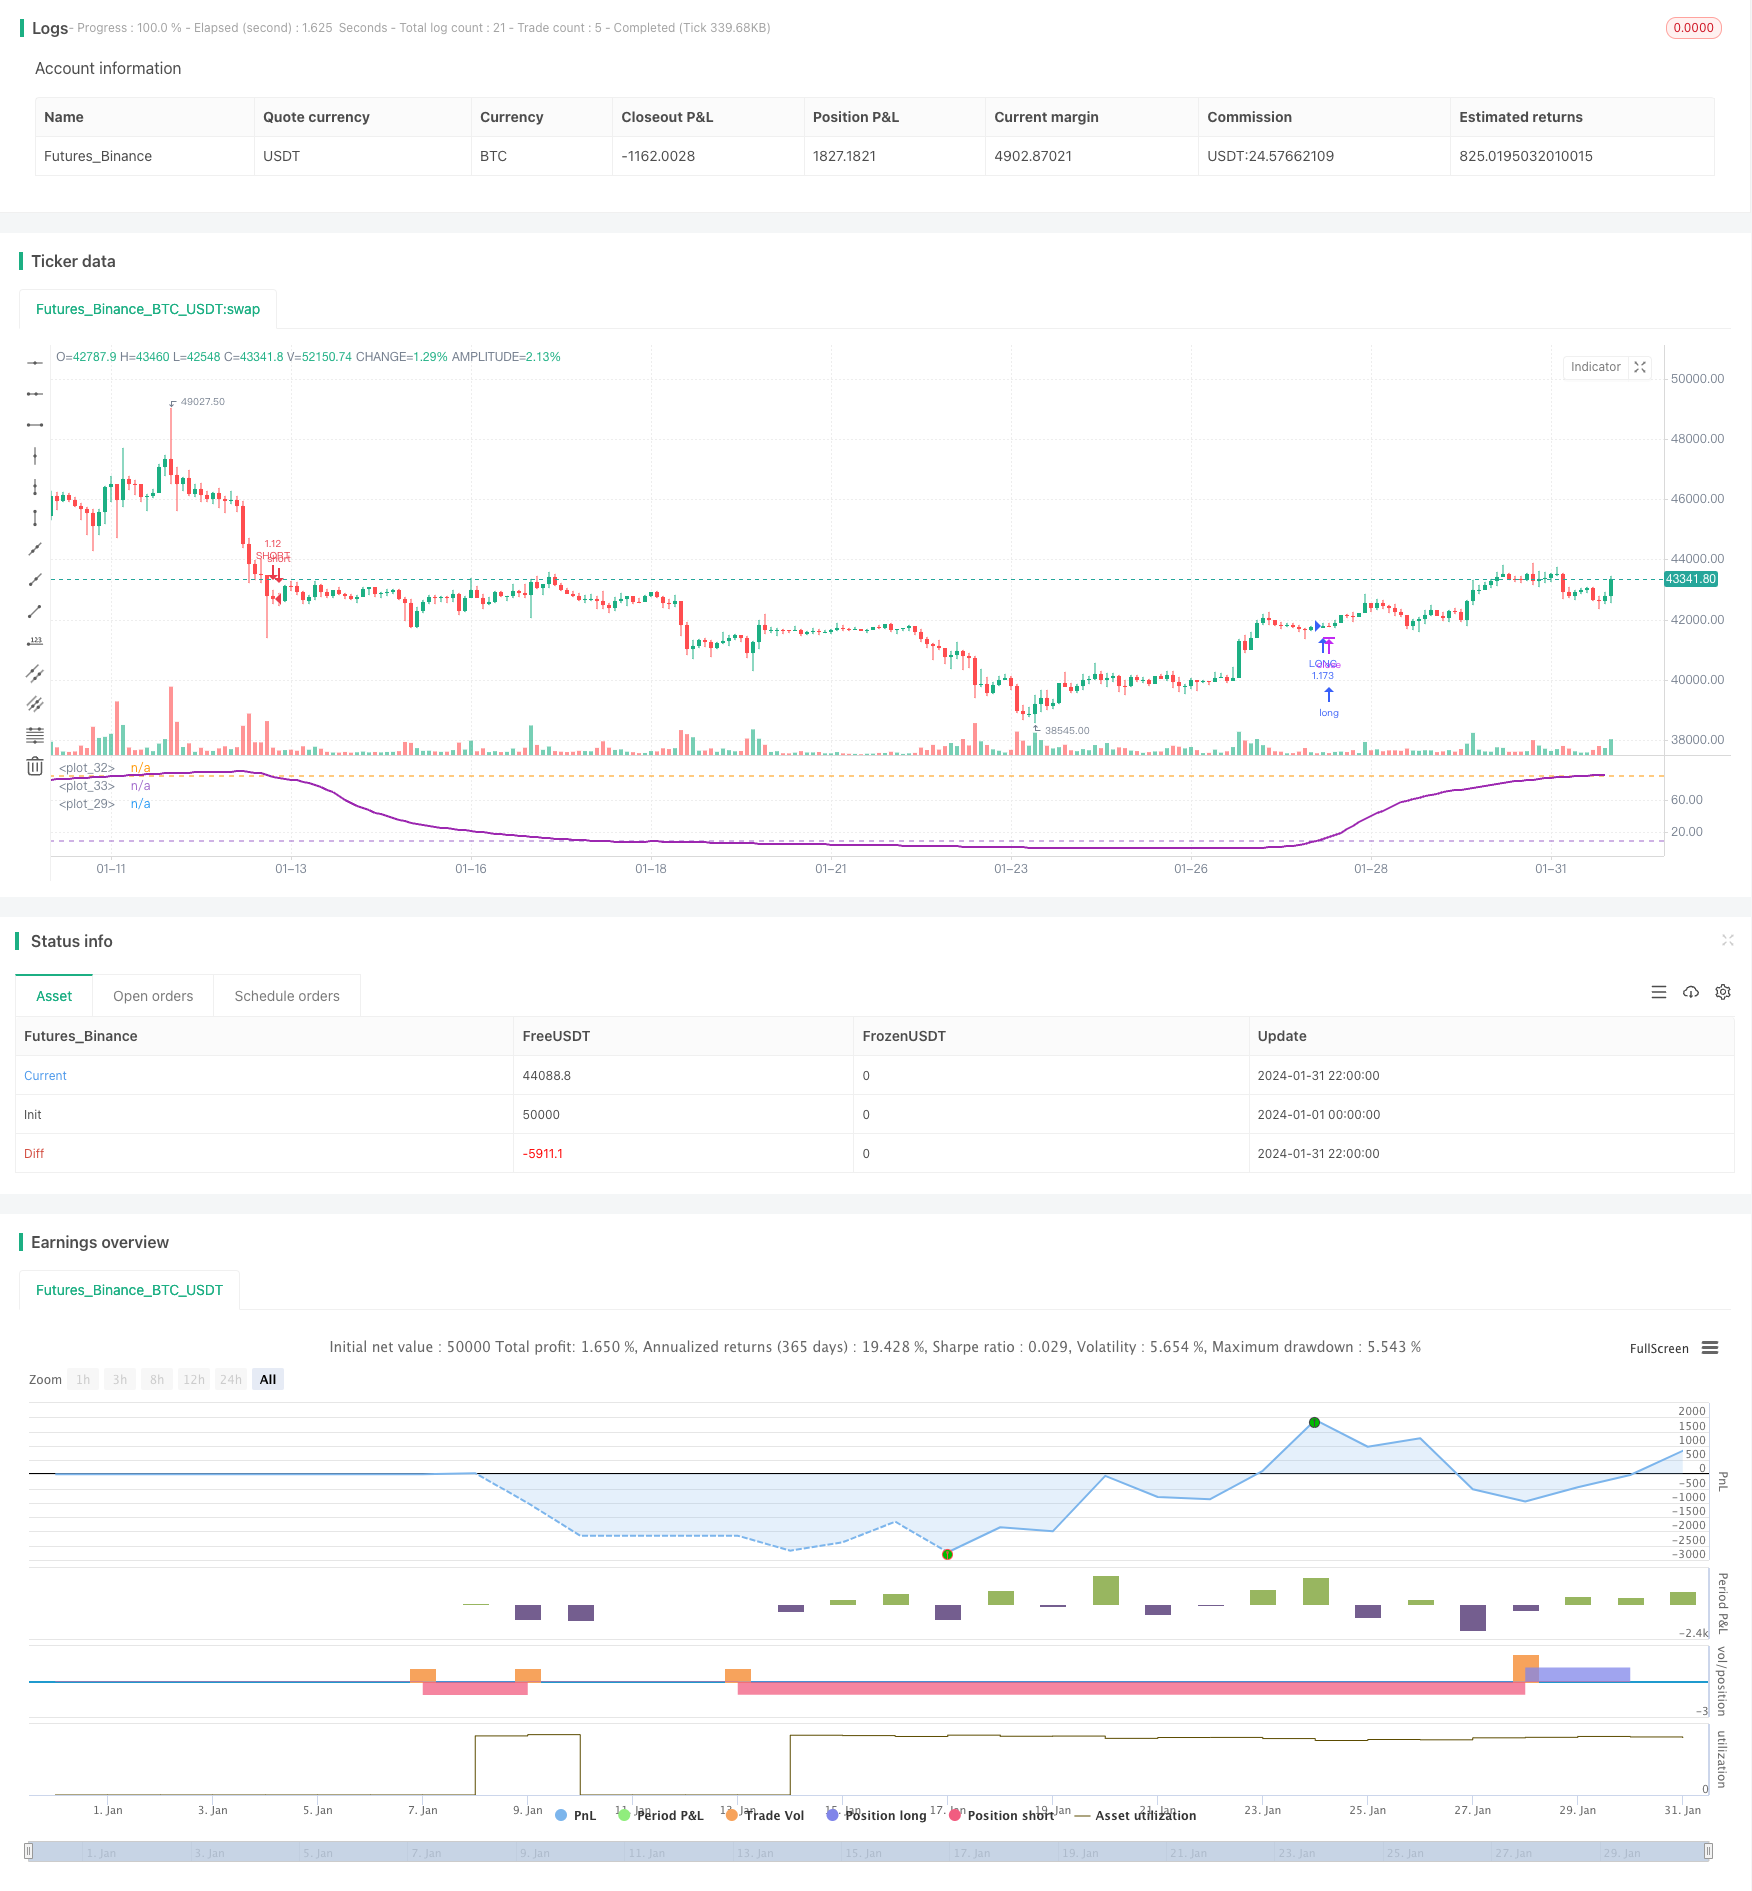
RSI-Swing-Trading-Strategie basierend auf unterjährigen Anpassungen
Erstellungsdatum:
2024-02-29 10:54:45
zuletzt geändert:
2024-02-29 10:54:45
Kopie:
0
Klicks:
608
1
konzentrieren Sie sich auf
1628
Anhänger

Überblick
Diese Strategie ist eine auf dem RSI basierende Schwingungs-Trading-Strategie, die durch die Verfolgung von Schwingungs-Charakteristiken zwischen den RSI-Indikatoren in den festgelegten Auf-und Abwärtsbahnen, die Handelssignale ausgesendet werden, wenn der RSI-Indikator auf den Abwärtsbahnen berührt.
Strategieprinzip
- Setzen Sie die Länge der MA-Durchschnittslinie, die RSI-Parameter, die Auf- und Abwärtsbahnen, die Stop-Loss-Parameter und den Handelszyklusbereich
- Berechnen Sie den RSI-Wert, RSI = (durchschnittlicher Anstieg) / (durchschnittlicher Anstieg + durchschnittlicher Rückgang)*100
- Graphisierung des RSI und der Auf- und Abwärtsbewegungen
- Der RSI-Indikator ist auf dem Weg nach unten als Multi-Signal und auf dem Weg nach unten als Leerzeichen
- Eröffnung von OCO-Anleihen
- Verlust und Stopp gemäß der eingestellten Stop-Loss-Logik
Strategische Stärkenanalyse
- Durch die Einrichtung eines jährlichen Handelszyklus können einige unangemessene externe Umstände vermieden werden.
- Der RSI-Indikator kann effektiv überkäuferische und überverkaufte Verhältnisse widerspiegeln und kann durch das Setzen eines angemessenen Bereichs für Shock-Trading einen Teil des Geräusches filtern.
- OCO-Anleihen in Kombination mit Stop-Loss-Einstellungen ermöglichen eine effiziente Risikokontrolle.
Strategische Risikoanalyse
- Die Genauigkeit der RSI-Kritik kann nicht garantiert werden, und es besteht ein gewisses Risiko einer Fehleinschätzung.
- Eine falsche Einstellung des Jahres-Handelszyklus kann dazu führen, dass bessere Handelschancen verpasst werden oder dass ein unangemessenes Handelsumfeld eingerichtet wird.
- Ein zu großer Stop-Loss könnte zu großen Verlusten führen, ein zu kleiner Stop-Loss könnte zu kleinen Gewinnen führen.
Optimierung kann durch Anpassung der RSI-Parameter, des Handelszyklus-Zeitraums und der Stop-Loss-Ratio erfolgen.
Richtung der Strategieoptimierung
- Testen von RSI-Optimum in verschiedenen Märkten und in verschiedenen Perioden
- Analyse der allgemeinen Marktzyklusregeln zur Festlegung der optimalen Jahreszeit für den Handel
- Ermittlung eines angemessenen Stop-Loss-Anteils durch Rückmessung
- Optimierung der Variantenwahl und Vergrößerung der Positionen
- Optimierung in Kombination mit anderen besseren Trading-Techniken oder Indikatoren
Zusammenfassen
Die Strategie verfolgt Trends durch den RSI-Indikator, der in bestimmten Perioden des Jahres die Schwingungsmerkmale aufweist, um das Handelsrisiko effektiv zu kontrollieren. Durch Parameteroptimierung und Regeloptimierung kann eine höhere Strategiewirkung erzielt werden.
Strategiequellcode
/*backtest
start: 2024-01-01 00:00:00
end: 2024-01-31 23:59:59
period: 2h
basePeriod: 15m
exchanges: [{"eid":"Futures_Binance","currency":"BTC_USDT"}]
*/

//@version=3
strategy(title = "Bitlinc MARSI Study AST",shorttitle="Bitlinc MARSI Study AST",default_qty_type = strategy.percent_of_equity, default_qty_value = 100,commission_type=strategy.commission.percent,commission_value=0.1,initial_capital=1000,currency="USD",pyramiding=0, calc_on_order_fills=false)

// === General Inputs ===
lengthofma = input(62, minval=1, title="Length of MA")
len = input(31, minval=1, title="Length")
upperband = input(89, minval=1, title='Upper Band for RSI')
lowerband = input(10, minval=1, title="Lower Band for RSI")
takeprofit =input(1.25, title="Take Profit Percent")
stoploss =input(.04, title ="Stop Loss Percent")
monthfrom =input(8, title = "Month Start")
monthuntil =input(12, title = "Month End")
dayfrom=input(1, title= "Day Start")
dayuntil=input(31, title= "Day End")

// === Innput Backtest Range ===
//FromMonth = input(defval = 9, title = "From Month", minval = 1, maxval = 12)
//FromDay   = input(defval = 1, title = "From Day", minval = 1, maxval = 31)
//FromYear  = input(defval = 2018, title = "From Year", minval = 2017)
//ToMonth   = input(defval = 1, title = "To Month", minval = 1, maxval = 12)
//ToDay     = input(defval = 1, title = "To Day", minval = 1, maxval = 31)
//ToYear    = input(defval = 9999, title = "To Year", minval = 2017)

// === Create RSI ===
src=sma(close,lengthofma)
up = rma(max(change(src), 0), len)
down = rma(-min(change(src), 0), len)
rsi = down == 0 ? 100 : up == 0 ? 0 : 100 - (100 / (1 + up / down))
plot(rsi,linewidth = 2, color=purple)

// === Plot Bands ===
band1 = hline(upperband)
band0 = hline(lowerband)
fill(band1, band0, color=blue, transp=95)

// === Entry and Exit Methods ===
longCond =  crossover(rsi,lowerband)
shortCond =  crossunder(rsi,upperband)

// === Long Entry Logic ===
if (  longCond )
    strategy.entry("LONG", strategy.long, stop=close, oca_name="TREND", comment="LONG")
else
    strategy.cancel(id="LONG")

// === Short Entry Logic ===
if ( shortCond   )
    strategy.entry("SHORT", strategy.short,stop=close, oca_name="TREND",  comment="SHORT")
else
    strategy.cancel(id="SHORT")

// === Take Profit and Stop Loss Logic ===
//strategy.exit("Take Profit LONG", "LONG", profit = close * takeprofit / syminfo.mintick, loss = close * stoploss / syminfo.mintick)
//strategy.exit("Take Profit SHORT", "SHORT", profit = close * takeprofit / syminfo.mintick, loss = close * stoploss / syminfo.mintick)
strategy.exit("LONG TAKE PROFIT", "LONG", profit = close * takeprofit / syminfo.mintick)
strategy.exit("SHORT STOP LOSS", "SHORT", profit = close * takeprofit / syminfo.mintick)
strategy.exit("LONG STOP LOSS", "LONG", loss = close * stoploss / syminfo.mintick)
strategy.exit("SHORT STOP LOSS", "SHORT", loss = close * stoploss / syminfo.mintick)