Triple BB Bands Breakout mit RSI Strategie
Schriftsteller:ChaoZhang, Datum: 2024-02-29 14:57:49Tags:

Übersicht
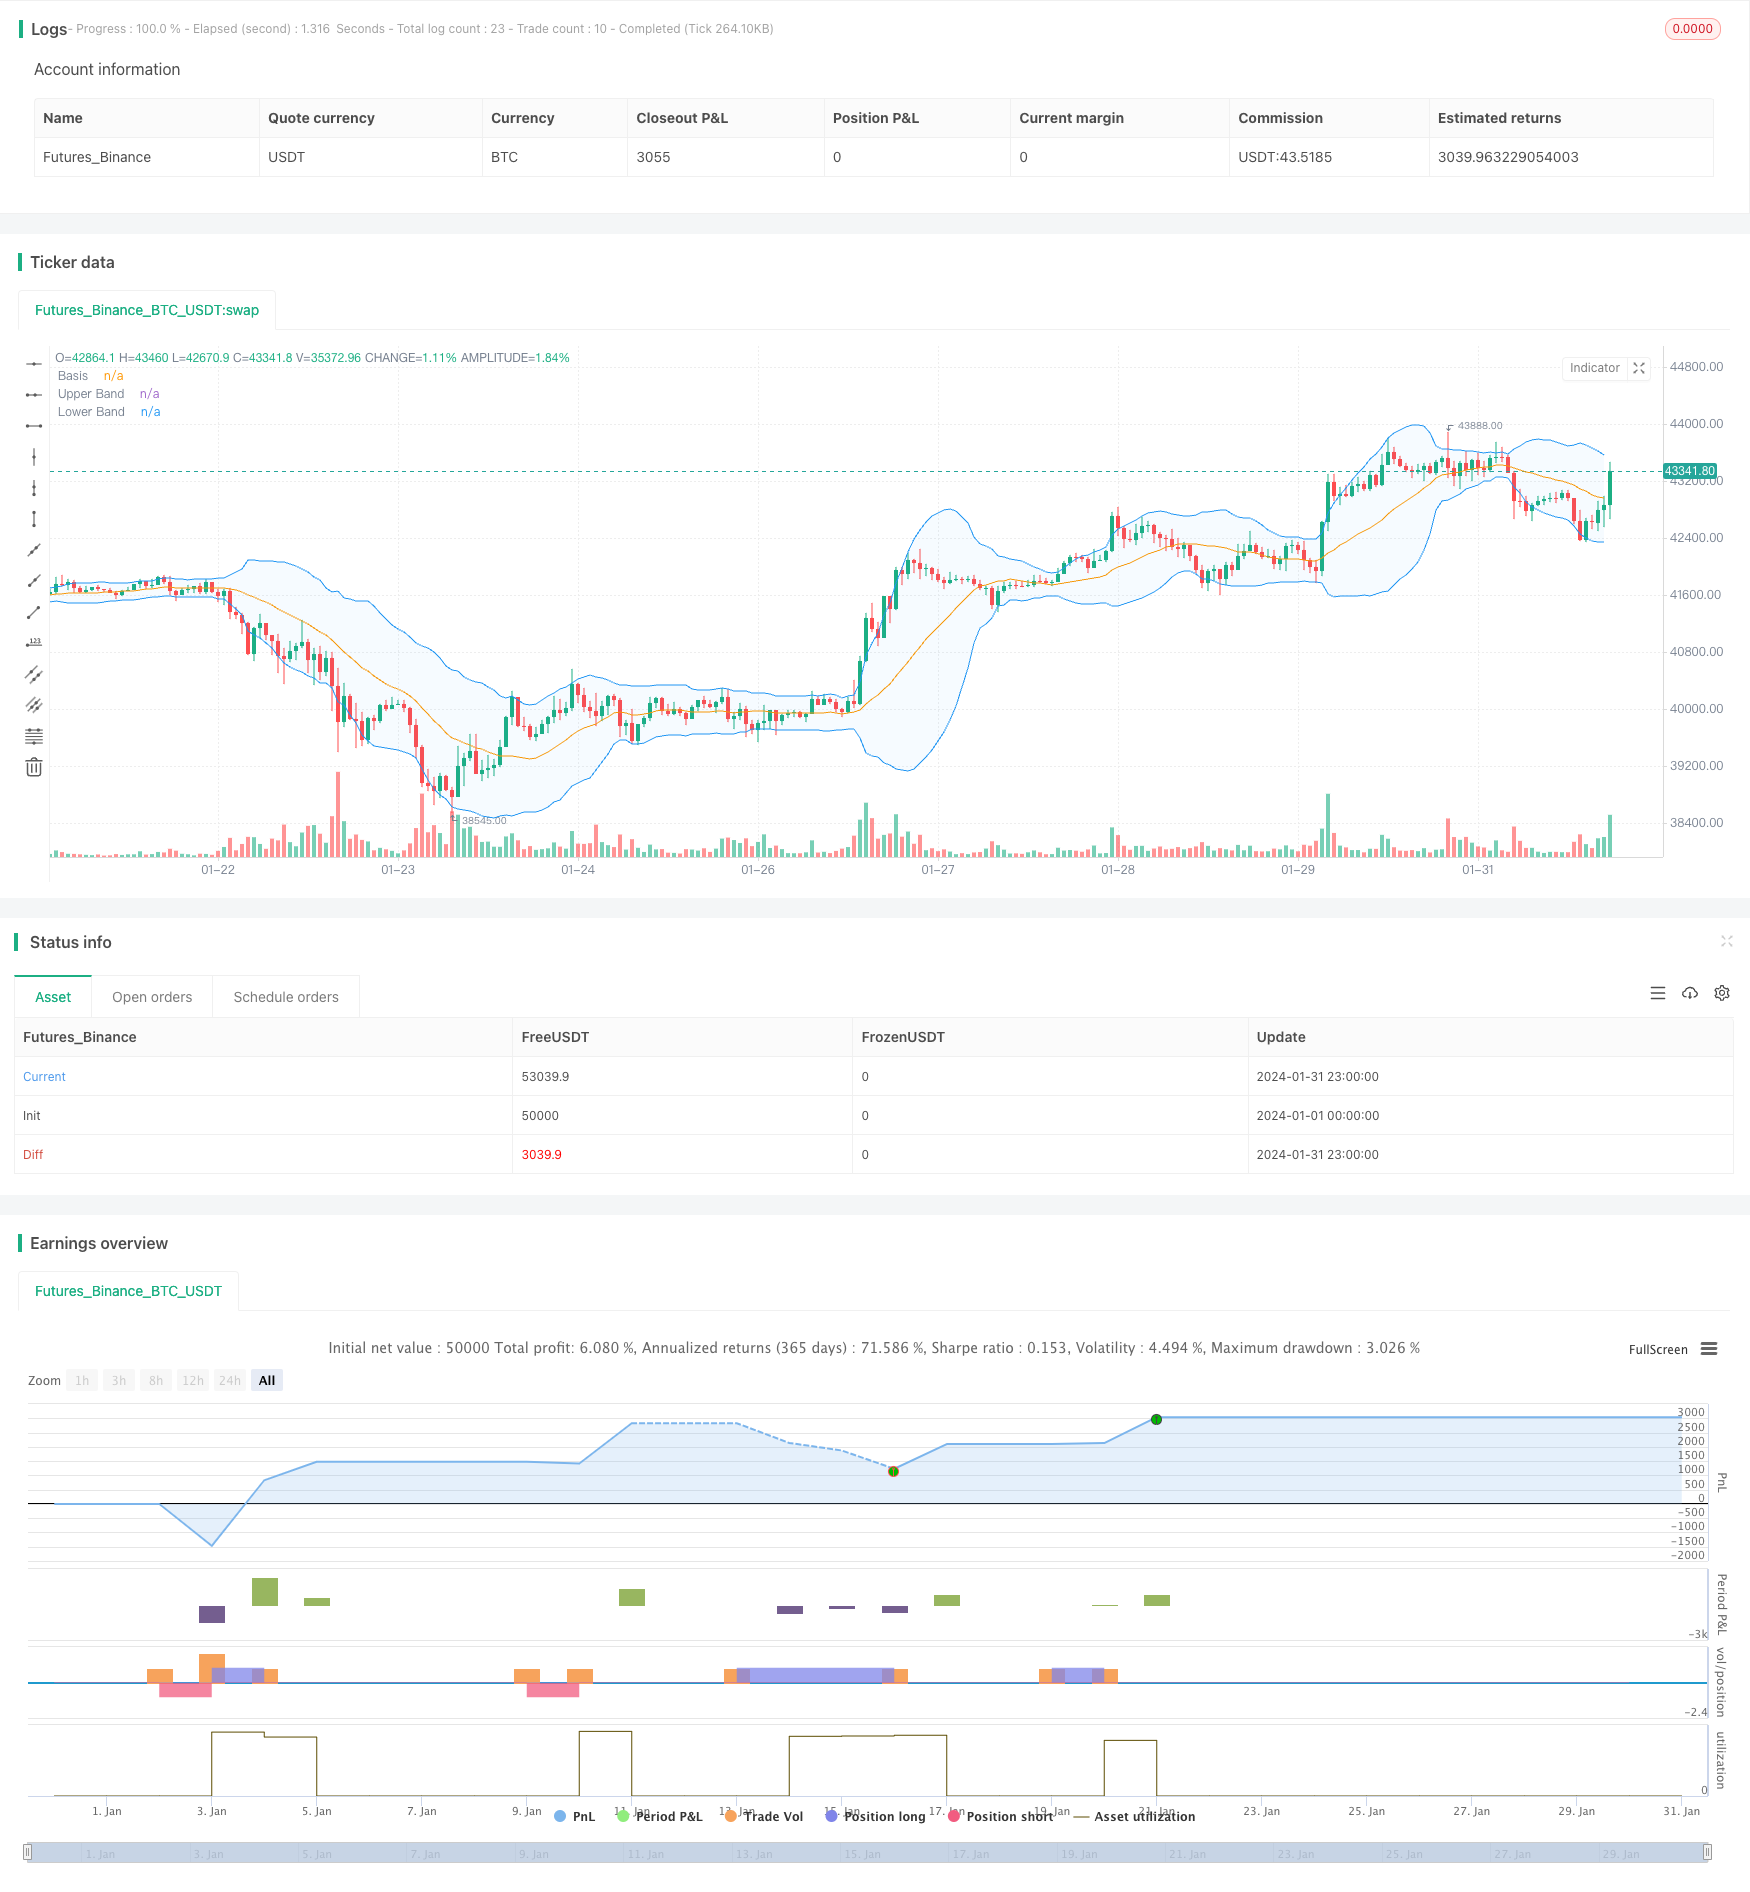
Diese Strategie kombiniert Bollinger Bands und RSI-Indikatoren, um Handelssignale zu generieren. Sie überwacht, ob die Schlusskurs von drei Kerzen gleichzeitig die oberen oder unteren Bands durchbrechen, und kombiniert den Vortex-Indikator und den RSI-Indikator, um Handelssignale zu bestätigen.
Strategieprinzip
Die Strategie beruht hauptsächlich auf folgenden Grundsätzen:
- Verwenden Sie 20-Perioden-Bollinger-Bänder, erwägen Sie, Handelssignale auszugeben, wenn die Preise durch die oberen oder unteren Banden bei Schließen brechen
- Erfordern drei Leuchter zur gleichen Zeit durchbrechen falsche Ausbrüche zu vermeiden
- Kombinieren Sie den Vortex-Indikator, wenn stark überkauft VIP>1.25, wenn stark überverkauft VIM>1.25, Filtern Sie Signale aus
- Kombinieren Sie den RSI-Indikator, um Überkauf und Überverkauf zu bestimmen, ziehen Sie in Betracht, kurz zu gehen, wenn der RSI 70 durchbricht, und ziehen Sie in Betracht, lang zu gehen, wenn der RSI 30 durchbricht
- Wenn die vorstehenden Bedingungen erfüllt sind, werden lange und kurze Signale erzeugt
Analyse der Vorteile
Die wichtigsten Vorteile dieser Strategie sind:
- Drei BB-Bänder filtern falsche Ausbrüche aus und gewährleisten die Zuverlässigkeit der Ausbrüche
- Der Vortex-Indikator beurteilt die Marktstärke und vermeidet ungünstige Handelsbedingungen auf dem Markt.
- Der RSI-Indikator beurteilt das Überkauf- und Überverkaufsgebiet in Kombination mit dem Indikator Bollinger Bands für den Einstieg
- Die Kombination mehrerer Indikatoren beurteilt die Marktlage umfassend und die Signalzuverlässigkeit ist relativ hoch
Risikoanalyse
Die Strategie birgt auch einige Risiken:
- Bollinger Bands Indikator ist sehr empfindlich auf Parameter, Länge und StdDev Multiplikator müssen optimiert werden
- Der Vortex-Indikator ist auch sehr empfindlich auf den Zyklusparameter, der für verschiedene Märkte angepasst werden muss
- Der RSI-Indikator ist anfällig für Abweichungen und kann auch Trends verpassen
- Wenn die drei Indikatoren nicht übereinstimmen, ist es unmöglich, teilzunehmen, und manche Möglichkeiten werden verpasst.
Zu den Risikokontrollmaßnahmen gehören:
- Optimieren von Parametern und verwenden von Parametern mit der höchsten Gewinnrate im Backtesting
- Kombination anderer Indikatoren, z. B. Filterung des Handelsvolumens
- Entspannen Sie die Indikator-Bewertungslogik angemessen, um zu vermeiden, dass gute Chancen verpasst werden
Optimierungsrichtlinien
Die Strategie kann in folgenden Aspekten optimiert werden:
- Optimieren Sie die Länge und den StdDev-Multiplikator von Bollinger-Bändern, um die optimalen Parameter zu finden
- Optimierung des Zyklus des Vortex-Indikators, um ihn für verschiedene Märkte geeigneter zu machen
- Erhöhen Sie die Bewertung anderer Indikatoren, wie Handelsvolumen, MACD usw., um diversifizierte Signale zu bereichern
- Anpassung der Indikatorbeurteilungslogik, um zu verhindern, dass aufgrund der Indikatordivergenz keine Eintrittsmöglichkeit besteht
- Steigerung der Stop-Loss-Strategie zur Kontrolle des maximalen Verlusts pro Handel
Zusammenfassung
Diese Strategie kombiniert mehrere Indikatoren für das Urteilen. Während sie die Signalzuverlässigkeit gewährleistet, hat sie auch einige Probleme. Durch Parameteroptimierung, bereicherte Signalquellen, angepasste Urteilslogik und Stop-Loss usw. können die Stabilität und Rentabilität der Strategie weiter verbessert werden. Sie bietet eine gute Idee für den quantitativen Handel.
/*backtest
start: 2024-01-01 00:00:00
end: 2024-01-31 23:59:59
period: 1h
basePeriod: 15m
exchanges: [{"eid":"Futures_Binance","currency":"BTC_USDT"}]
*/

// This Pine Script™ code is subject to the terms of the Mozilla Public License 2.0 at https://mozilla.org/MPL/2.0/
// © Noway0utstorm

//@version=5
strategy(title='RSI + BB  over 3 bar+--- vortex0.71.3  ', shorttitle='NoWaytruongphuthinh', format=format.price, precision=4,overlay = true)

length = input(20, title="Length")
mult = input(2.0, title="Multiplier")
source = close

basis = ta.sma(source, length)
dev = mult * ta.stdev(source, length)

upperBand = basis + dev
lowerBand = basis - dev

isClosedBar = ta.change(time("15"))

var bool closeAboveUpperBand = false
var bool closeBelowLowerBand = false


// Vortex Indicator Settings
period_ = input.int(14, title='Period', minval=2)

VMP = math.sum(math.abs(high - low[1]), period_)
VMM = math.sum(math.abs(low - high[1]), period_)
STR = math.sum(ta.atr(1), period_)
VIP = VMP / STR
VIM = VMM / STR

//
lengthrsi = input(14, title="RSI Length")
overboughtLevel = input(70, title="Overbought Level")
oversoldLevel = input(30, title="Oversold Level")

sourcersi = close
rsiValue = ta.rsi(sourcersi, lengthrsi)

shouldShort = rsiValue > overboughtLevel
shouldLong = rsiValue < oversoldLevel


if bool(isClosedBar[1]) and bool(isClosedBar[2]) and bool(isClosedBar[3])

    if close[1] > upperBand[1] and close[2] > upperBand[2] and close[3] > upperBand[3] and VIP > 1.25 and VIM < 0.7 and rsiValue > overboughtLevel
        strategy.entry("Short", strategy.short)
        closeAboveUpperBand := false  // Reset the condition when entering a new Short position
    if close[1] < lowerBand[1] and close[2] < lowerBand[2] and close[3] < lowerBand[3] and VIP < 0.7 and VIM > 1.25 and rsiValue < oversoldLevel
        strategy.entry("Long", strategy.long)
        closeBelowLowerBand := false  // Reset the condition when entering a new Long position


if strategy.position_size > 0  // Check if there is an open Long position
    closeAboveUpperBand := close > upperBand  // Update the condition based on close price
    if closeAboveUpperBand
        strategy.close("Long",disable_alert=true)  // Close the Long position if close price is above upper band

if strategy.position_size < 0  // Check if there is an open Short position
    closeBelowLowerBand := close < lowerBand  // Update the condition based on close price
    if closeBelowLowerBand
        strategy.close("Short",disable_alert=true)  // Close the Short position if close price is below lower band

// Plots
plot(basis, color=color.orange, title="Basis")
p1 = plot(upperBand, color=color.blue, title="Upper Band")
p2 = plot(lowerBand, color=color.blue, title="Lower Band")
fill(p1, p2, title = "Background", color=color.rgb(33, 150, 243, 95))
- Die Breakout-Regressionsstrategie
- Schnelle RSI-Umkehrhandelsstrategie
- Die Strategie zur Nachverfolgung von Momentum-Burst
- Erhöhte Berührung Kurzdreieckstrategie
- Durchschnittliche bewegliche Kreuzung nach Strategie
- Strategie zur Durchbrüche der Doppelbestätigung
- Walnuss-Trend nach Strategie basierend auf der Entfernung von 200 EMA
- VWAP-Trend nach der Strategie
- Schildkröten-Trendstrategie
- Strategie zur Umkehrung der Marktdynamik
- Handelsstrategie mit doppelten gleitenden Durchschnittswerten
- Adaptive Kanal-Ausbruchstrategie
- Eine fortgeschrittene EMA-Trendstrategie mit entspannten RSI- und ATR-Filtern
- Strategie zur Nachverfolgung von Trends durch dreifache Bestätigung
- Mehrfache Handelsstrategie für gleitende Durchschnitte
- Schildkrötenhandelsentscheidungssystem
- Welle Kauf und Verkauf Umkehrung 5 Minuten Zeitrahmen Strategie
- RSI-basierte Auto-Handelsstrategie
- Die Strategie des Komplexen Ausbruchs
- Die Strategie des Momentum Breakouts