Dynamic time series based pattern recognition strategies
Author: Inventors quantify - small dreams, Created: 2017-02-21 09:50:44, Updated:Dynamic time series based pattern recognition strategies
- ###############################################################################################################################################################################################################################################################
The theory of technical analysis is based on three important assumptions:
(1) The stock price contains all the market information
(2) The trend in the stock price
(3) History will repeat itself
The third point describes the long-term trend of stock prices or indices, which will repeatedly show certain volatility or patterns, and the study of these patterns has an important reference value for the prediction of the after-market. The so-called volatility trend is the characterization of the stock price or other indicators in a certain period of time, such as up, down, or upturn.
From the point of view of behavioral finance, both the dispositional effect and the herd effect are objectively present in the market. The market is the result of a large number of investors gambling, although the investment indicator is variable, the same indicator is also in flux at any time, but human nature is unchanged, trading psychology is unchanged, the oriented thinking and speculative psychology formed by investors in the decision-making process leads to the continuous repetition of history. Technical analysis is mostly based on the analysis and deduction of historical data, trying to guide future decision-making techniques by extracting laws from history.
In summary, the shape of the stock reflects not only the information of the fundamental changes of the stock, but also the investment psychology of the market investment group, which contains trading logic. Therefore, the price movement of the stock will present a similar shape, and different stocks with similar shape will often show similar movements in the future.
The difficulty in identifying and making predictions based on technical analysis theory is that many technical analysis methods rely on empirical judgments and are difficult to quantify, and even for the same trend patterns different technical analysts will reach completely opposite conclusions. We tried to solve this problem with pattern recognition algorithms.
- ### 2. Form recognition algorithm
Formal recognition, similar to speech recognition, is essentially the capture and recognition of waveform features. More common recognition algorithms include neural network algorithms, implicit Markov algorithms, and machine learning-based algorithms, as well as statistical methods based on technical indicators and functional extremes.
This report adopts dynamic time-regulation algorithms. In the field of automatic speech recognition, since a speech signal is a signal with considerable randomness, even if the same speaker pronounces the same word, the result of each pronunciation is different and cannot be of exactly the same length of time. Therefore, when matched to a stored model, the timeline of the unknown word is unevenly twisted or bent so that its characteristics match the template characteristics.
In fact, in practical application scenarios, especially in financial time series, matching problems often require that the time series is not completely consistent on the timeline, in other words, if the time series is similar in form, but there are patterns of stretching or amplification differences within the sequence, it can still be assumed that the time series group is similar and needs to be matched. It is through this form matching that technical analysts in the market find patterns similar to current trends in the historical data of individual stocks or large discs, and observe the trends of individual stocks or discs after these trends occur in history, ultimately making predictions about the movements of later stocks or large discs, guiding trading decisions.
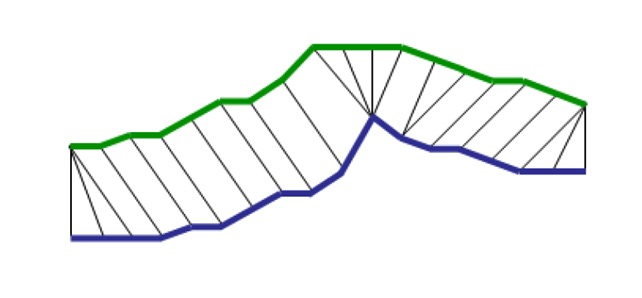
The key to understanding dynamic time series algorithms is to understand the concept of time series, which is illustrated as follows:

The blue and green lines represent two time sequences, and compared to the traditional distance measurement method, time regulation is the mapping of time points one-to-many or many-to-one, while meeting the optimal conditions. After such mapping, regulation is performed on the timeline, making the distance between the two time sequences the smallest and the most similar.
The core of dynamic timekeeping algorithms is to find the optimal path, which must satisfy the following constraints:
(1) The conditions of the border;
(2) Continuity: the requirement that a point cannot be crossed to match, but only to align with its neighbouring points
(3) Monotone: the request point must be monotone in time
The dynamic planning method can be used to find the optimal path and the minimum distance.
- ### 3. Form recognition strategies
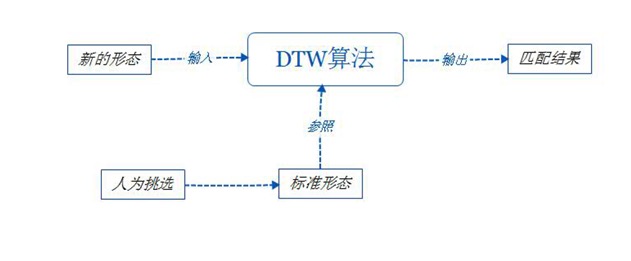
Using a dynamic time-regulation algorithm to achieve shape recognition, based on the standard shape selected by humans, each trading day using the shape recognition algorithm to calculate the distance between the shape of all A-share shares and the standard shape, then select the stocks that are less than the threshold and buy at the opening price of the day, hold five days at the closing price sold, if the closing price falls more than -5% on one day in the holding process, then at the closing price stop loss.


- ### 5. Conclusion
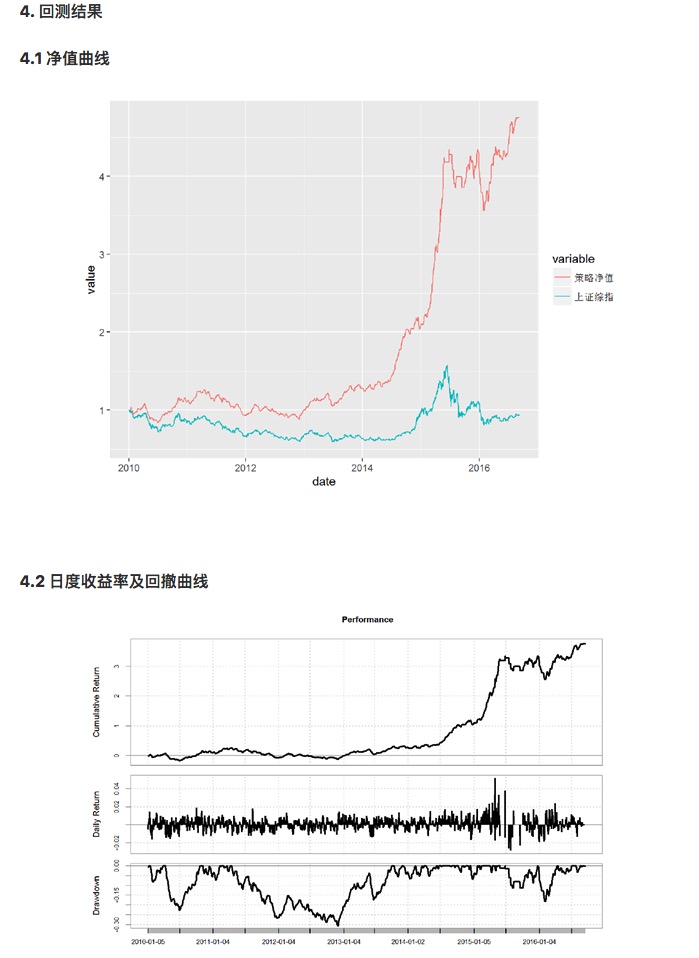
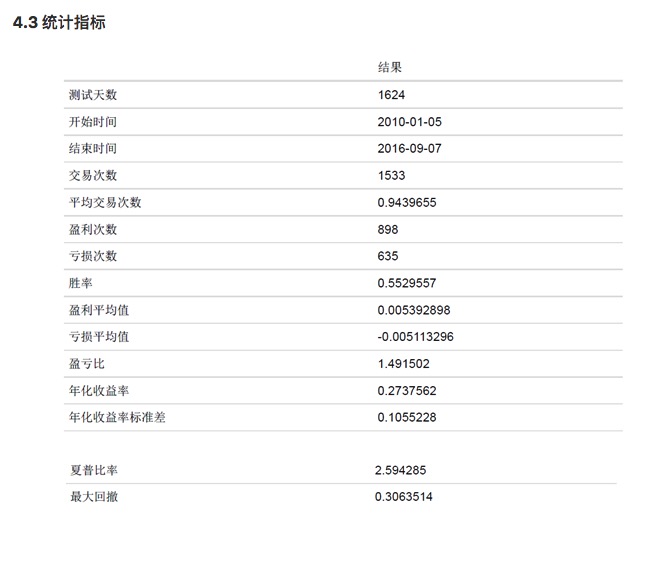
The strategy is based on a dynamic time-regularity algorithm that captures stock shapes similar to the empirical shape and builds a stock portfolio. It achieved a Sharpe ratio of 2.59 and an annualized return of 27.4% during the retest period, stabilizing the significant run-rate.
Translated from the original German
- If you can't win, throw a coin and make a deal, can you still make money?
- The journey of machine learning algorithms
- When we predict probabilities, what do we predict?
- Programmatic transaction flow chart (an idea to the program)
- _C() Re-test the function
- _N() function, small number of decimal places, precision control
- Adaptive learning in the first place
- Real and formal trading systems
- Three short stories about understanding real estate, stocks and money
- Six branches of Quant uncovered
- Thinking about an analog exchange
- Eight well-known crypto hedge EA's review of strategy
- Reduce worthless trades and cherish familiar opportunities!
- The 10th currency war in history!
- Experience with futures trading
- What does support vector machine (SVM) mean?
- New timing and strategy in options trading
- High-frequency strategy: exchange of applications for cabbage harvesters
- Leaving school for a low level of hard work is a trap
- Talk about network trading law