Implementation and application of the inventor quantified platform in the fall line trading strategy
Author: Goodness, Created: 2019-07-29 15:22:39, Updated: 2024-12-19 21:01:58
Definition of the waterfall line
A fall line is a moving average drawn with an asymmetric moving average (MACD) indicator, used to generate buy and sell signals in a security. A fall line or signal line is a nine-period EMA indicator moving average of the MACD indicator line used by traders to predict future price trends. Although the nine-period EMA is the default setting of the fall line, traders can adjust the length of the EMA to suit their trading indicator and strategy.
The meaning of the waterfall line
The fall line provides technical insight into when to enter a multi-head or blank position. When the fall line is above or below the EMA indicator, traders enter a peace position. When the EMA crosses the fall line, a buy signal is generated that indicates that the trader should buy the open position. Conversely, if the EMA breaks the fall line, it indicates a bearish trend, and the trader should do a short.
The Benefits of Waterfall Wire
Rapid response: The cascade helps to detect trend reversals at an early stage, which makes it a particularly useful tool for short-term traders. Since the cascade uses a nine-cycle EMA, it can respond relatively quickly to price changes. This helps to offset the lagging nature of the indicator.
Using the cascade systematizes trading decisions. Traders can stay in one direction until the cascade crosses the MACD in the opposite direction. For example, if a trader holds multiple positions when the EMA crosses the cascade, the trader can only make multiple trades at these positions until the MACD crosses below the cascade. Signals generated by the cascade to enter and exit the market prevent traders from second guessing or making random decisions.
In a volatile market, the cascade often crosses the EMA and produces many false sell signals. To avoid this, traders can try to add other technical indicators to prove it. For example, when the EMA crosses the cascade, the MFI must be asked to oversell.
Implementing a waterfall strategy
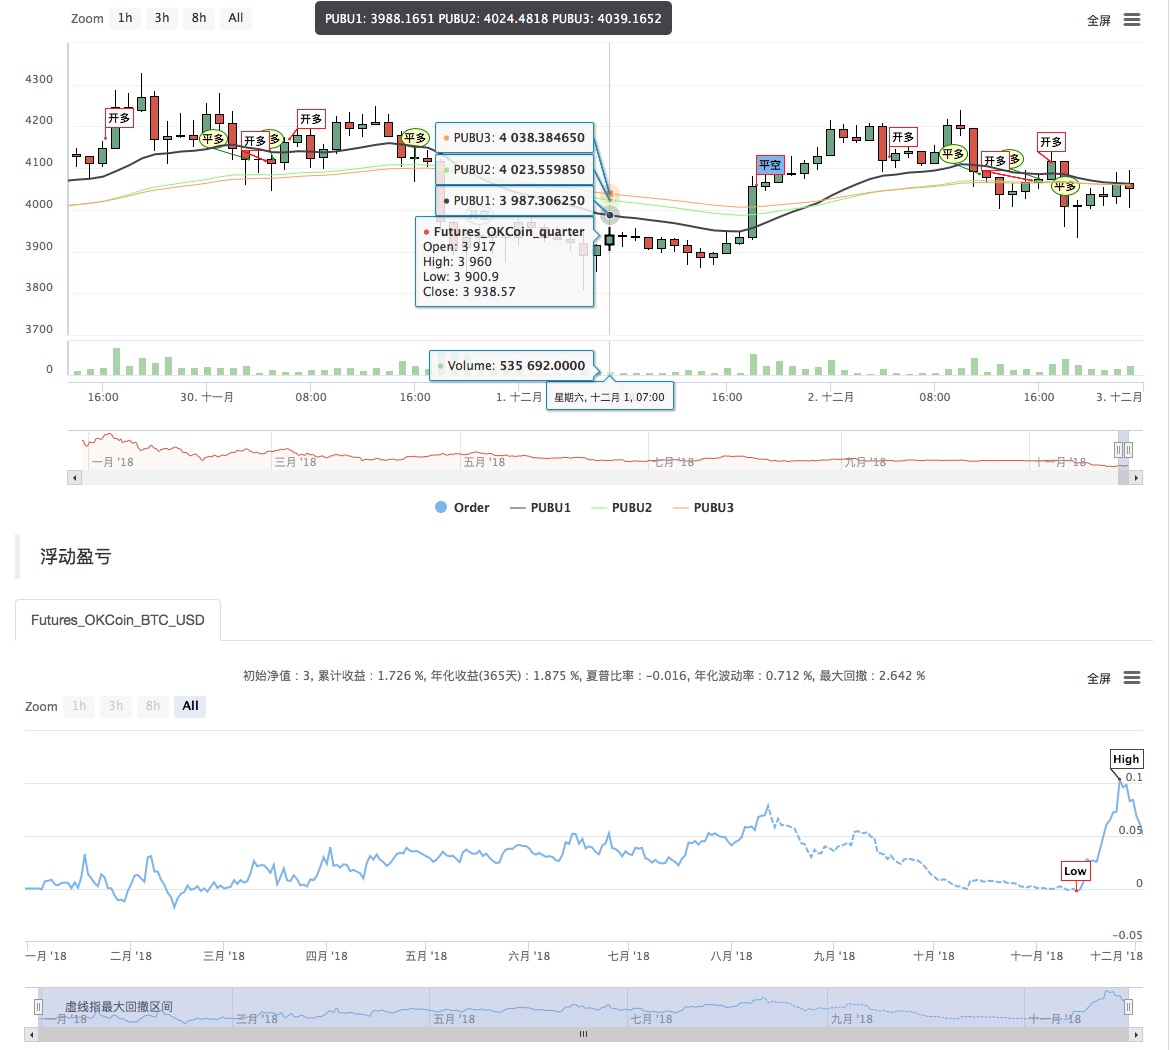
Now that we know the basic definition and principles of cascade, let's implement this strategy on the inventor quantification platform, programming language or choose a simple and easy to understand My language. Readers can expand or improve according to the following code.
- The name of the strategy: PUBU trading strategy on the waterfall
- Data cycle: 15M
- Supported by: Commodity Futures, Digital Currency

- Main chart
瀑布线1,公式:PUBU1^^(EMA(C,N1)+EMA(C,N12)+EMA(C,N14))/3;
瀑布线2,公式:PUBU2^^(EMA(C,N2)+EMA(C,N22)+EMA(C,N24))/3;
瀑布线3,公式:PUBU3^^(EMA(C,N3)+EMA(C,N32)+EMA(C,N34))/3;
My language source code:
// 指标
PUBU1^^(EMA(C,N1)+EMA(C,N1*2)+EMA(C,N1*4))/3;
PUBU2^^(EMA(C,N2)+EMA(C,N2*2)+EMA(C,N2*4))/3;
PUBU3^^(EMA(C,N3)+EMA(C,N3*2)+EMA(C,N3*4))/3;

BKVOL=0 AND BARPOS>N3 AND C>PUBU1 AND PUBU1>PUBU2 AND PUBU2>PUBU3,BPK;
SKVOL=0 AND BARPOS>N3 AND C<PUBU1 AND PUBU1<PUBU2 AND PUBU2<PUBU3,SPK;

C<PUBU3,SP(BKVOL);
C>PUBU3,BP(SKVOL);
C<PUBU2 AND PUBU1<PUBU2 AND C>BKPRICE,SP(BKVOL);
C>PUBU2 AND PUBU1>PUBU2 AND C<SKPRICE,BP(SKVOL);
AUTOFILTER;
For the source code of the policy, please see:https://www.fmz.com/strategy/128420
- Quantitative Practice of DEX Exchanges (2) -- Hyperliquid User Guide
- DEX exchange quantitative practices ((2) -- Hyperliquid user guide
- Quantitative Practice of DEX Exchanges (1) -- dYdX v4 User Guide
- Introduction to Lead-Lag Arbitrage in Cryptocurrency (3)
- DEX exchange quantitative practice ((1) -- dYdX v4 user guide
- Introduction to the Lead-Lag suite in digital currency (3)
- Introduction to Lead-Lag Arbitrage in Cryptocurrency (2)
- Introduction to the Lead-Lag suite in the digital currency (2)
- Discussion on External Signal Reception of FMZ Platform: A Complete Solution for Receiving Signals with Built-in Http Service in Strategy
- Discussing FMZ platform external signal reception: a complete set of strategies for the reception of signals from built-in HTTP services
- Introduction to Lead-Lag Arbitrage in Cryptocurrency (1)
- K-line data processing in programmatic transactions is trivial
- Quantitative trading strategies for price dynamics analysis with Python
- Timeline data analysis with Tick data retrieval
- The experience of developing trading strategies
- Calculation and application of DMI indicators
- Detailed usage and practical skills of energy tide(OBV) indicator in quantitative trading
- The development of CTA strategies and the inventor quantification platform standard library
- The use of a combination strategy for the strength and weakness of the RSI versus the straight line
- Upgrade Edition of Keltner Channel trading Strategy
- Neural network and digital currency quantitative trading series ((2)) Deep reinforcement learning training Bitcoin trading strategies
- Visualizing modules to build trading strategies - out
- KENTNA channel upgraded version of the KENTNA kingkeltner strategy
- Quantitative trading strategies with a trade index weighting
- Introducing the Aroon indicator
- The relative strengths and weaknesses of price-based quantitative trading strategies
- Introducing the adaptive moving average KAMA
- Implementation of Dual Thrust trading algorithms using My language on the inventor's quantification platform
- Introduction to RangeBreak Strategy
- Trading strategy based on box theory
- Trading strategies based on box theory that support commodity futures and digital currencies