Introduction to RangeBreak Strategy
 0
1530
0
1530
The RangeBreak strategy was originally derived from futures and foreign exchange trading and is a type of intraday breakthrough strategy. In the <>(US authoritative trading system selection magazine), it has been ranked in the top ten for many years. Both professional investment institutions and individual traders are widely used.
However, if a trading strategy is widely known to the public, then the application of this trading strategy in actual combat will be greatly reduced. Therefore, the purpose of this article is not to introduce the RangeBreak strategy for everyone to make a hard copy, but to learn from the RangeBreak strategy, let everyone integrate from a profitable trading system, improve the ability of trading.
The calculation method of RangeBreak strategy
The original RangeBreak strategy was the opening price of the day and the price volatility of yesterday to determine the long and short direction of today. The opening price of the day plus the price volatility of yesterday formed the upper track, and the opening price of the day minus the price volatility of yesterday formed the lower track. If the price rises above the upper limit, it will enter the market go long and if the price falls below the lower limit, it will enter the market and go short. There is no stop loss and take profit.
The Specific calculation formula are:
Upper rail = opening price of the day + (yesterday's highest price - yesterday's lowest price) x N
Lower track = opening price of the day - (yesterday's highest price - yesterday's lowest price) x N
The price rose above the upper rail, the long position opened
The price fell below the lower rail, the short position opened
When time close to market close, close all positions
Some readers may find that there is a variable N when calculating the upper and lower tracks, readers may wondering why the yesterday price fluctuations are multiplied by N, what does this N mean? In fact, the variable N here has no special meaning. The reason why a variable N is added to this place is that the trader can flexibly adjust the distance between the upper and lower rails according to the specific trading variety or the subjective experience of the individual. The parameter range can be from 0.1 to 1.5.
RangeBreak strategy source code
Open: fmz.com > Login > Dashboard > Strategy Library > New Strategy. In the upper left corner of the Strategy editing interface, click the drop-down box and select the programming language: My language to start writing the Strategy. Note the comments in the code below.
Q:=BARSLAST(DATE<>REF(DATE,1))+1; // Judge whether it is a new day's K line
DIFF:=REF(HHV(HIGH,Q),Q)-REF(LLV(LOW,Q),Q); // The price difference between the highest and lowest price yesterday
OO: VALUEWHEN (Q=1, OPEN); // Opening price of the day
UP: OO+DIFF*N; // upper rail
DOWN: OO-DIFF*N; // lower rail
TIME>=0905&&TIME<1455&&CLOSE>UP,BK; // long position open
TIME>=0905&&TIME<1455&&CLOSE<DOWN,SK; // short position open
TIME>=1455,CLOSEOUT; // close the position
AUTOFILTER; // signal filtering
RangeBreak strategy backtest
In order to get closer to the real trading environment, we used the 2 pips of slippage and 2 times of the transaction fee to test the pressure during the backtest. The test environment is as follows:
Trading variety: BTC to USDT Time: June 01, 2015 ~ June 28, 2019 Cycle: daily K-line Slippage: 2 pips for opening and closing positions Transaction Fee: 2 times of the exchange standard
Fund curve
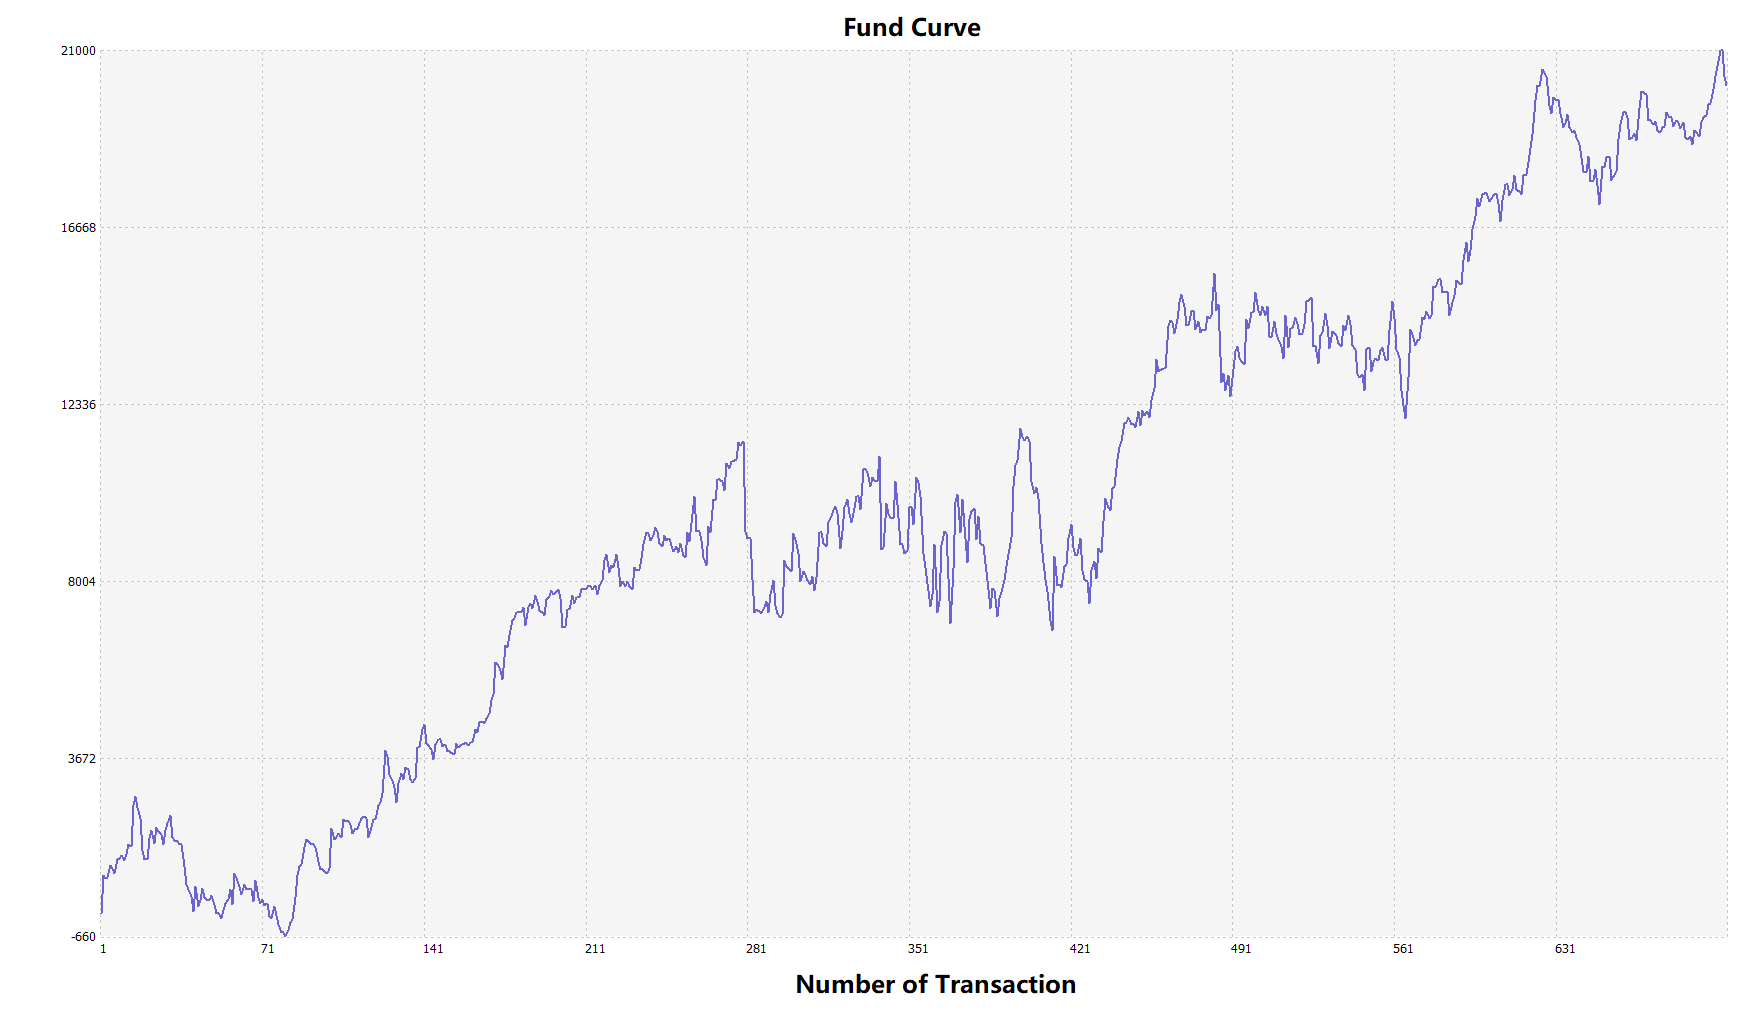
From the above backtest results, the strategy preforms very good when the market trend is smooth, whether in the rise or fall, the Aron indicator can completely track the market. The capital curve also showed an overall upward trend, and there was no significant retracement. However, in the volatile market, especially in the continuous shock market, there was a partial retracement.
RangeBreak strategy improvement
As shown in the above figure, the original RangeBreak strategy is not satisfactory even when the market trend is obvious, especially when the market is in a state of shock, the capital curve fluctuates greatly. When the market is in a long-term shock, there is a large retracement. Therefore, We know that RangeBreak is a trend-oriented strategy, and it also has the weakness of the trend strategy.
It is important to note that the original strategy used the simple yesterday’s highest price to subtract yesterday’s lowest price when calculating yesterday’s volatility. However, when calculating the price volatility, you can use the ATR indicator, because ATR represents the average real volatility of the price, such as the ATR used in the Turtle Trading Rules.
In addition, the price trend of cryptocurrency tends to rise slowly, and it falls more urgently when falling. So we can use N1 and N2 when calculating the upper and lower rails, which can make the strategy more flexible. Respond to different market conditions.
Strategy source code
Click to copy the full Strategy source code, based on My language, for commodity futures and digital currency
For more information, please check : https://www.fmz.com/strategy/156836
Summary
Just like the design concept of the RangeBreak strategy, never predict whether the market will eventually rise or fall, as long as the price breaks the upper and lower rails of the day, it indicates the direction of the market price trend that day, and traders only need to follow the signal. In addition, you can also improve according to your trading habits or market characteristics, upgrade and iterative this trading strategy.
- Upgrade Edition of Keltner Channel trading Strategy
- 神经网络与数字货币量化交易系列(2)——深度强化学习训练比特币交易策略
- 瀑布线交易策略在发明者量化平台的实现与应用
- 可视化模块搭建交易策略--浅出
- 肯特纳通道升级版金肯特纳kingkeltner策略
- 运用成交量指数加权的量化交易策略
- Introducing the Aroon indicator
- 基于价格的相对强弱量化交易策略
- Introducing the adaptive moving average KAMA
- 在发明者量化平台使用My语言实现Dual Thrust交易算法
- Trading strategy based on box theory
- 基于箱体理论的交易策略,支持商品期货和数字货币
- 恒温器策略在发明者量化平台的实践与应用
- 均幅指标策略框架
- 初学者在数字货币量化交易中的6种简单策略及实践
- 可视化模块搭建交易策略--进阶
- Pivot Point日内交易系统
- 量化交易中的三大潜力模型
- RangeBreak策略与波动率相结合的实战应用
- 神经网络与数字货币量化交易系列(1)——LSTM预测比特币价格