Research on Binance Futures Multi-currency Hedging Strategy Part 1
Author: Goodness, Created: 2020-05-09 11:14:50, Updated: 2023-11-04 19:49:01
Research on Binance Futures Multi-currency Hedging Strategy Part 1
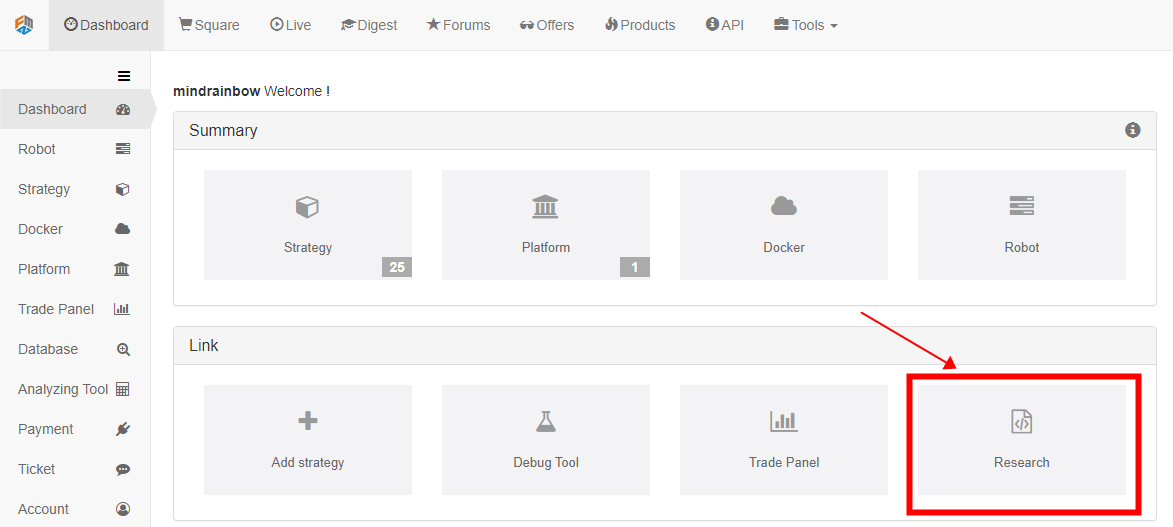
Click the research button on the Dashboard page, and then click the arrow to enter. Open the uploaded .pynb suffix file and press shift + enter to run line by line. There are basic tutorials in the usage help of the research environment.
Strategy reasons
Binance has listed many altcoins on the spot. Although the short-term fluctuations are uncertain, if you look at the daily line for a long time, you will find that they have basically fallen by more than 90%, and some even only have fractions of the highest price fraction. However, there is no universal short selling method for the spot, and there is no special recommendation except for not touching the altcoin. In the past two months, Binance Futures has launched more than 20 perpetual contracts, most of which are mainstream currencies, and some are unknown. This gives us the means to short these altcoin combinations. Using the correlation coefficient between altcoins and BTC will be a effective analysis method, two strategies can be designed.
Strategy principles
The first strategy: Selling short the selected basket of altcoins in a decentralized equivalent, and at the same time buy long the same amount of position BTC to hedge, in order to reduce risks and volatility. As prices fluctuate, constantly adjust positions to keep short positions values constant and equal to long positions. Essentially it is a operation that selling short the altcoin-bitcoin price index.
The second strategy: shorting currencies with a price higher than the altcoin-bitcoin price index, and longing with currencies lower than the index, the greater the deviation, the greater the position. At the same time, hedging unhedged positions with BTC (or not).
# Libraries to import
import pandas as pd
import requests
import matplotlib.pyplot as plt
import seaborn as sns
import numpy as np
%matplotlib inline
Screen the required currency
The Binance perpetual contract currently listed currencies, which can be obtained by using its API interface, are total number of 23 (excluding BTC).
#Info = requests.get('https://fapi.binance.com/fapi/v1/exchangeInfo')
#symbols = [symbol_info['baseAsset'] for symbol_info in Info.json()['symbols']]
symbols = ['ETH', 'BCH', 'XRP', 'EOS', 'LTC', 'TRX', 'ETC', 'LINK', 'XLM', 'ADA', 'XMR', 'DASH', 'ZEC', 'XTZ', 'BNB', 'ATOM', 'ONT', 'IOTA', 'BAT', 'VET', 'NEO', 'QTUM', 'IOST']
First, let ’s study the price movement of altcoins to Bitcoin in the past year. I have downloaded the data in advance and posted it to the forum, which can be directly cited in the research environment.
price_btc = pd.read_csv('https://www.fmz.com/upload/asset/1ef1af8ec28a75a2dcb.csv', index_col = 0)
price_btc.index = pd.to_datetime(price_btc.index,unit='ms') #Index date
price_btc.tail()
Results:
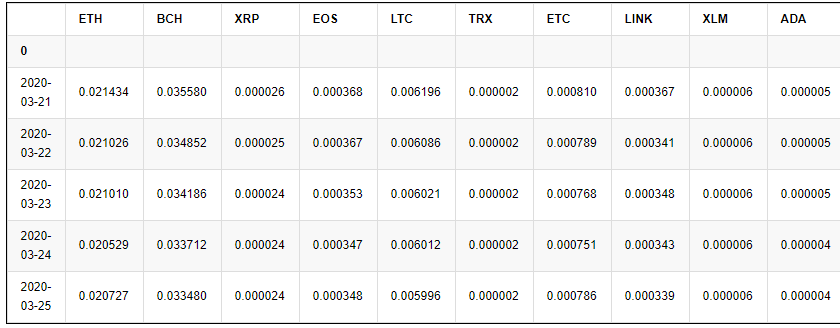
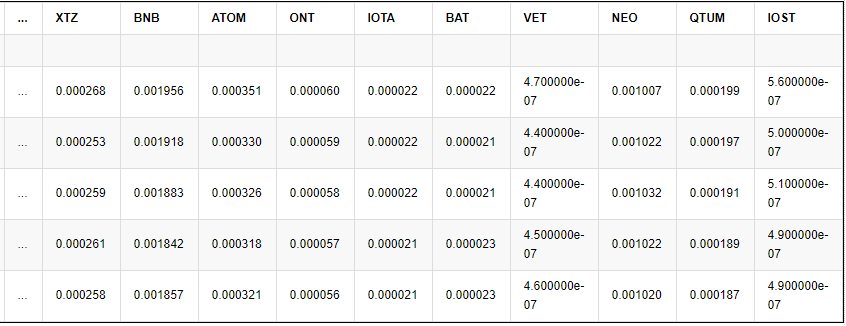
5 rows × 23 columns
First draw the prices of these currencies to see the trend, the data should be normalized. It can be seen that except for four currencies, the price trends of the other currencies are basically the same, showing a downward trend.
price_btc_norm = price_btc/price_btc.fillna(method='bfill').iloc[0,]
price_btc_norm.plot(figsize=(16,6),grid = True,legend=False);
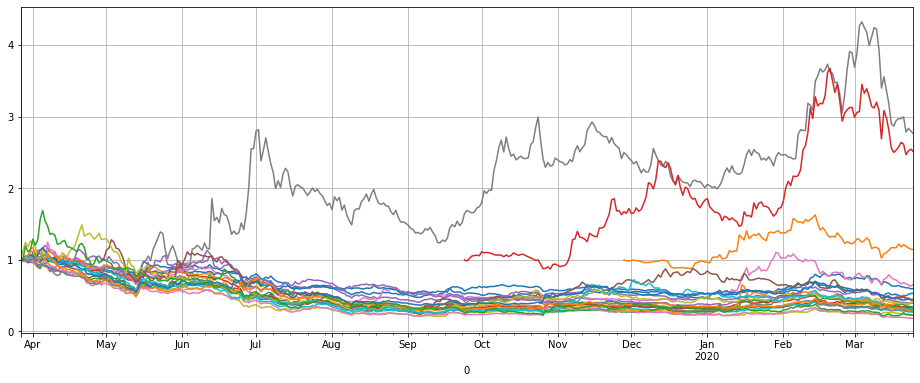
By sorting the last price changes, you can find several coins that are obviously different, namely LINK, XTZ, BCH, ETH. Explain that they can often running their own trend, and shorting them has a higher risk and needs to be excluded from the strategy.
Draw a heat map of the correlation coefficient of the remaining currencies, and find that the trend of ETC and ATOM is also relatively special and can be excluded.
price_btc_norm.iloc[-1,].sort_values()[-5:]
Results:
ETH     0.600417
ETC     0.661616
BCH     1.141961
XTZ     2.512195
LINK    2.764495
Name: 2020-03-25 00:00:00, dtype: float64
trade_symbols = list(set(symbols)-set(['LINK','XTZ','BCH', 'ETH'])) # Remaining currencies
plt.subplots(figsize=(12, 12)) # Set the screen size
sns.heatmap(price_btc[trade_symbols].corr(), annot=True, vmax=1, square=True, cmap="Blues");
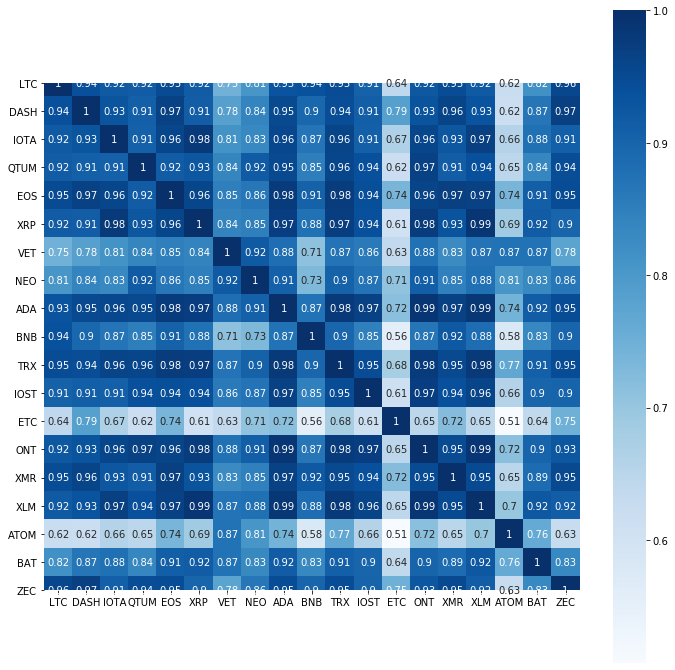
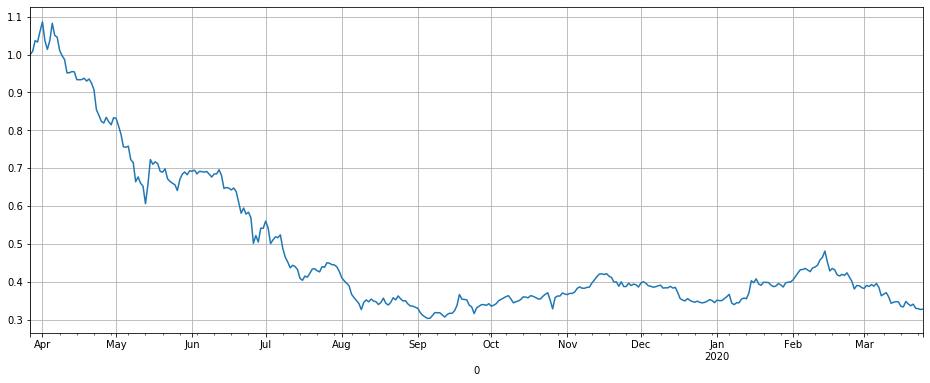
The last remaining currency fell by an average of 66% a year, obviously there is ample room for shorting. Synthesizing the trend of these coins into the altcoin price index, it was found that it basically fell all the way, it was more stable in the second half of last year, and began to fall all the way this year. This study screened out ‘LINK’, ‘XTZ’, ‘BCH’, ‘ETH’, ‘ETC’, ‘ATOM’, ‘BNB’, ‘EOS’, ‘LTC’ did not participate in the short of the first strategy, specific details can be backtest by yourself.
It should be noted that the current altcoin index is at the low point of the past year. Perhaps it is not a short opportunity, rather a buying long opportunity. you have to decide it by yourself.
trade_symbols = list(set(symbols)-set(['LINK','XTZ','BCH', 'ETH', 'ETC','ATOM','BNB','EOS','LTC'])) # You can set the remaining currencies, which you want to subtract.
1-price_btc_norm[trade_symbols].iloc[-1,].mean()
Results:
0.6714306758250285
price_btc_norm[trade_symbols].mean(axis=1).plot(figsize=(16,6),grid = True,legend=False);
Binance Sustainability Data
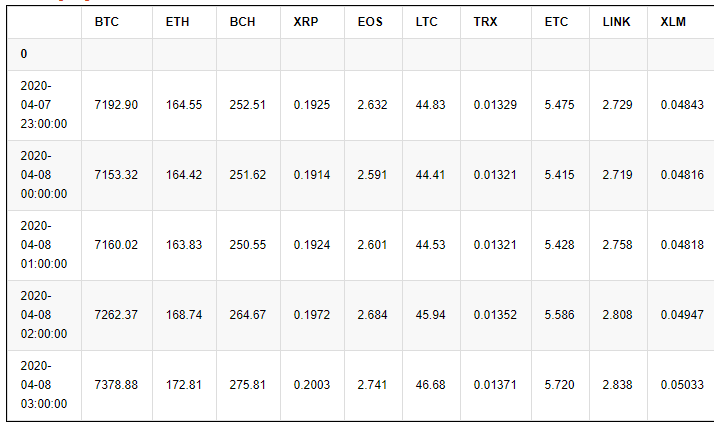
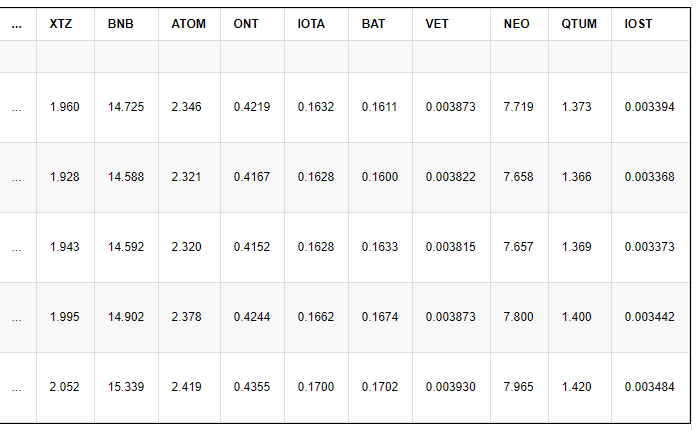
Similarly, the data on Binance Sustainability has been collated, you can also directly quote it in your notebook, the data is the 1h market K line from January 28 to March 31, 2020, because most of Binance perpetual contract have been lunched only two months, so the data is sufficient for backtest.
price_usdt = pd.read_csv('https://www.fmz.com/upload/asset/20227de6c1d10cb9dd1.csv ', index_col = 0)
price_usdt.index = pd.to_datetime(price_usdt.index)
price_usdt.tail()
Results:
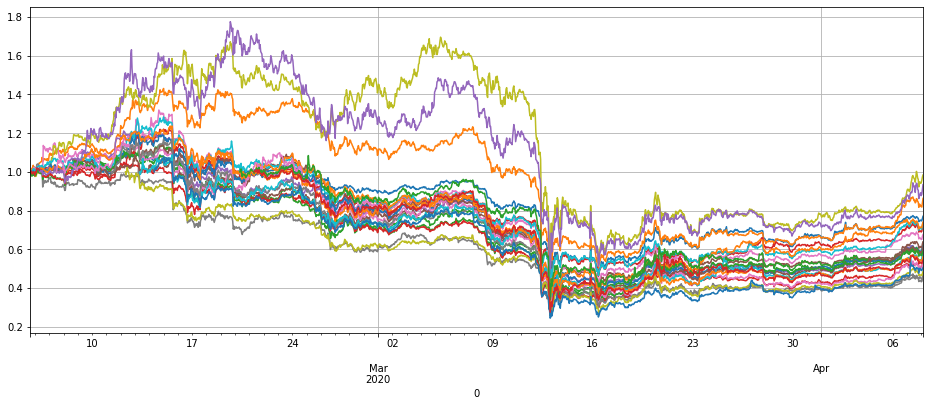
First look at the overall trend with normalized data. In the March plunge, relative to the price in early February, the price was generally cut, showing that the risk of perpetual contract is also very high. This wave of decline is also a big challenge test for the strategy.
price_usdt_norm = price_usdt/price_usdt.fillna(method='bfill').iloc[0,]
price_usdt_norm.plot(figsize=(16,6),grid = True,legend=False);
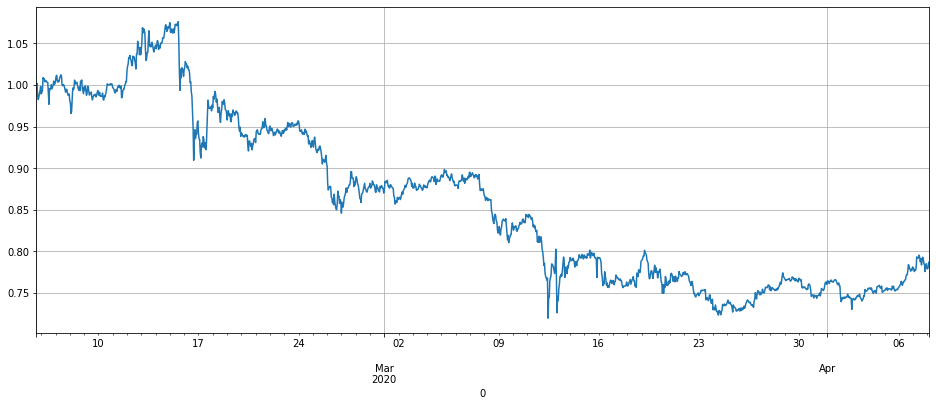
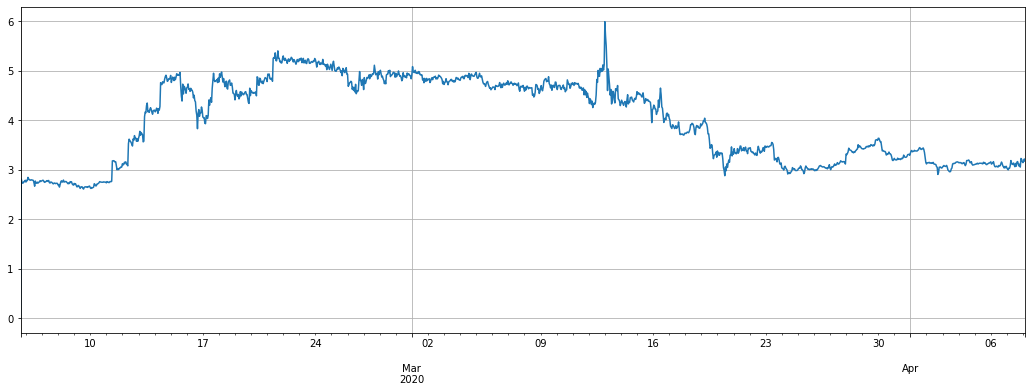
Draw the index price of the coin we want to sell against Bitcoin, the strategy principle is to short this curve, and the return is basically the reverse of this curve.
price_usdt_btc = price_usdt.divide(price_usdt['BTC'],axis=0)
price_usdt_btc_norm = price_usdt_btc/price_usdt_btc.fillna(method='bfill').iloc[0,]
price_usdt_btc_norm[trade_symbols].mean(axis=1).plot(figsize=(16,6),grid = True);
#price_usdt_btc_norm.mean(axis=1).plot(figsize=(16,6),grid = True,legend=False);
Backtest engine
Because the FMZ local backtest does not have data for all currencies and does not support multi-currency backtest, it is necessary to reimplement a backtest engine. So i wrote a new backtest engine, it is relatively simple, but basically enough. Taking into account the transaction fee, but basically ignored the capital rate, did not consider the situation of maintaining the margin capital. The total equity, occupied margin, and leverage were recorded. Since this strategy has the attribute that long position equals short position, so the impact of capital rates is not significant.
The backtest does not take into account the price slippage situation, you can increase the transaction fee simulation by yourself, considering the low transaction fee of Binance maker, even the price gap difference in the unpopular currency market is very small, you can use the iceberg commission method in the real market when placing an order, the impact should not be significant.
When creating an exchange object, you need to specify the currency to be traded. Buy is long and Sell is short. Due to the perpetual contract limitation, when opening position, the long and short positions are automatically closed together. When selling short position and the number of currencies are negative. The parameters are as follows:
- trade_symbols: list of currencies to be traded
- leverage: leverage, affect margin,
- commission: transaction fee, default 0.00005
- initial_balance: initial asset, USDT valuation
- log: whether to print transaction records
class Exchange:

    def __init__(self, trade_symbols, leverage=20, commission=0.00005,  initial_balance=10000, log=False):
        self.initial_balance = initial_balance # Initial asset
        self.commission = commission
        self.leverage = leverage
        self.trade_symbols = trade_symbols
        self.date = ''
        self.log = log
        self.df = pd.DataFrame(columns=['margin','total','leverage','realised_profit','unrealised_profit'])
        self.account = {'USDT':{'realised_profit':0, 'margin':0, 'unrealised_profit':0, 'total':initial_balance, 'leverage':0}}
        for symbol in trade_symbols:
            self.account[symbol] = {'amount':0, 'hold_price':0, 'value':0, 'price':0, 'realised_profit':0, 'margin':0, 'unrealised_profit':0}

    def Trade(self, symbol, direction, price, amount, msg=''):
        if self.date and self.log:
            print('%-20s%-5s%-5s%-10.8s%-8.6s %s'%(str(self.date), symbol, 'buy' if direction == 1 else 'sell', price, amount, msg))

        cover_amount = 0 if direction*self.account[symbol]['amount'] >=0 else min(abs(self.account[symbol]['amount']), amount)
        open_amount = amount - cover_amount

        self.account['USDT']['realised_profit'] -= price*amount*self.commission # Minus transaction fee

        if cover_amount > 0: # close position first
            self.account['USDT']['realised_profit'] += -direction*(price - self.account[symbol]['hold_price'])*cover_amount  # profit
            self.account['USDT']['margin'] -= cover_amount*self.account[symbol]['hold_price']/self.leverage # Free the margin

            self.account[symbol]['realised_profit'] += -direction*(price - self.account[symbol]['hold_price'])*cover_amount
            self.account[symbol]['amount'] -= -direction*cover_amount
            self.account[symbol]['margin'] -=  cover_amount*self.account[symbol]['hold_price']/self.leverage
            self.account[symbol]['hold_price'] = 0 if self.account[symbol]['amount'] == 0 else self.account[symbol]['hold_price']

        if open_amount > 0:
            total_cost = self.account[symbol]['hold_price']*direction*self.account[symbol]['amount'] + price*open_amount
            total_amount = direction*self.account[symbol]['amount']+open_amount

            self.account['USDT']['margin'] +=  open_amount*price/self.leverage
            self.account[symbol]['hold_price'] = total_cost/total_amount
            self.account[symbol]['amount'] += direction*open_amount
            self.account[symbol]['margin'] +=  open_amount*price/self.leverage

        self.account[symbol]['unrealised_profit'] = (price - self.account[symbol]['hold_price'])*self.account[symbol]['amount']
        self.account[symbol]['price'] = price
        self.account[symbol]['value'] = abs(self.account[symbol]['amount'])*price

        return True

    def Buy(self, symbol, price, amount, msg=''):
        self.Trade(symbol, 1, price, amount, msg)

    def Sell(self, symbol, price, amount, msg=''):
        self.Trade(symbol, -1, price, amount, msg)

    def Update(self, date, close_price): # Update assets
        self.date = date
        self.close = close_price
        self.account['USDT']['unrealised_profit'] = 0
        for symbol in self.trade_symbols:
            if np.isnan(close_price[symbol]):
                continue
            self.account[symbol]['unrealised_profit'] = (close_price[symbol] - self.account[symbol]['hold_price'])*self.account[symbol]['amount']
            self.account[symbol]['price'] = close_price[symbol]
            self.account[symbol]['value'] = abs(self.account[symbol]['amount'])*close_price[symbol]
            self.account['USDT']['unrealised_profit'] += self.account[symbol]['unrealised_profit']
            if self.date.hour in [0,8,16]:
                pass
                self.account['USDT']['realised_profit'] += -self.account[symbol]['amount']*close_price[symbol]*0.01/100

        self.account['USDT']['total'] = round(self.account['USDT']['realised_profit'] + self.initial_balance + self.account['USDT']['unrealised_profit'],6)
        self.account['USDT']['leverage'] = round(self.account['USDT']['margin']/self.account['USDT']['total'],4)*self.leverage
        self.df.loc[self.date] = [self.account['USDT']['margin'],self.account['USDT']['total'],self.account['USDT']['leverage'],self.account['USDT']['realised_profit'],self.account['USDT']['unrealised_profit']]
# First test the backtest engine
e = Exchange(['BTC','XRP'],initial_balance=10000,commission=0,log=True)

e.Buy('BTC',100, 5)
e.Sell('XRP',10, 50)

e.Sell('BTC',105,e.account['BTC']['amount'])
e.Buy('XRP',9,-e.account['XRP']['amount'])

round(e.account['USDT']['realised_profit'],4)
75.0
The first strategy code
Strategy logic:
- Check the currency price, if not “nan”, you can trade
- Check the value of the altcoin contract. If it is less than the target value trade_value, the corresponding difference will be short sold, and if it is greater, the corresponding amount will be bought to close the position.
- Add the short value of all altcoins and adjust the BTC position to hedge against it.
The short trade_value position determines the size of the position. Setting log = True will print the transaction log
# Need to hedge with BTC
trade_symbols = list(set(symbols)-set(['LINK','XTZ','BCH', 'ETH', 'ETC','ATOM','BNB','EOS','LTC'])) # Remaining currencies
e = Exchange(trade_symbols+['BTC'],initial_balance=10000,commission=0.0005,log=False)
trade_value = 2000
for row in price_usdt.iloc[:].iterrows():
    e.Update(row[0], row[1])
    empty_value = 0
    for symbol in trade_symbols:
        price = row[1][symbol]
        if np.isnan(price):
            continue
        if e.account[symbol]['value'] - trade_value  < -20 :
            e.Sell(symbol, price, round((trade_value-e.account[symbol]['value'])/price, 6),round(e.account[symbol]['realised_profit']+e.account[symbol]['unrealised_profit'],2))
        if e.account[symbol]['value'] - trade_value > 20 :
            e.Buy(symbol, price, round((e.account[symbol]['value']-trade_value)/price, 6),round(e.account[symbol]['realised_profit']+e.account[symbol]['unrealised_profit'],2))
        empty_value += e.account[symbol]['value']
    price = row[1]['BTC']
    if e.account['BTC']['value'] - empty_value < -20:
        e.Buy('BTC', price, round((empty_value-e.account['BTC']['value'])/price,6),round(e.account['BTC']['realised_profit']+e.account['BTC']['unrealised_profit'],2))
    if e.account['BTC']['value'] - empty_value > 20:
        e.Sell('BTC', price, round((e.account['BTC']['value']-empty_value)/price,6),round(e.account['BTC']['realised_profit']+e.account['BTC']['unrealised_profit'],2))
stragey_1 = e
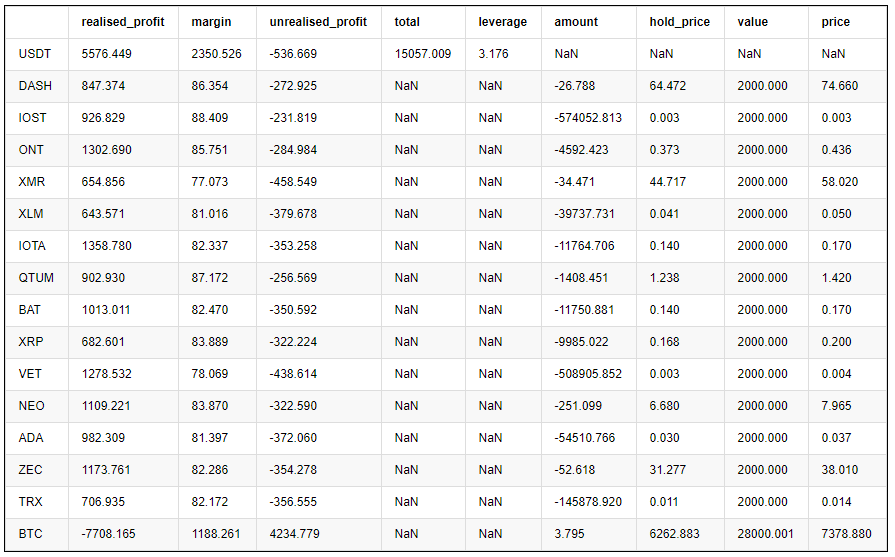
The final profit of each currency is as follows:
pd.DataFrame(stragey_1.account).T.apply(lambda x:round(x,3))
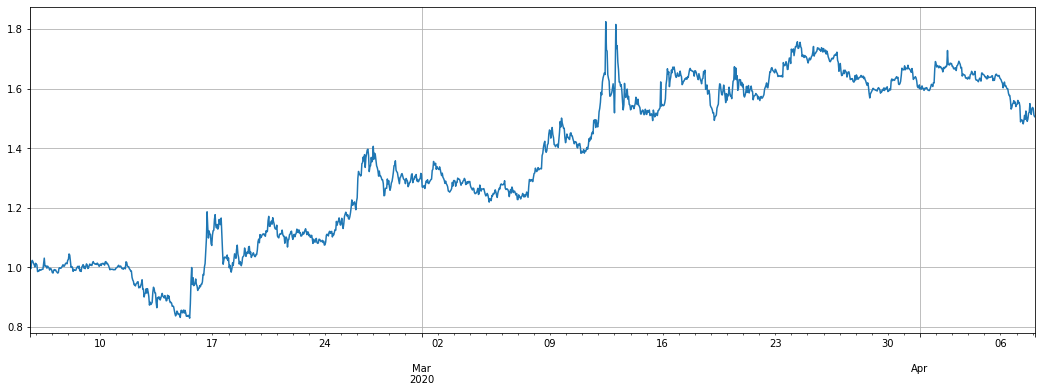
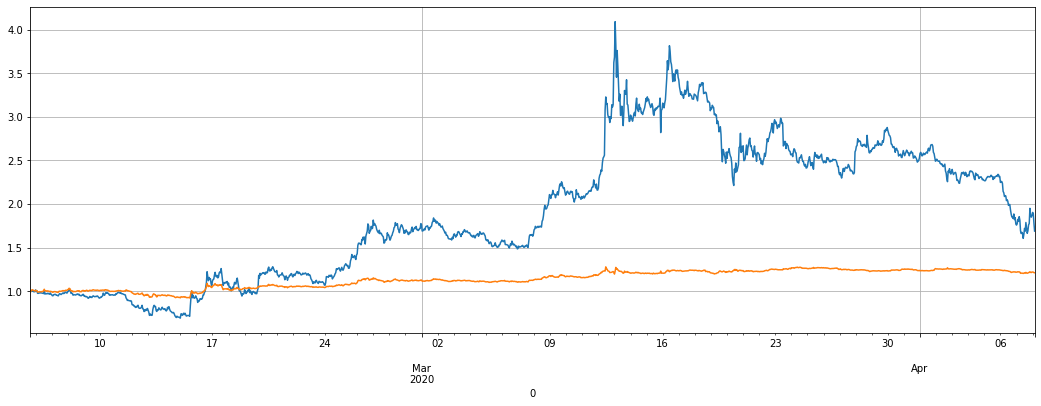
The two graphs below are the net worth curve and the leverage used.
The yellow in the net worth curve is the effect of 1x leverage shorting the altcoin index. It can be seen that the strategy basically amplifies the fluctuation of the index, which is in line with expectations. The final two-month return is 60%, the maximum retracement is 20%, and the maximum leverage is about 8 times. Most of the time, it is less than 6 times. It is still safe. Most importantly, complete hedging has made the strategy lose little in the March 12th plunge.
When the short-selling currency price rises and the contract value increases, the position is reduced, on the other hand, when gaining profit, the position is increased. This keeps the total value of the contract constant, even if the skyrocketing falls have limited losses.
But the risks were also mentioned earlier, altcoins are very likely to run their own trend, and may rise a lot from the bottom. It depends on how to use it. If you are optimistic about the altcoin and think that it has reached the bottom, you can operate in the direction and buying long this index. Or if you are optimistic about certain currencies, you can hedge with them.
(stragey_1.df['total']/stragey_1.initial_balance).plot(figsize=(18,6),grid = True); # Net worth curve
#(2-price_usdt_btc_norm[trade_symbols].mean(axis=1)).plot(figsize=(18,6),grid = True);
# Strategy leverage
stragey_1.df['leverage'].plot(figsize=(18,6),grid = True);
In addition, since the price of the altcoin against the USDT also fell, the extreme plan is not hedged, directly selling short, but the fluctuation is very large and the retracement is high
trade_symbols = list(set(symbols)-set(['LINK','XTZ','BCH', 'ETH', 'ETC','ATOM','BNB','EOS','LTC'])) # Remaining currencies
e = Exchange(trade_symbols+['BTC'],initial_balance=10000,commission=0.0005,log=False)
trade_value = 2000
for row in price_usdt.iloc[:].iterrows():
    e.Update(row[0], row[1])
    empty_value = 0
    for symbol in trade_symbols:
        price = row[1][symbol]
        if np.isnan(price):
            continue
        if e.account[symbol]['value'] - trade_value  < -20 :
            e.Sell(symbol, price, round((trade_value-e.account[symbol]['value'])/price, 6),round(e.account[symbol]['realised_profit']+e.account[symbol]['unrealised_profit'],2))
        if e.account[symbol]['value'] - trade_value > 20 :
            pass
            #e.Buy(symbol, price, round((e.account[symbol]['value']-trade_value)/price, 6),round(e.account[symbol]['realised_profit']+e.account[symbol]['unrealised_profit'],2))
        empty_value += e.account[symbol]['value']
stragey_1b = e
(stragey_1b.df['total']/stragey_1.initial_balance).plot(figsize=(18,6),grid = True); # Net worth curve
(2-price_usdt_btc_norm[trade_symbols].mean(axis=1)).plot(figsize=(18,6),grid = True);
The second strategy code
Strategy logic:
- Check if there is a price or there is a price to trade
- Check the deviation of the currency price from the index
- Go long and short based on the deviation judgment, and judge the position according to the deviation size
- Calculate unhedged positions and hedge with BTC
Trade_value also controls the size of open positions. You can also modify the conversion factor of diff/0.001
trade_symbols = list(set(symbols)-set(['LINK','XTZ','BCH', 'ETH'])) # Remaining currencies
price_usdt_btc_norm_mean = price_usdt_btc_norm[trade_symbols].mean(axis=1)
e = Exchange(trade_symbols+['BTC'],initial_balance=10000,commission=0.0005,log=False)
trade_value = 300
for row in price_usdt.iloc[:].iterrows():
    e.Update(row[0], row[1])
    empty_value = 0
    for symbol in trade_symbols:
        price = row[1][symbol]
        if np.isnan(price):
            continue
        diff = price_usdt_btc_norm.loc[row[0],symbol] - price_usdt_btc_norm_mean[row[0]]
        aim_value = -trade_value*round(diff/0.01,0)
        now_value = e.account[symbol]['value']*np.sign(e.account[symbol]['amount'])
        empty_value += now_value
        if aim_value - now_value > 50:
            e.Buy(symbol, price, round((aim_value - now_value)/price, 6),round(e.account[symbol]['realised_profit']+e.account[symbol]['unrealised_profit'],2))
        if aim_value - now_value < -50:
            e.Sell(symbol, price, -round((aim_value - now_value)/price, 6),round(e.account[symbol]['realised_profit']+e.account[symbol]['unrealised_profit'],2))
    price = row[1]['BTC']
    aim_value = -empty_value
    now_value = e.account['BTC']['value']*np.sign(e.account['BTC']['amount'])
    if aim_value - now_value > 50:
        e.Buy('BTC', price, round((aim_value - now_value)/price, 6),round(e.account['BTC']['realised_profit']+e.account['BTC']['unrealised_profit'],2))
    if aim_value - now_value < -50:
        e.Sell('BTC', price, -round((aim_value - now_value)/price, 6),round(e.account['BTC']['realised_profit']+e.account['BTC']['unrealised_profit'],2))
stragey_2 = e
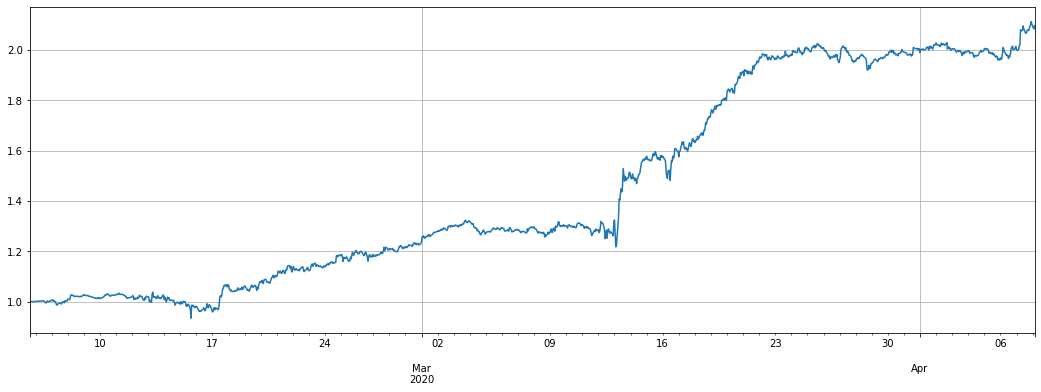
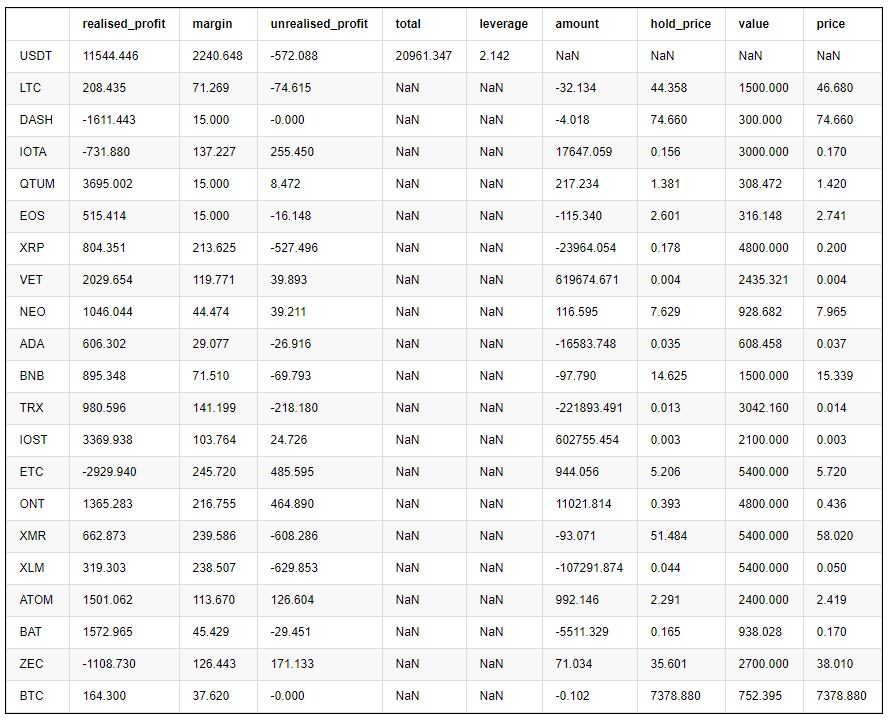
The return of the second strategy is much better than the first strategy. In the past two months, it has 100% return, but still has a 20% retracement. In the past week, due to the small market fluctuations, the return is not obvious. The overall leverage is not much. This strategy is worth trying. Depending on the degree of deviation, more than 7800 USDT position was opened at most.
Note that if a currency runs out a independent trend, for example, it has increased several times relative to the index, it will accumulate a large number of short positions in the currency, and the same sharp decline will also make the strategy to buy long, which can limit the maximum opening position.
(stragey_2.df['total']/stragey_2.initial_balance).plot(figsize=(18,6),grid = True);
# Summary results by currency
pd.DataFrame(e.account).T.apply(lambda x:round(x,3))
e.df['leverage'].plot(figsize=(18,6),grid = True);
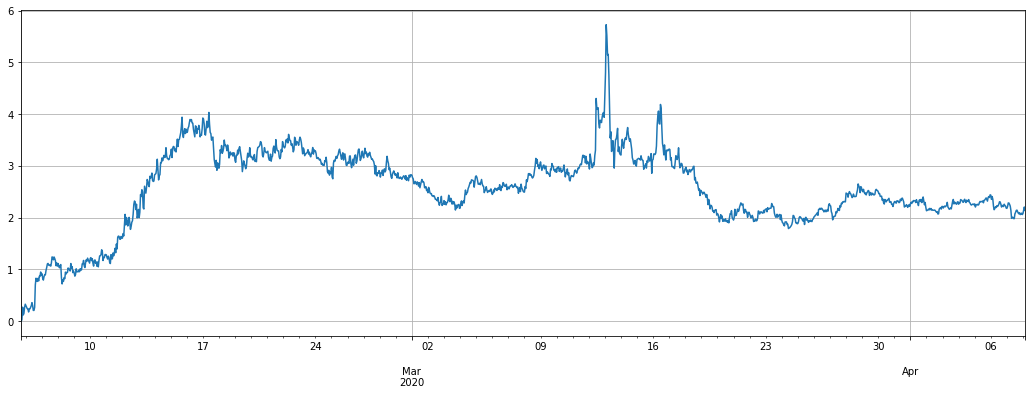
If the result of not hedging is as follows, the difference is actually not much. Because long and short positions are basically balanced.
trade_symbols = list(set(symbols)-set(['LINK','XTZ','BCH', 'ETH'])) # Remaining currencies
price_usdt_btc_norm_mean = price_usdt_btc_norm[trade_symbols].mean(axis=1)
e = Exchange(trade_symbols,initial_balance=10000,commission=0.0005,log=False)
trade_value = 300
for row in price_usdt.iloc[:].iterrows():
    e.Update(row[0], row[1])
    empty_value = 0
    for symbol in trade_symbols:
        price = row[1][symbol]
        if np.isnan(price):
            continue
        diff = price_usdt_btc_norm.loc[row[0],symbol] - price_usdt_btc_norm_mean[row[0]]
        aim_value = -trade_value*round(diff/0.01,1)
        now_value = e.account[symbol]['value']*np.sign(e.account[symbol]['amount'])
        empty_value += now_value
        if aim_value - now_value > 20:
            e.Buy(symbol, price, round((aim_value - now_value)/price, 6),round(e.account[symbol]['realised_profit']+e.account[symbol]['unrealised_profit'],2))
        if aim_value - now_value < -20:
            e.Sell(symbol, price, -round((aim_value - now_value)/price, 6),round(e.account[symbol]['realised_profit']+e.account[symbol]['unrealised_profit'],2))
stragey_2b = e
(stragey_2b.df['total']/stragey_2.initial_balance).plot(figsize=(18,6),grid = True);
#(stragey_2.df['total']/stragey_2.initial_balance).plot(figsize=(18,6),grid = True); # Can be stacked together
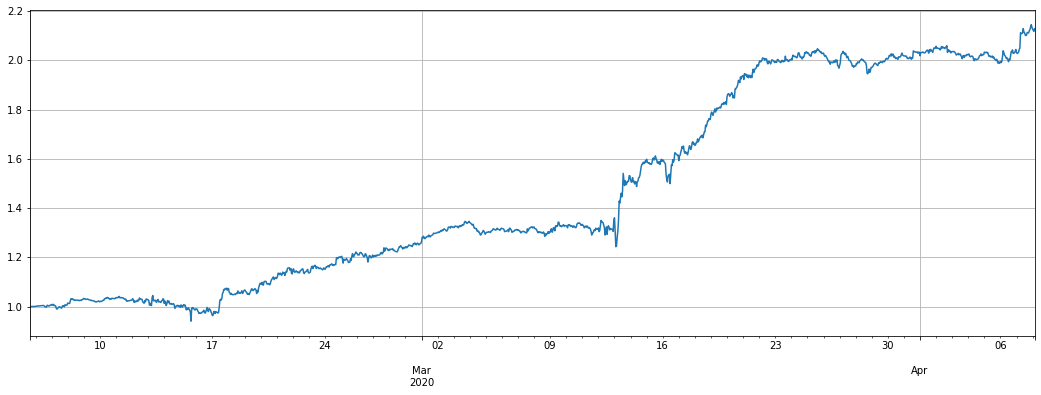
If you refer to the USDT price regression, the effect will be much worse
trade_symbols = list(set(symbols)-set(['LINK','XTZ','BCH', 'ETH']))+['BTC'] #Remaining currencies
price_usdt_norm_mean = price_usdt_norm[trade_symbols].mean(axis=1)
e = Exchange(trade_symbols,initial_balance=10000,commission=0.0005,log=False)
trade_value = 300
for row in price_usdt.iloc[:].iterrows():
    e.Update(row[0], row[1])
    empty_value = 0
    for symbol in trade_symbols+['BTC']:
        price = row[1][symbol]
        if np.isnan(price):
            continue
        diff = price_usdt_norm.loc[row[0],symbol] - price_usdt_norm_mean[row[0]]
        aim_value = -trade_value*round(diff/0.01,1)
        now_value = e.account[symbol]['value']*np.sign(e.account[symbol]['amount'])
        empty_value += now_value
        if aim_value - now_value > 20:
            e.Buy(symbol, price, round((aim_value - now_value)/price, 6),round(e.account[symbol]['realised_profit']+e.account[symbol]['unrealised_profit'],2))
        if aim_value - now_value < -20:
            e.Sell(symbol, price, -round((aim_value - now_value)/price, 6),round(e.account[symbol]['realised_profit']+e.account[symbol]['unrealised_profit'],2))
stragey_2c = e
(stragey_2c.df['total']/stragey_2.initial_balance).plot(figsize=(18,6),grid = True);
(stragey_2b.df['total']/stragey_2.initial_balance).plot(figsize=(18,6),grid = True);
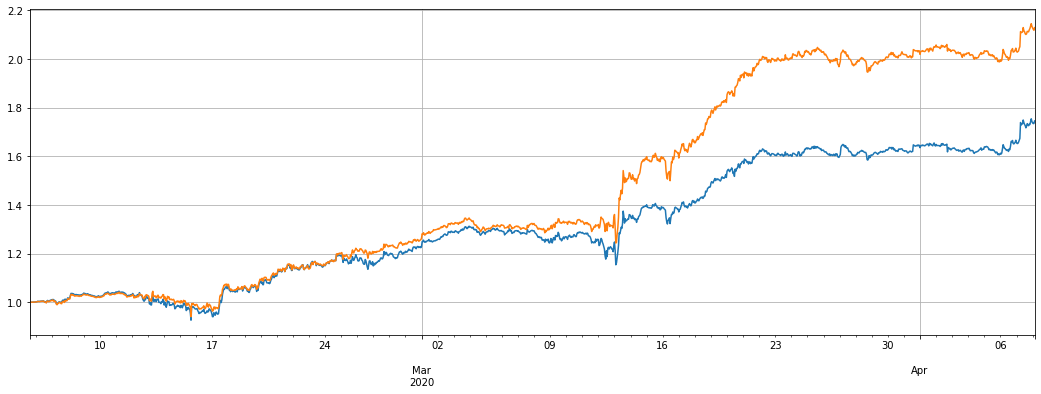
If you limit the maximum position value, the performance will be worse
trade_symbols = list(set(symbols)-set(['LINK','XTZ','BCH', 'ETH'])) #Remaining currencies
price_usdt_btc_norm_mean = price_usdt_btc_norm[trade_symbols].mean(axis=1)
e = Exchange(trade_symbols+['BTC'],initial_balance=10000,commission=0.0005,log=False)
trade_value = 300
for row in price_usdt.iloc[:].iterrows():
    e.Update(row[0], row[1])
    empty_value = 0
    for symbol in trade_symbols:
        price = row[1][symbol]
        if np.isnan(price):
            continue
        diff = price_usdt_btc_norm.loc[row[0],symbol] - price_usdt_btc_norm_mean[row[0]]
        aim_value = -trade_value*round(diff/0.01,1)
        now_value = e.account[symbol]['value']*np.sign(e.account[symbol]['amount'])
        empty_value += now_value
        if aim_value - now_value > 20 and abs(aim_value)<3000:
            e.Buy(symbol, price, round((aim_value - now_value)/price, 6),round(e.account[symbol]['realised_profit']+e.account[symbol]['unrealised_profit'],2))
        if aim_value - now_value < -20 and abs(aim_value)<3000:
            e.Sell(symbol, price, -round((aim_value - now_value)/price, 6),round(e.account[symbol]['realised_profit']+e.account[symbol]['unrealised_profit'],2))
    price = row[1]['BTC']
    aim_value = -empty_value
    now_value = e.account['BTC']['value']*np.sign(e.account['BTC']['amount'])
    if aim_value - now_value > 20:
        e.Buy('BTC', price, round((aim_value - now_value)/price, 6),round(e.account['BTC']['realised_profit']+e.account['BTC']['unrealised_profit'],2))
    if aim_value - now_value < -20:
        e.Sell('BTC', price, -round((aim_value - now_value)/price, 6),round(e.account['BTC']['realised_profit']+e.account['BTC']['unrealised_profit'],2))
stragey_2d = e
(stragey_2d.df['total']/stragey_2.initial_balance).plot(figsize=(17,6),grid = True);
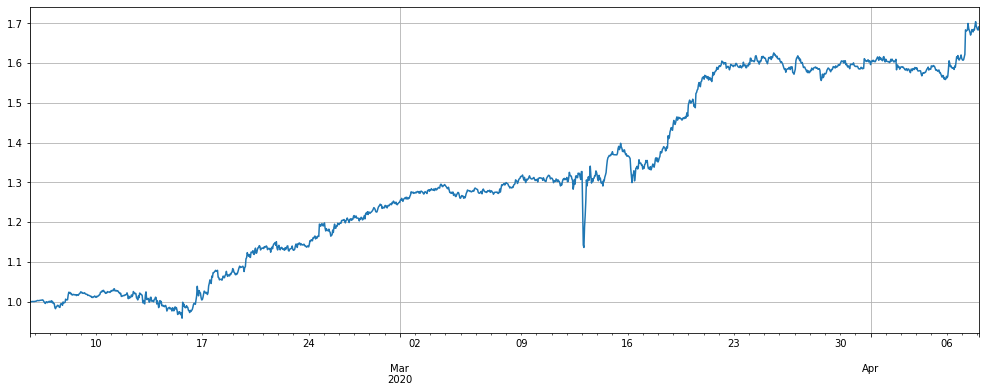
Summary and Risk
The first strategy takes advantage of the fact that the overall value of altcoins is not as good as bitcoin. If you buying long bitcoins, you may wish to stick to this strategy for a long time. Due to the long and short positions equivalence, you are basically not afraid of the funding rate of 8h. In the long run, the winning rate is relatively high. But I also worry that the altcoin is currently at the bottom, and it may runs out of a rising trend and cause a loss of this strategy.
The second strategy uses the altcoin’s price regression feature, which rises more than the index and has a high probability of falling back. However, it may accumulate too many positions in a single currency. If a certain currency really does not fall back, it will cause a large loss.
Due to the different start-up time of the strategy and the specific parameters, the impact of people who use this strategy for a long time should not be great.
In short, there is no perfect strategy, only a correct attitude to the strategy, it ultimately depends on the user’s understanding of risks and judgment of the future.
- Quantitative Practice of DEX Exchanges (2) -- Hyperliquid User Guide
- DEX exchange quantitative practices ((2) -- Hyperliquid user guide
- Quantitative Practice of DEX Exchanges (1) -- dYdX v4 User Guide
- Introduction to Lead-Lag Arbitrage in Cryptocurrency (3)
- DEX exchange quantitative practice ((1) -- dYdX v4 user guide
- Introduction to the Lead-Lag suite in digital currency (3)
- Introduction to Lead-Lag Arbitrage in Cryptocurrency (2)
- Introduction to the Lead-Lag suite in the digital currency (2)
- Discussion on External Signal Reception of FMZ Platform: A Complete Solution for Receiving Signals with Built-in Http Service in Strategy
- Discussing FMZ platform external signal reception: a complete set of strategies for the reception of signals from built-in HTTP services
- Introduction to Lead-Lag Arbitrage in Cryptocurrency (1)
- Market quotes collector upgrade again
- Upgraded case collector - support for CSV file import to provide custom data sources
- Commodity Futures High Frequency Trading Strategy written by C++
- Larry Connors RSI2 Mean Reversion Strategy
- OK hands-on teaches you how to use JS to pair FMZ extension APIs
- Based on the use of a new relative strength index in intraday strategies
- Research on Binance Futures Multi-currency Hedging Strategy Part 4
- Larry Connors Larry Connors RSI2 mean return strategy
- Research on Binance Futures Multi-currency Hedging Strategy Part 3
- Research on Binance Futures Multi-currency Hedging Strategy Part 2
- Hands-on teaches you how to upgrade to a custom data source to retrieve custom data.
- Crocodile line trading system Python version
- Expanded API to enable TradingView alarm signal trading using inventor's quantified trading platform (recommended)
- JavaScript version SuperTrend strategy
- SuperTrend V.1 - Supertrend line system
- JavaScript version of the SuperTrend policy
- [Millennium War] Currency exchange multi-currency hedging strategies Recent recaps and results of the minute-level K-line review ((Part 4)
- Hands-on teaches you how to implement a data collector
- [Millennium War] Bitcoin futures do nothing and do more and more and more and more and more and more and more and more and more and more and more and more and more and more and more and more and more and more and more and more and more]
- [Millennium War] Bitcoin futures do nothing and do more and more and more and more and more and more and more and more and more and more and more and more.