Based on the use of a new relative strength index in intraday strategies
 0
1281
0
1281
Summary
The traditional Relative Strength Index (RSI) uses two lines to reflect the strength of the price trend. This kind of graph can provide investors with an operation basis, which is very suitable for short-term price difference operations.
Based on the principle of balance between supply and demand in the market, RSI judges the strength of the buying and selling power of the long and short sides of the market by comparing the price rise and fall in the past period, and thus judges the future market trend.
The role of RSI
In actual trading, RSI is generally only used as a reference to judge the price trend, and it is difficult to issue accurate trading signals by itself. It is just a supporting evidence supplemented by other technical analysis. For example, in the k line form theory, when the head and shoulders top pattern is confirmed, if the RSI is in the overbought zone at this time, the possibility of reversal is further strengthened.
The mathematical principle is that, in simple terms, the power comparison between buyers and sellers is obtained by numerical calculation. For example, if 100 people face a product, if more than 50 people want to buy, and they are competing to raise prices, the price of the product will rise. On the contrary, if more than 50 people are competing to sell, the price will naturally fall.
Definition of RSI
First define the rising range U and falling range D:
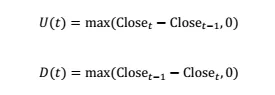
Then define the relative strength

Among them, SMA (x, n) is the simple moving average of x with period n. After normalizing RS, we get RSI:

After normalization, the value range of RSI is guaranteed to be between 0 and 100, which makes the RSI at different times comparable. It can be seen from the definition that RSI is positively related to RS, and RS is directly proportional to the average increase in the past n cycles and inversely proportional to the average decrease in the past n cycles.
Therefore, the RSI measures the magnitude of the average increase in the past n cycles relative to the average decline, that is, the strength of the bulls relative to the bears in the past n cycles. The larger the value, the stronger the bulls in the past period; the smaller the value, the stronger the bulls in the past.
RSI strategy
The traditional RSI timing strategy is mainly divided into two categories. One type is a reversal strategy, that is, when the RSI is greater than (less than) a larger (smaller) value, the situation in which the power of buying parties (selling parties) is dominant will change.
The other type of strategy is just the opposite, that is, when the RSI changes from small to large (from large to small), it indicates that the buying parties (selling parties) power is dominant, and that this trend will continue. The following is a detailed introduction.
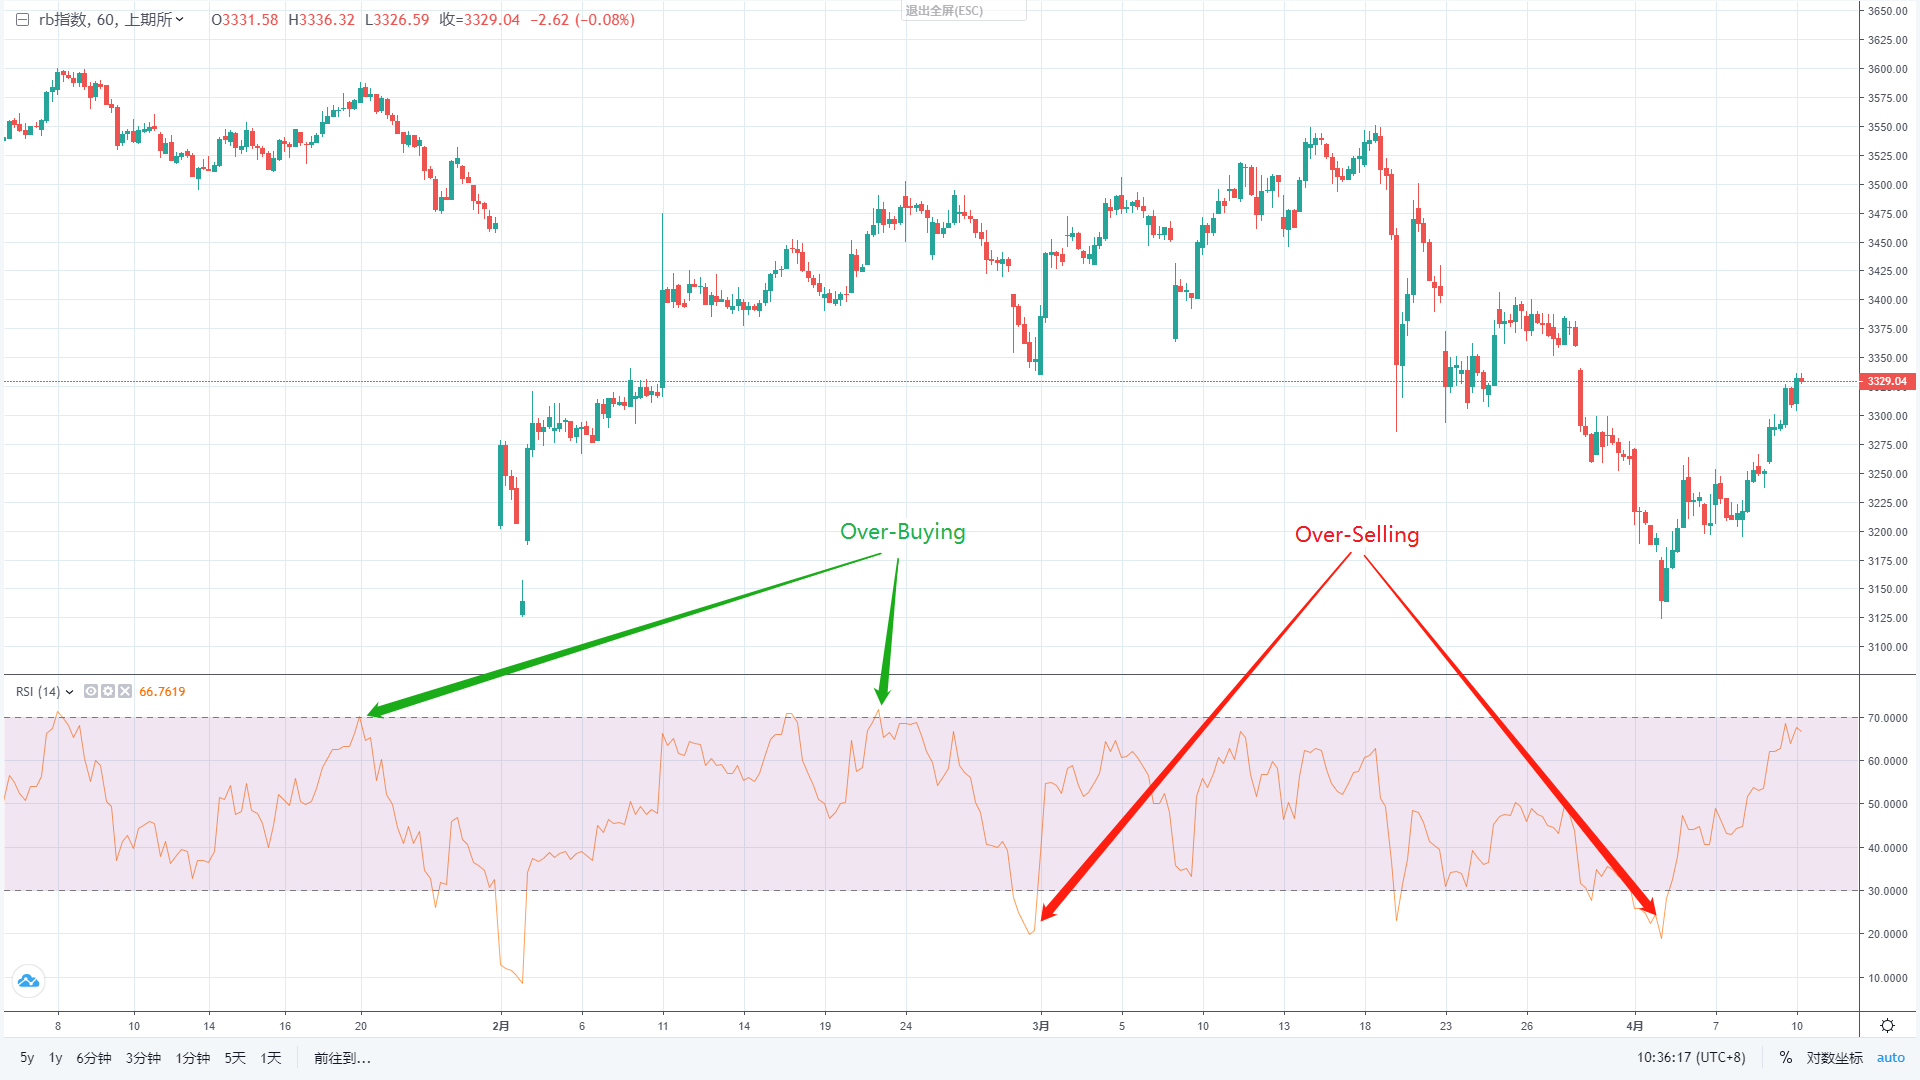
RSI reversal strategy:
If the upper threshold of RSI is M, the lower threshold is 100-M. The area where M < RSI < 100 is defined as the over-buying area, that is, at this time, buying parties have been rising for a period of time in the past, and then the probability of the selling side prevailing is greater; otherwise, the area where 0 < RSI < 100-M is defined as over-selling area, at this time, the selling side has pressed the price for a period of time, after which the probability of buying parties prevailing is greater.
Therefore, when RSI > M, the position is closed and shorted, and when RSI < 100-M, the position is closed and longed, as shown in the figure below. Generally, the value of M is 80 or 70.
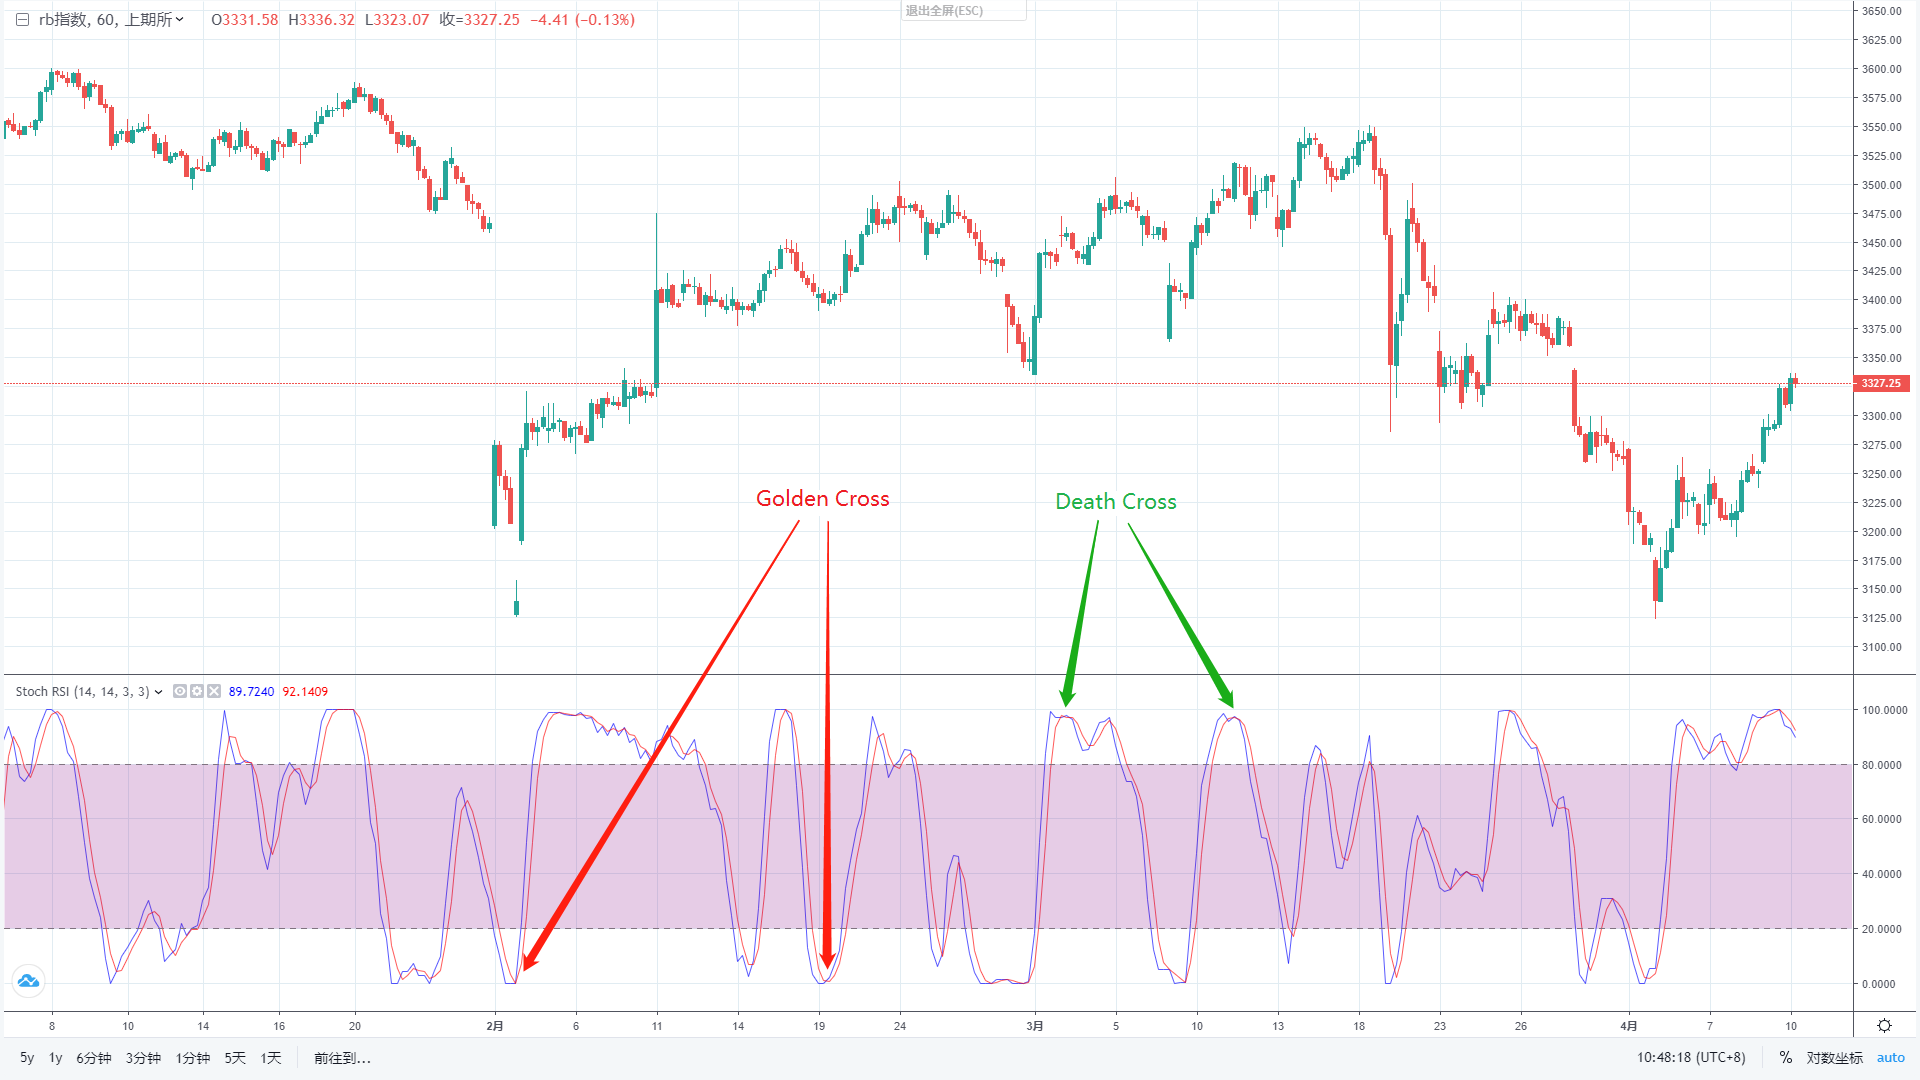
RSI Trend Strategy:
The RSI trend strategy is similar to the moving average trend strategy. When the short-term RSI cross up (down) the long-term RSI, it is considered that buying parties (selling parties) have begun to push, and the trend of price increases (decreases) will continue for a period of time. A short-term RSI cross up the long-term RSI is called a golden cross, which is the buying opportunity; a short-term RSI cross down a long-term RSI is called a death cross, which is a selling opportunity, as shown in the following figure.
Traditional RSI timing strategy for stock index futures
how effective is RSI in quantitative trading? Let’s test the traditional RSI timing strategy on IF300. In order to highlight the essence, we adopted the simplest RSI timing strategy without setting take-profit and stop-loss.
Code:
/*backtest
start: 2015-02-22 00:00:00
end: 2020-04-09 00:00:00
period: 1d
exchanges: [{"eid":"Futures_CTP","currency":"FUTURES"}]
*/

function main() {
    $.CTA('IF000', function (st) {
        var r = st.records;
        if (r.length < 14) {
            return;
        }
        var rsi = talib.RSI(r, 14);
        var rsi1 = rsi[rsi.length - 2];
        var mp = st.position.amount;
        if (mp != 1 && rsi1 < N) {
            return 1;
        }
        if (mp != -1 && rsi1 > 100 - N) {
            return -1;
        }
    });
}
Backtest results
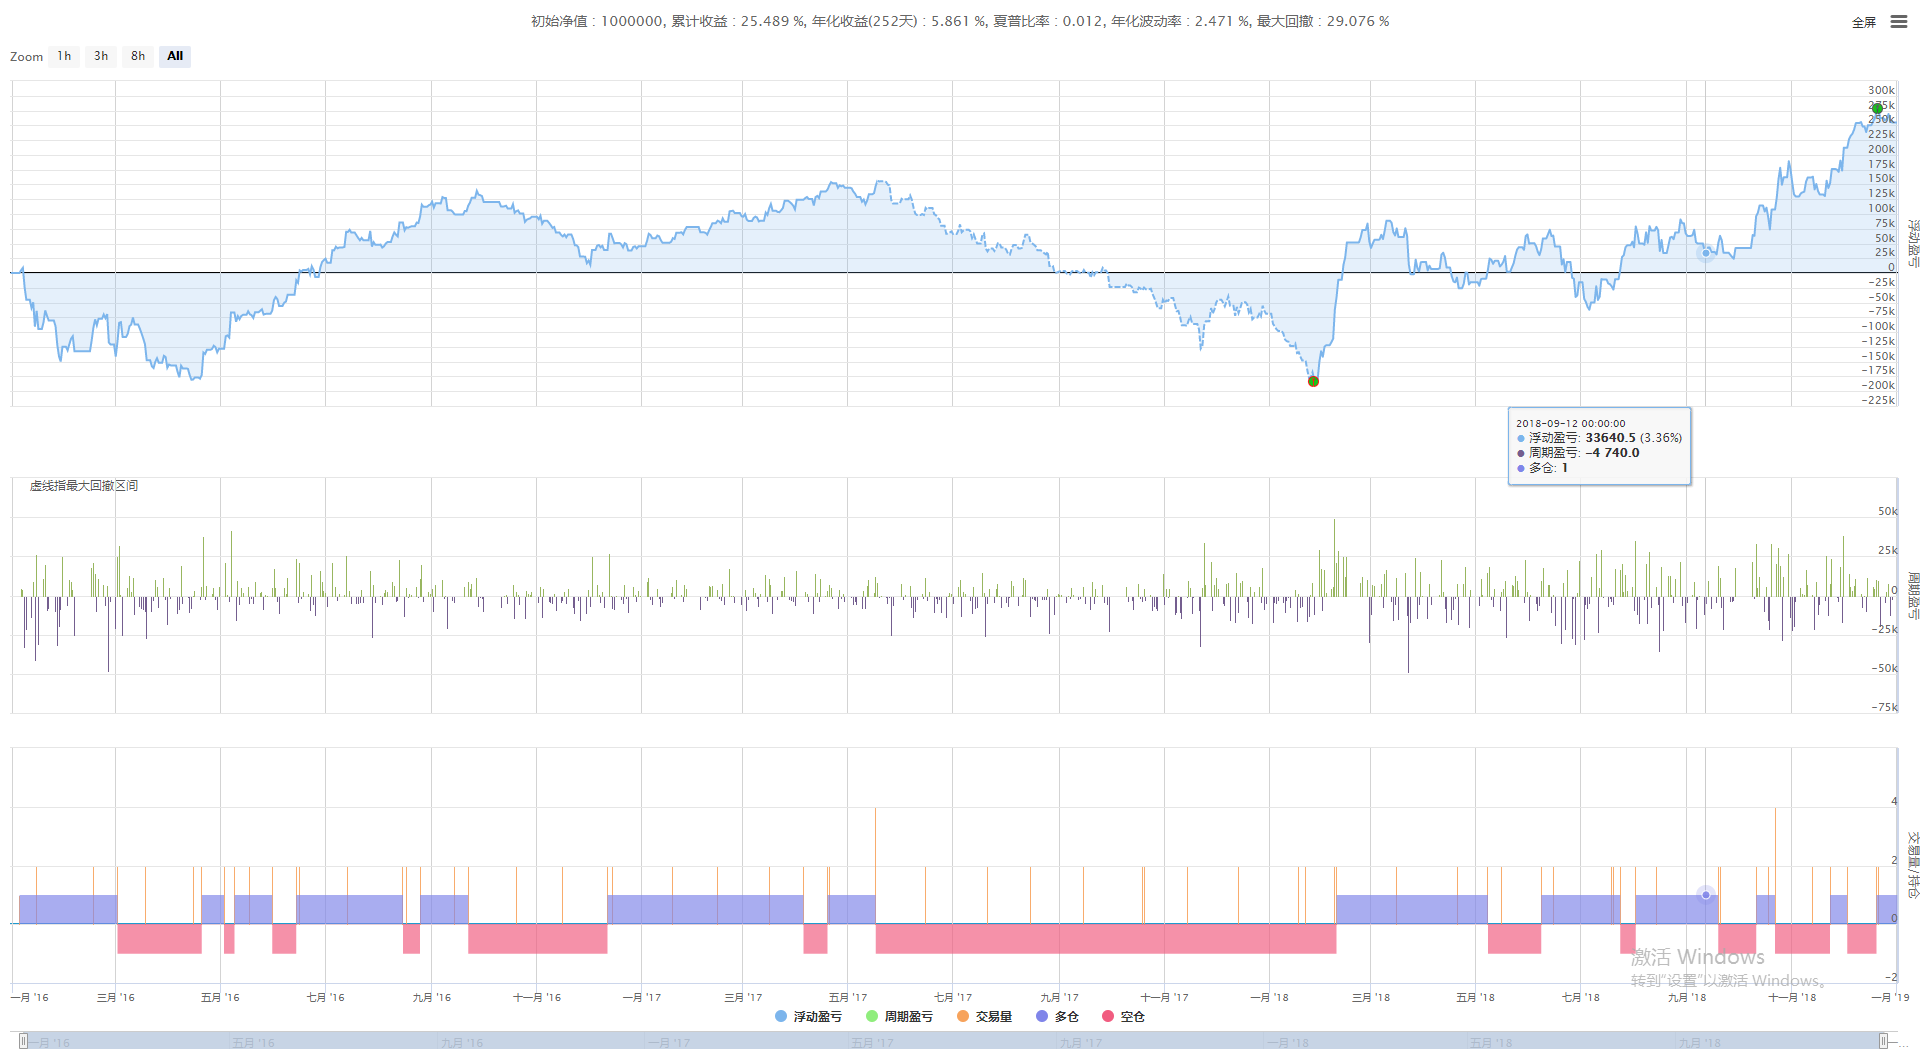
It can be seen that whether it is used in the short-term or long-term, the return of the RSI reversal strategy is negative. Traditional RSI reversal strategies cannot be used directly for quantitative trading alone.
Strategy drawbacks
So is there a better RSI timing strategy for stock index futures or commodity futures? We start with the shortcomings of traditional RSI timing strategies. The disadvantage of the traditional RSI reversal strategy is that it only uses the RSI indicator of a single period. Although the short-term RSI is in the over-selling zone, the RSI may be in the over-buying zone in the long-term. At this time, short selling can only make little profit in the short-term, and it is likely to lose money in the longer-term.
The traditional RSI trend strategy is the lag of crossover, which often occurs after a period of rise. At this time, there is not much time until the next reversal, so the profit margin is small. At the same time, the crossover only considers the relative size of the long and short periods of RSI, and does not consider the absolute size of the RSI itself. Therefore, by combining the advantages of the two traditional strategies, a new long-term and short-term RSI timing strategy can be obtained.
Strategy upgrade
In order to overcome the disadvantages of using a single RSI, we use the same parameter period N on two K lines with different periods to calculate the short-term and long-term RSI respectively. In this way, it can better reflect the strength of long and short power in the medium and long term.
In order to overcome the shortcomings of using RSI relative size, we set two thresholds L and S for long-term and short-term RSI respectively. When the long-term RSI > L, the long-term perspective is considered to be dominant, and when the short-term RSI > S, the long-party is beginning to push, and the trend will continue; and vice versa.
Therefore, first of all, we can have a prediction on the trend range of L and S. Since short-term RSI is more sensitive than long-term RSI, L < S. The value range of L should be around 50, and the trend range of S should be around 80. In this way, the screening effect of long-term RSI can be guaranteed.
Strategy logic
- Long position condition: long-term RSI> L, and short-term RSI> S.
- Short-term conditions: long-term RSI < 100-L, and short-term RSI < 100-S.
- Closing position conditions: Floating profit and loss reach a certain level, or the time is equal to 5 minutes before market close.
The improved RSI trading strategy separately calculates the RSI indicators on the K line of different periods. When the RSI of the low frequency K line is strong and the RSI of the high frequency K line is very strong, buying long; when the RSI of the low frequency K line is weak, the high frequency K line RSI indicator is weak, selling short; and also close all positions before market close.
- The best way to install and upgrade FMZ docker on Linux VPS
- Commodity Futures R-Breaker Strategy
- 数字货币期货交易逻辑的一点思考
- Teach you to implement a market quotes collector
- Python Version Commodity Futures Moving Average Strategy
- Market quotes collector upgrade again
- 行情收集器再升级--支持CSV格式文件导入提供自定义数据源
- Commodity Futures High Frequency Trading Strategy written by C++
- Larry Connors RSI2 Mean Reversion Strategy
- 奥克手把手教你用JS对接FMZ扩展API
- Research on Binance Futures Multi-currency Hedging Strategy Part 4
- Larry Connors拉里·康纳斯 RSI2均值回归策略
- Research on Binance Futures Multi-currency Hedging Strategy Part 3
- Research on Binance Futures Multi-currency Hedging Strategy Part 2
- Research on Binance Futures Multi-currency Hedging Strategy Part 1
- 手把手教你给行情收集器升级回测自定义数据源功能
- Crocodile line trading system Python version
- 使用发明者量化交易平台扩展API实现TradingView报警信号交易(推荐)
- JavaScript version SuperTrend strategy
- SuperTrend V.1--超级趋势线系统