Visualize editing strategies to extend custom libraries
Author: Inventors quantify - small dreams, Created: 2020-10-17 11:27:43, Updated: 2024-12-06 22:23:25
Visualize editing strategies to extend custom libraries
How can I extend the custom class library I need to the visualization strategy? For example, I want to calculate the MA indicator, but the system only comes with: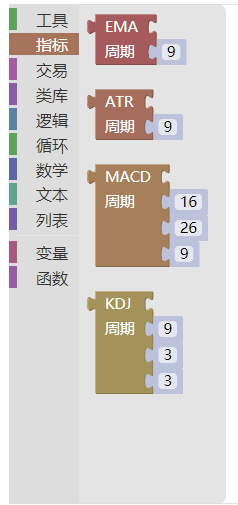 How can we add some custom code to these metrics?
We explain how to extend the visualization module by adding a custom MA indicator calculation module.
Directory of digital currencies
First of all, let's talk about the template for the cryptocurrency spot market repository, which is:https://www.fmz.com/strategy/10989Although the template is a template for the FMZ platform JavaScript language, students who do not understand the concept of a template can consult the FMZ API documentation:https://www.fmz.com/api#模板类库What is it? However, there is a commentary at the beginning of the template that defines the code for visualizing the module, and the code that defines the code can reference the code of this JavaScript template. This is very convenient for us to expand on our own (to give a good example, let's emulate).
The digital currency spot market library, the visual definition of the opening section:
/*blockly
    {
        "type": "ext_Trade",
        "message0": "%1 币数 %2|%1 Coins %2",
        "args0": [{
            "type": "field_dropdown",
            "options": [
                ["买入|Buy", "Buy"],
                ["卖出|Sell", "Sell"]
            ]
        }, {
            "type": "input_value",
            "check": "Number"
        }],
        "template": "(function(){var r = $.%1(%2); return r ? r.amount : 0; })()",
        "order": "ORDER_ATOMIC",
        "output": "Number",
        "colour": 85
    }, {
        "type": "ext_CancelPendingOrders",
        "message0": "取消 %1 订单|Cancel %1 Orders",
        "args0": [{
            "type": "field_dropdown",
            "name": "TYPE",
            "options": [
                ["所有|All", " "],
                ["买单|Buy", "ORDER_TYPE_BUY"],
                ["卖单|Sell", "ORDER_TYPE_SELL"]
            ]
        }],
        "previousStatement": null,
        "nextStatement": null,
        "template": "$.CancelPendingOrders(%1);",
        "colour": 85
    }, {
        "type": "ext_Cross",
        "message0": "计算交叉 周期 %1 与 %2|Cross Period %1 and %2",
        "inputsInline": true,
        "args0": [{
            "type": "input_value"
        }, {
            "type": "input_value"
        }],
        "template": "$.Cross(%1,%2)",
        "order": "ORDER_ATOMIC",
        "output": "Number"
    }, {
        "type": "ext_GetAccount",
        "message0": "获取资产信息|GetAccount",
        "template": "$.GetAccount()",
        "order": "ORDER_ATOMIC",
        "output": null
    }
*/
The modules on the visualized edit page correspond to: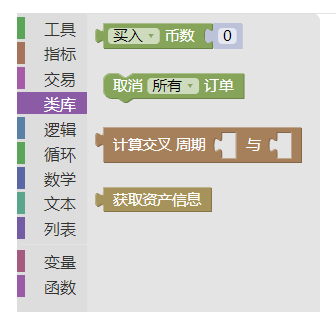
Build a module for calculating a self-defined MA indicator
With ready-made examples, it's easy to build your own with your own hands, even more so than painting a canvas.
First, a new template for the JavaScript language was created.
Edit the template code.
/*blockly
    {
        "type": "ext_testA",
        "message0": "testA|testA",
        "template": "function(){return 99;}()",
        "order": "ORDER_ATOMIC",
        "output": "Number"
    },{
        "type": "ext_MA",
        "message0": "MA 周期 %1| MA Period %1",
        "args0": [{
            "type": "input_value",
            "check": "Number"
        }],
        "template": "(function(){var r = exchange.GetRecords(); return (!r || r.length < %1) ? false : TA.MA(r, %1); })()",
        "order": "ORDER_ATOMIC",
        "output": null,
        "colour": 85
    }
*/
- type: The attribute defines the module type, which can be named on its own.
- message0: text displayed on the module.
- template: code executed by the module.
- output: the type of output of the module.
- args0: the input parameter of the module, in the module definition code %1 represents the first input parameter and %2 represents the second one.
This newly created template is saved after it has been edited.
In the policy where we need to use this template, select this template.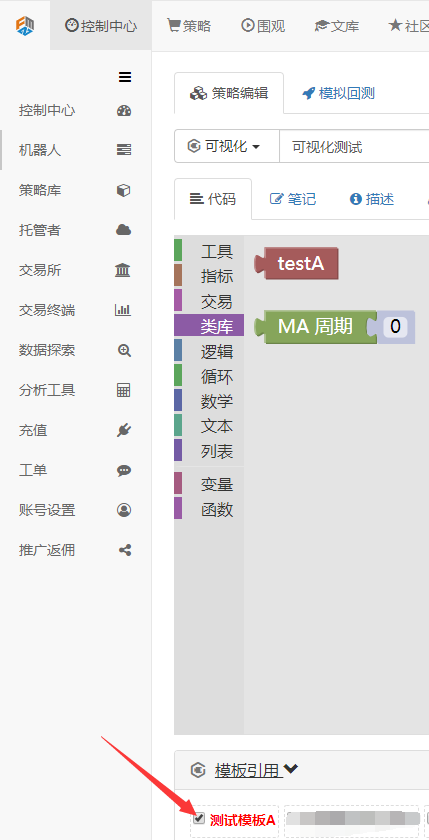
You can see two more modules:
-

The module is called testA, and let's look at its executable code:
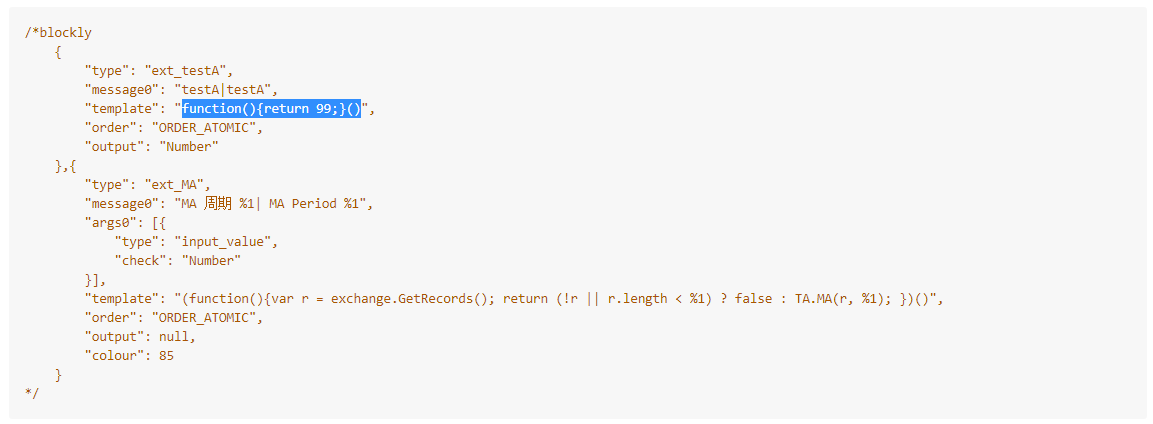
function(){return 99;}()A simple JavaScript function is executed and returns a value of 99.
-

It's called MA Cycle Module, and let's look at its execution code:
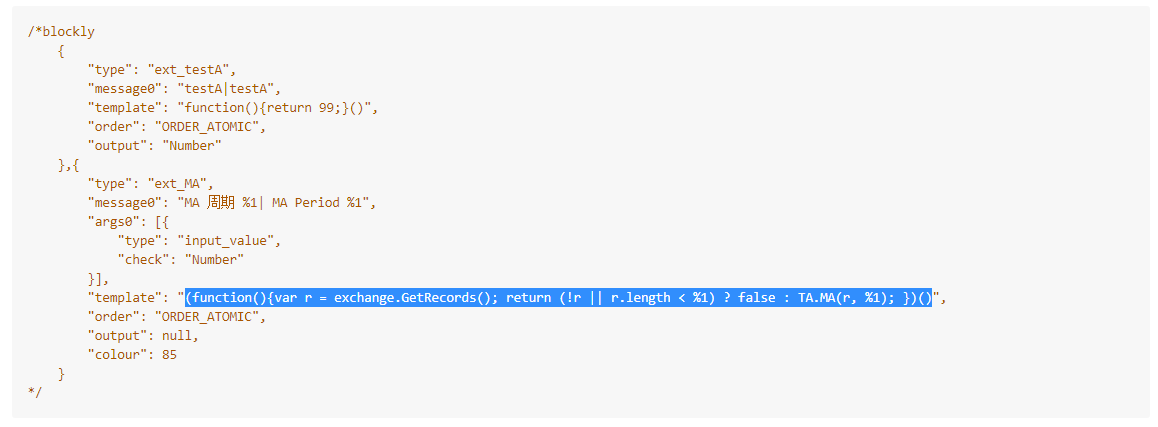
(function(){var r = exchange.GetRecords(); return (!r || r.length < %1) ? false : TA.MA(r, %1); })()The code is an anonymous function call, in which the anonymous function first performs the operation to obtain K-line data, K-line data.
rThen depending on whether the obtained r is fornullOrrThe length is less than the input parameter of the module%1Going back to judgingfalseOr go back.TA.MA(r, %1)The results of the calculation of the indicators.
I'm going to use it later.
The test calculates the MA indicator
This is the first time I've seen this video.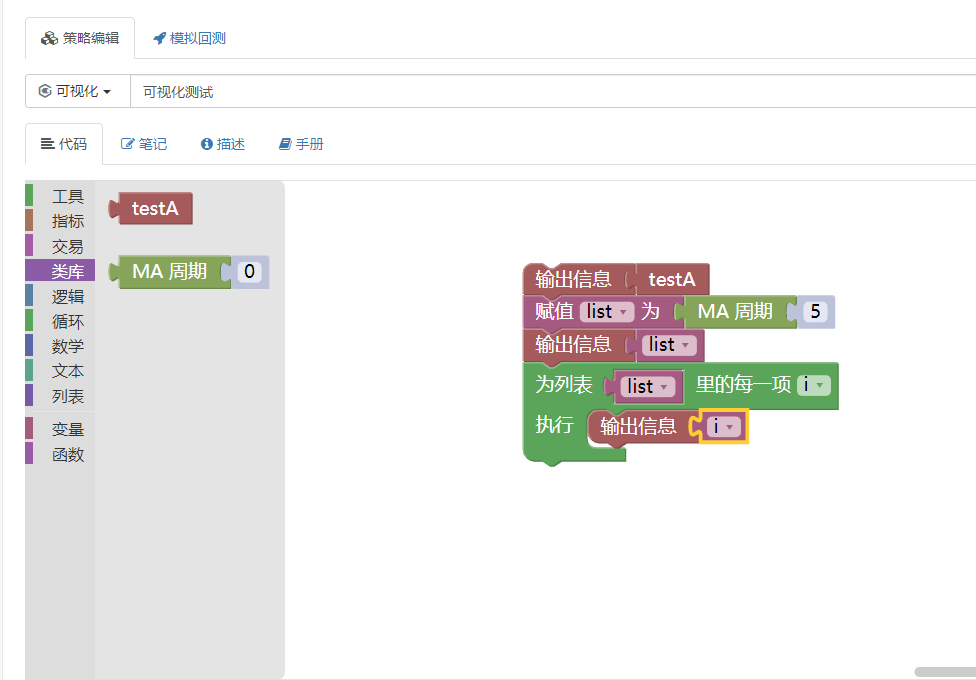
It runs:
As you can see above, the data for the calculation of the MA indicator was obtained on a pay as you go basis.
The above is just a parsing of the cube, for the design of the visualization module, the template function can be extended by itself.
- Introduction to Lead-Lag Arbitrage in Cryptocurrency (2)
- Introduction to the Lead-Lag suite in the digital currency (2)
- Discussion on External Signal Reception of FMZ Platform: A Complete Solution for Receiving Signals with Built-in Http Service in Strategy
- Discussing FMZ platform external signal reception: a complete set of strategies for the reception of signals from built-in HTTP services
- Introduction to Lead-Lag Arbitrage in Cryptocurrency (1)
- Introduction to the Lead-Lag suite in digital currency (1)
- Discussion on External Signal Reception of FMZ Platform: Extended API VS Strategy Built-in HTTP Service
- External signal reception on FMZ platforms: extended API vs. built-in HTTP services
- Discussion on Strategy Testing Method Based on Random Ticker Generator
- Strategy testing methods based on random market generators explored
- New Feature of FMZ Quant: Use _Serve Function to Create HTTP Services Easily
- Implementation of a simple digital currency cash register robot
- Binance perpetual funds rate adjustment (currently bull market annualized 100%)
- How to analyze cabbage harvesters (2)
- The risk is controlled by adding to the damage... So, Gurdjan, what is the cost?
- How to dissect cabbage harvesters (1)
- Years from now, you'll feel like this is the most valuable article in your investment career, figuring out the source of the return and the source of the risk.
- 5 bands 80 times the power of high-frequency tactics
- Futures counter-hand doubled algorithm strategy commentary details
- Simply put, why is it not feasible to move OKEX's assets through a contractual hedging strategy?
- Thinking about moving assets through a contract hedging strategy
- Solution for getting a host to send an HTTP request message
- Use of servers in quantitative transactions
- [Millennium War] Bitcoin exchange rate approximate strategy 3 butterfly hedging
- Balancing listing strategies with teaching strategies
- RSI2 Mean Reversion Strategy using in futures
- The futures and cryptocurrency API explanation
- Quickly implement a semi-automatic quantitative trading tool
- Introducing the Aroon indicator
- Preliminary Study on Backtesting of Digital Currency Options Strategy
- The Difference between Quantitative Trading and Subjective Trading