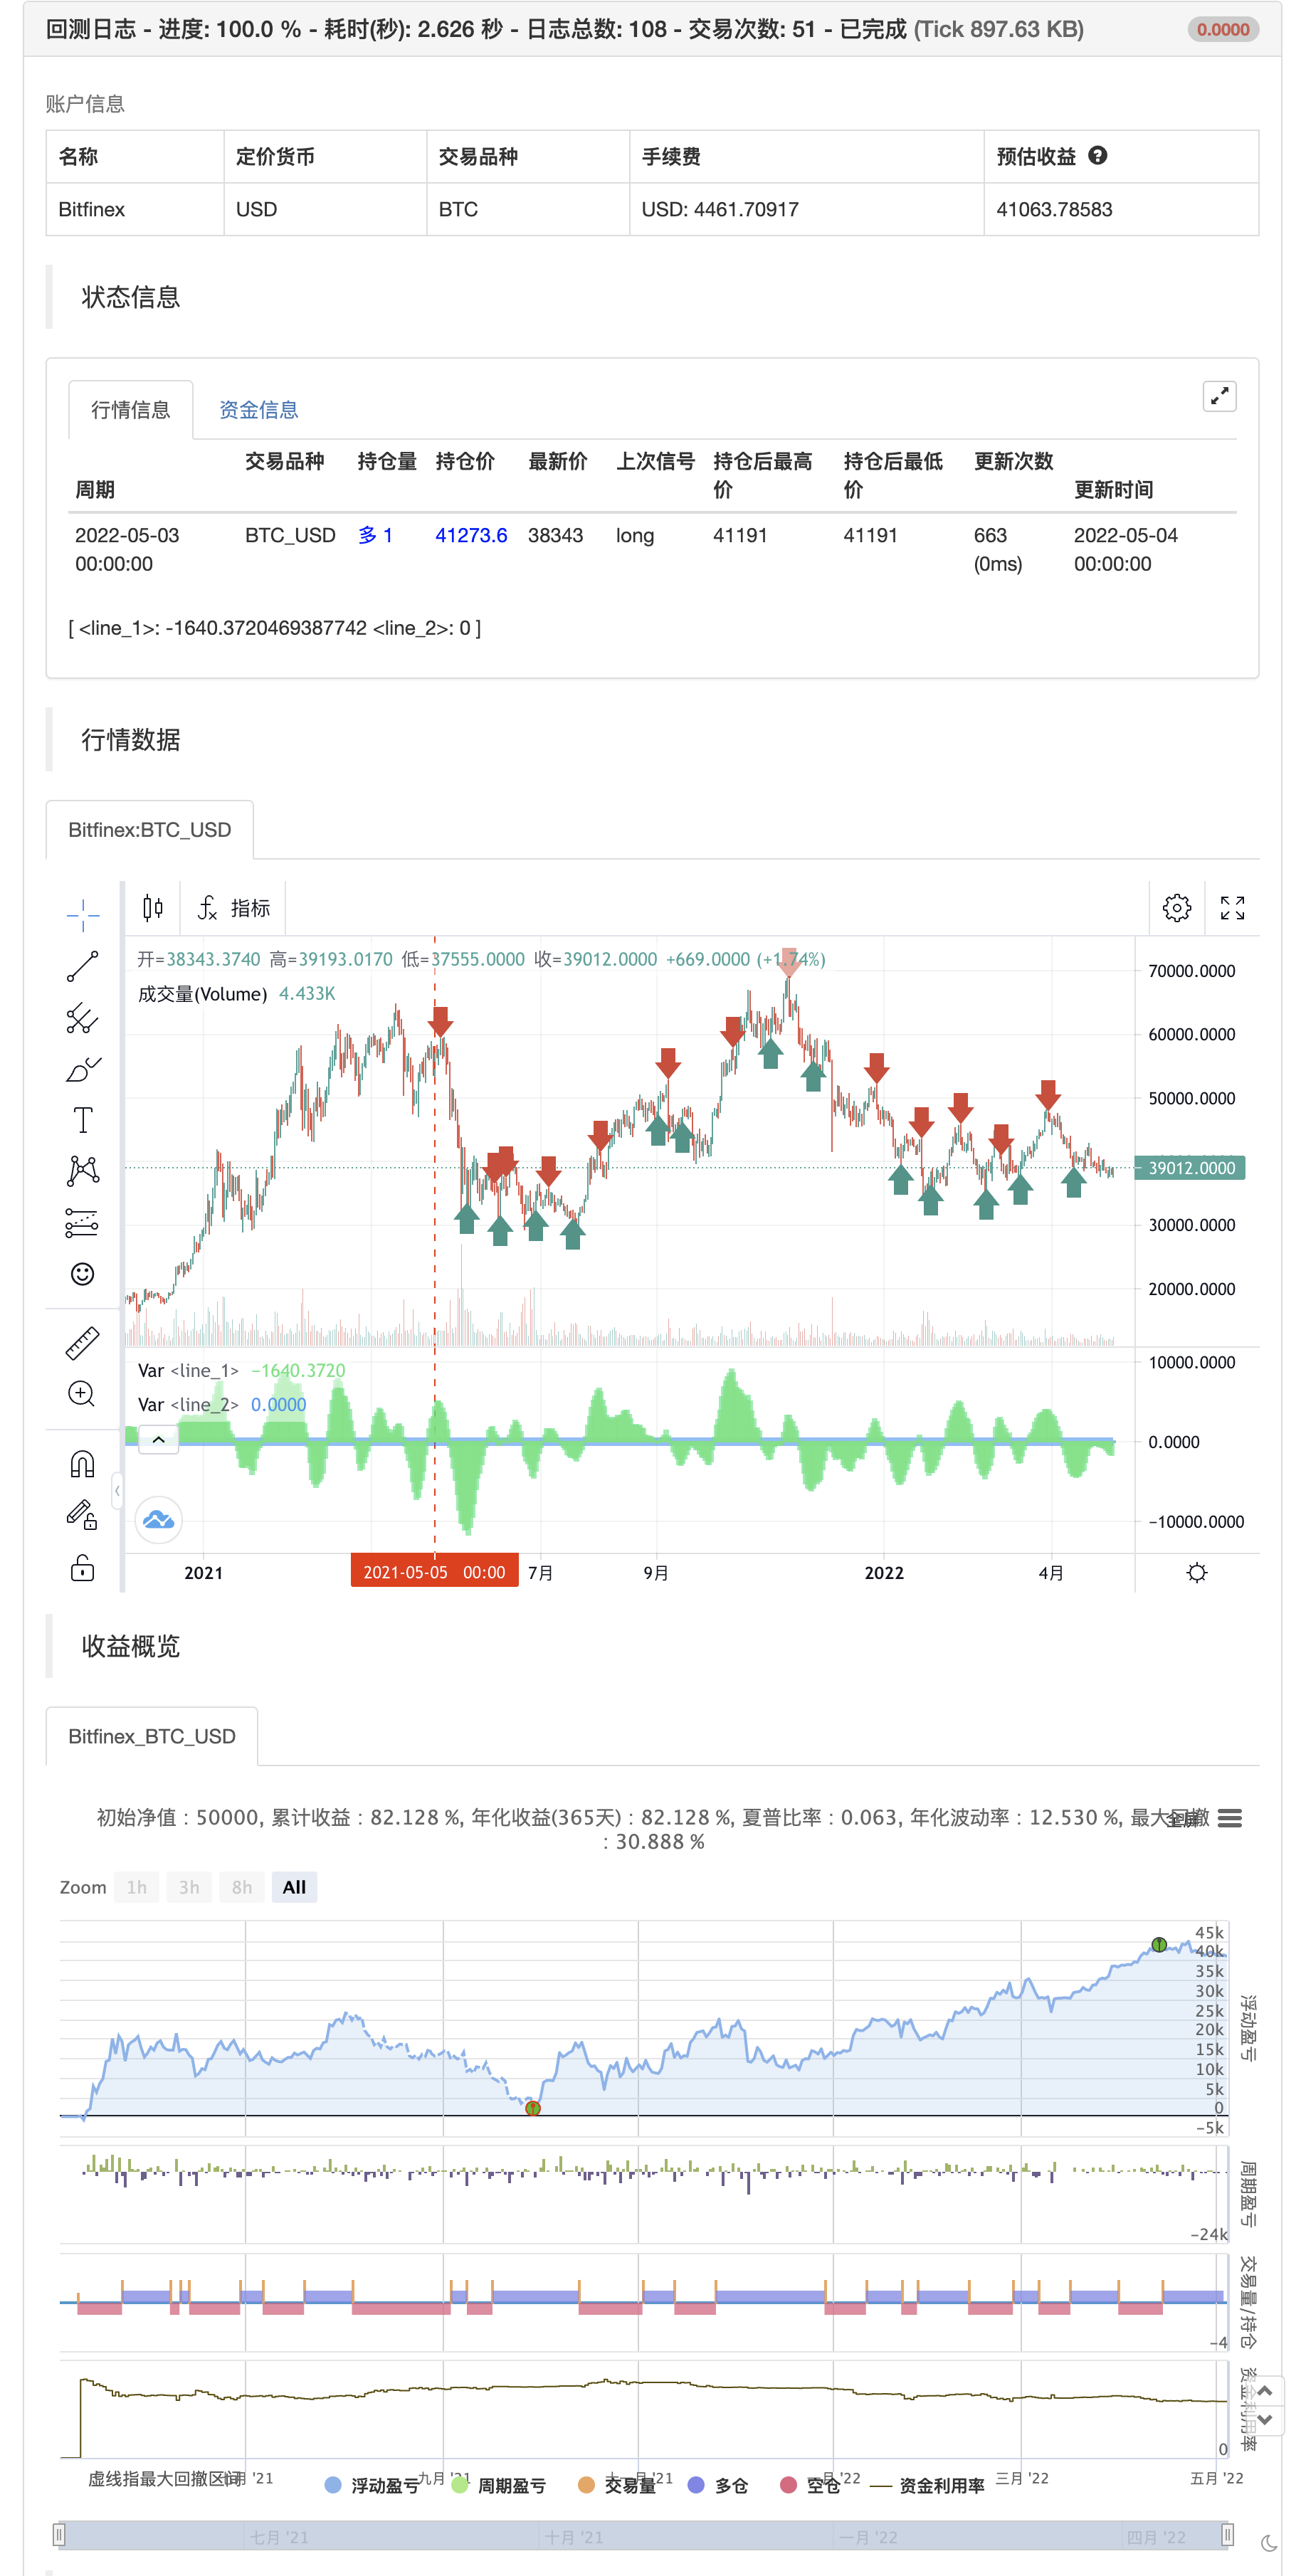
Squeeze Momentum Indicator
Author: ChaoZhang, Date: 2022-05-06 17:19:10Tags: SMA
This is a derivative of John Carter’s “TTM Squeeze” volatility indicator, as discussed in his book “Mastering the Trade” (chapter 11).
Black crosses on the midline show that the market just entered a squeeze ( Bollinger Bands are with in Keltner Channel). This signifies low volatility , market preparing itself for an explosive move (up or down). Gray crosses signify “Squeeze release”.
Mr.Carter suggests waiting till the first gray after a black cross, and taking a position in the direction of the momentum (for ex., if momentum value is above zero, go long). Exit the position when the momentum changes (increase or decrease — signified by a color change). My (limited) experience with this shows, an additional indicator like ADX / WaveTrend, is needed to not miss good entry points. Also, Mr.Carter uses simple momentum indicator , while I have used a different method (linreg based) to plot the histogram.
Reassessment

/*backtest
start: 2021-05-05 00:00:00
end: 2022-05-04 23:59:00
period: 1d
basePeriod: 1h
exchanges: [{"eid":"Bitfinex","currency":"BTC_USD"}]
*/

//
// @author LazyBear
// List of all my indicators: https://www.tradingview.com/v/4IneGo8h/
//
study(shorttitle = "SQZMOM_LB", title="Squeeze Momentum Indicator [LazyBear]", overlay=false)

length = input(20, title="BB Length")
mult = input(2.0,title="BB MultFactor")
lengthKC=input(14, title="KC Length")
multKC = input(1.5, title="KC MultFactor")

useTrueRange = input(true, title="Use TrueRange (KC)",defval=true)

// Calculate BB
source = close
basis = ta.sma(source, length)
dev = multKC * ta.stdev(source, length)
upperBB = basis + dev
lowerBB = basis - dev

// Calculate KC
ma = ta.sma(source, lengthKC)
range = useTrueRange ? ta.tr : (high - low)
rangema = ta.sma(range, lengthKC)
upperKC = ma + rangema * multKC
lowerKC = ma - rangema * multKC

sqzOn  = (lowerBB > lowerKC) and (upperBB < upperKC)
sqzOff = (lowerBB < lowerKC) and (upperBB > upperKC)
noSqz  = (sqzOn == false) and (sqzOff == false)

val = ta.linreg(source  -  math.avg(math.avg(ta.highest(high, lengthKC), ta.lowest(low, lengthKC)),ta.sma(close,lengthKC)),
            lengthKC,0)

bcolor = iff( val > 0,
            iff( val > nz(val[1]), color.lime, color.green),
            iff( val < nz(val[1]), color.red, color.maroon))

scolor = noSqz ? color.blue : sqzOn ? color.black : color.gray
plot(val, color=bcolor, style=plot.style_histogram, linewidth=4)
plot(0, color=scolor, style=plot.style_cross, linewidth=2)

if val >0 and val < nz(val[1])
    strategy.entry("entry short", strategy.short)
else if val <0 and val > nz(val[1])
    strategy.entry("entry long", strategy.long)
- Multi-Dimensional Trend Analysis with ATR-Based Dynamic Stop Management Strategy
- Adaptive Bollinger Bands Mean-Reversion Trading Strategy
- Advanced Multi-Indicator Trend Confirmation Trading Strategy
- Dual Moving Average-RSI Multi-Signal Trend Trading Strategy
- Adaptive Trend Following and Multi-Confirmation Trading Strategy
- Dynamic Stop-Loss Adjustment Elephant Bar Trend Following Strategy
- Dynamic RSI Quantitative Trading Strategy with Multiple Moving Average Crossover
- Multi-Dimensional KNN Algorithm with Volume-Price Candlestick Pattern Trading Strategy
- SMA-Based Intelligent Trailing Stop Strategy with Intraday Pattern Recognition
- Adaptive Multi-Strategy Dynamic Switching System: A Quantitative Trading Strategy Combining Trend Following and Range Oscillation
- Advanced Multi-Indicator Multi-Dimensional Trend Cross Quantitative Strategy
- SuperTrend
- TMA Overlay
- MACD + SMA 200 Strategy
- CM Sling Shot System
- Bollinger + RSI, Double Strategy v1.1
- Bollinger Bands Strategy
- Optimized Trend Tracker
- Monthly Returns in PineScript Strategies
- ADX and DI for v4
- MacD Custom Indicator-Multiple Time Frame+All Available Options!
- Indicator: WaveTrend Oscillator
- AlphaTrend
- multiple timeframe trading
- Sentiment Oscillator
- Bitcoin Ando is used to trade in the currency of the currency of the currency of the currency.
- Turtles strategy
- Get your trend
- AlphaTrend use mfi
- The digital currency market has a new strategy for robbing coins (Teaching)
- MACD Pine is a simple strategy.