概述
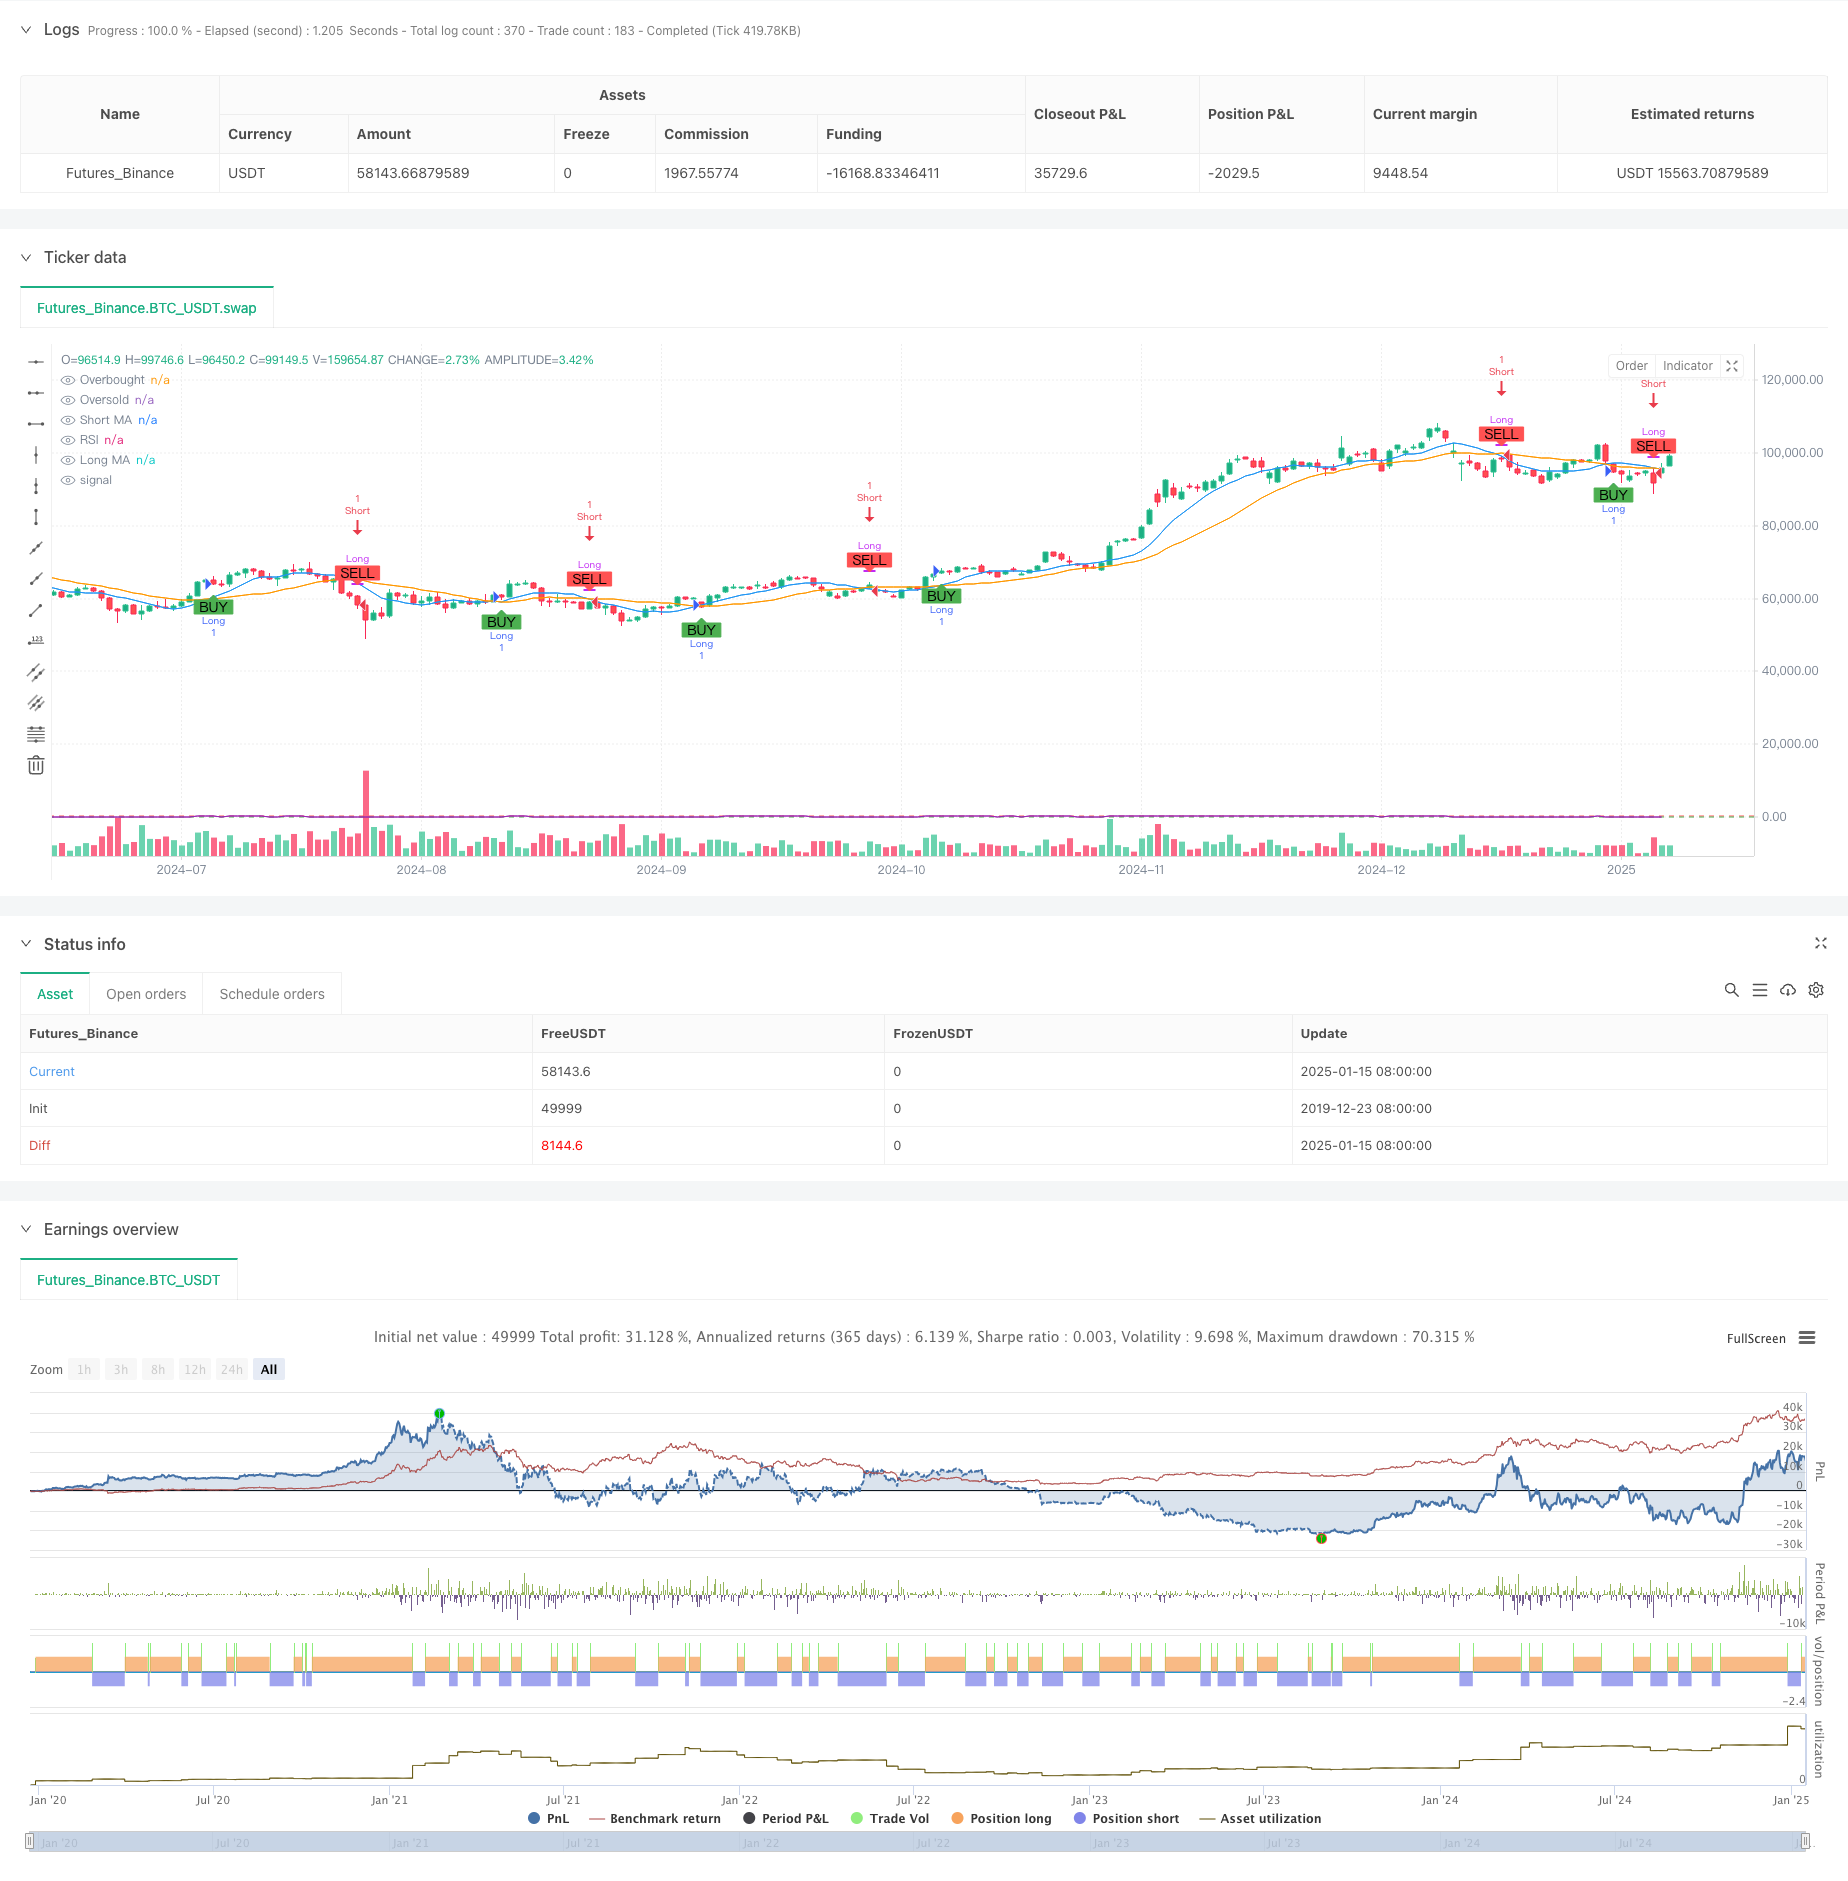
本策略是一个基于双均线和相对强弱指标(RSI)的多重信号趋势跟踪系统。策略在1小时时间周期上运行,通过短期和长期移动平均线的交叉以及RSI超买超卖水平来确定市场趋势和交易时机。系统采用9周期和21周期的简单移动平均线(SMA)组合,配合14周期的RSI指标,构建了一个完整的趋势跟踪和动量确认交易系统。
策略原理
策略的核心逻辑基于以下几个关键要素: 1. 使用9周期和21周期的简单移动平均线来识别趋势方向,短期均线上穿长期均线形成做多信号,下穿形成做空信号。 2. 引入RSI指标作为趋势确认工具,设定70和30作为超买超卖阈值。 3. 在均线交叉信号出现时,系统会检查RSI值是否满足相应条件:做多要求RSI大于超卖水平(30),做空要求RSI小于超买水平(70)。 4. 当同时满足均线交叉和RSI条件时,系统才会执行相应的交易信号。
策略优势
- 多重信号确认机制显著提高了交易可靠性,避免了单一指标可能带来的虚假信号。
- 结合趋势和动量指标,既能捕捉趋势,又能规避过度追涨杀跌。
- 参数设置合理,9和21周期的均线组合能够有效平衡灵敏度和稳定性。
- 系统自动在图表上显示交易信号,便于交易者直观判断。
- 代码结构清晰,易于维护和优化。
策略风险
- 在震荡市场中可能产生频繁的交叉信号,导致过度交易。
- RSI指标在强趋势市场中可能错过部分行情。
- 固定的超买超卖阈值可能不适用于所有市场环境。
- 均线系统存在一定滞后性,可能导致入场或出场时机略有延迟。
策略优化方向
- 引入自适应参数机制,根据市场波动率动态调整均线周期和RSI阈值。
- 增加趋势强度过滤器,在震荡市场中降低交易频率。
- 可以考虑加入止损和止盈机制,提高风险管理能力。
- 引入成交量指标作为辅助确认信号。
- 开发市场环境识别模块,在不同市场状态下使用不同的参数设置。
总结
该策略通过结合均线系统和RSI指标,构建了一个相对完善的趋势跟踪交易系统。策略设计理念注重信号可靠性和风险控制,适合中长期趋势交易。虽然存在一些固有的局限性,但通过建议的优化方向,策略的整体性能有望得到进一步提升。策略的代码实现专业规范,具有良好的可扩展性,是一个值得深入研究和实践的交易系统。
策略源码
/*backtest
start: 2019-12-23 08:00:00
end: 2025-01-16 00:00:00
period: 1d
basePeriod: 1d
exchanges: [{"eid":"Futures_Binance","currency":"BTC_USDT","balance":49999}]
*/

// This Pine Script™ code is subject to the terms of the Mozilla Public License 2.0 at https://mozilla.org/MPL/2.0/
// © Vitaliby

//@version=5
strategy("Vitaliby MA and RSI Strategy", overlay=true)

// Входные параметры для настройки
shortMALength = input.int(9, title="Short MA Length")
longMALength = input.int(21, title="Long MA Length")
rsiLength = input.int(14, title="RSI Length")
rsiOverbought = input.int(70, title="RSI Overbought Level")
rsiOversold = input.int(30, title="RSI Oversold Level")

// Расчет скользящих средних и RSI
shortMA = ta.sma(close, shortMALength)
longMA = ta.sma(close, longMALength)
rsi = ta.rsi(close, rsiLength)

// Определение условий для входа и выхода
longCondition = ta.crossover(shortMA, longMA) and rsi > rsiOversold
shortCondition = ta.crossunder(shortMA, longMA) and rsi < rsiOverbought

// Отображение сигналов на графике
plotshape(series=longCondition, location=location.belowbar, color=color.green, style=shape.labelup, text="BUY", size=size.small)
plotshape(series=shortCondition, location=location.abovebar, color=color.red, style=shape.labeldown, text="SELL", size=size.small)

// Отображение скользящих средних на графике
plot(shortMA, color=color.blue, title="Short MA")
plot(longMA, color=color.orange, title="Long MA")

// Отображение RSI на отдельном окне
hline(rsiOverbought, "Overbought", color=color.red)
hline(rsiOversold, "Oversold", color=color.green)
plot(rsi, color=color.purple, title="RSI")

// Управление позициями
if (longCondition)
    strategy.entry("Long", strategy.long)

if (shortCondition)
    strategy.close("Long")

if (shortCondition)
    strategy.entry("Short", strategy.short)

if (longCondition)
    strategy.close("Short")
相关推荐