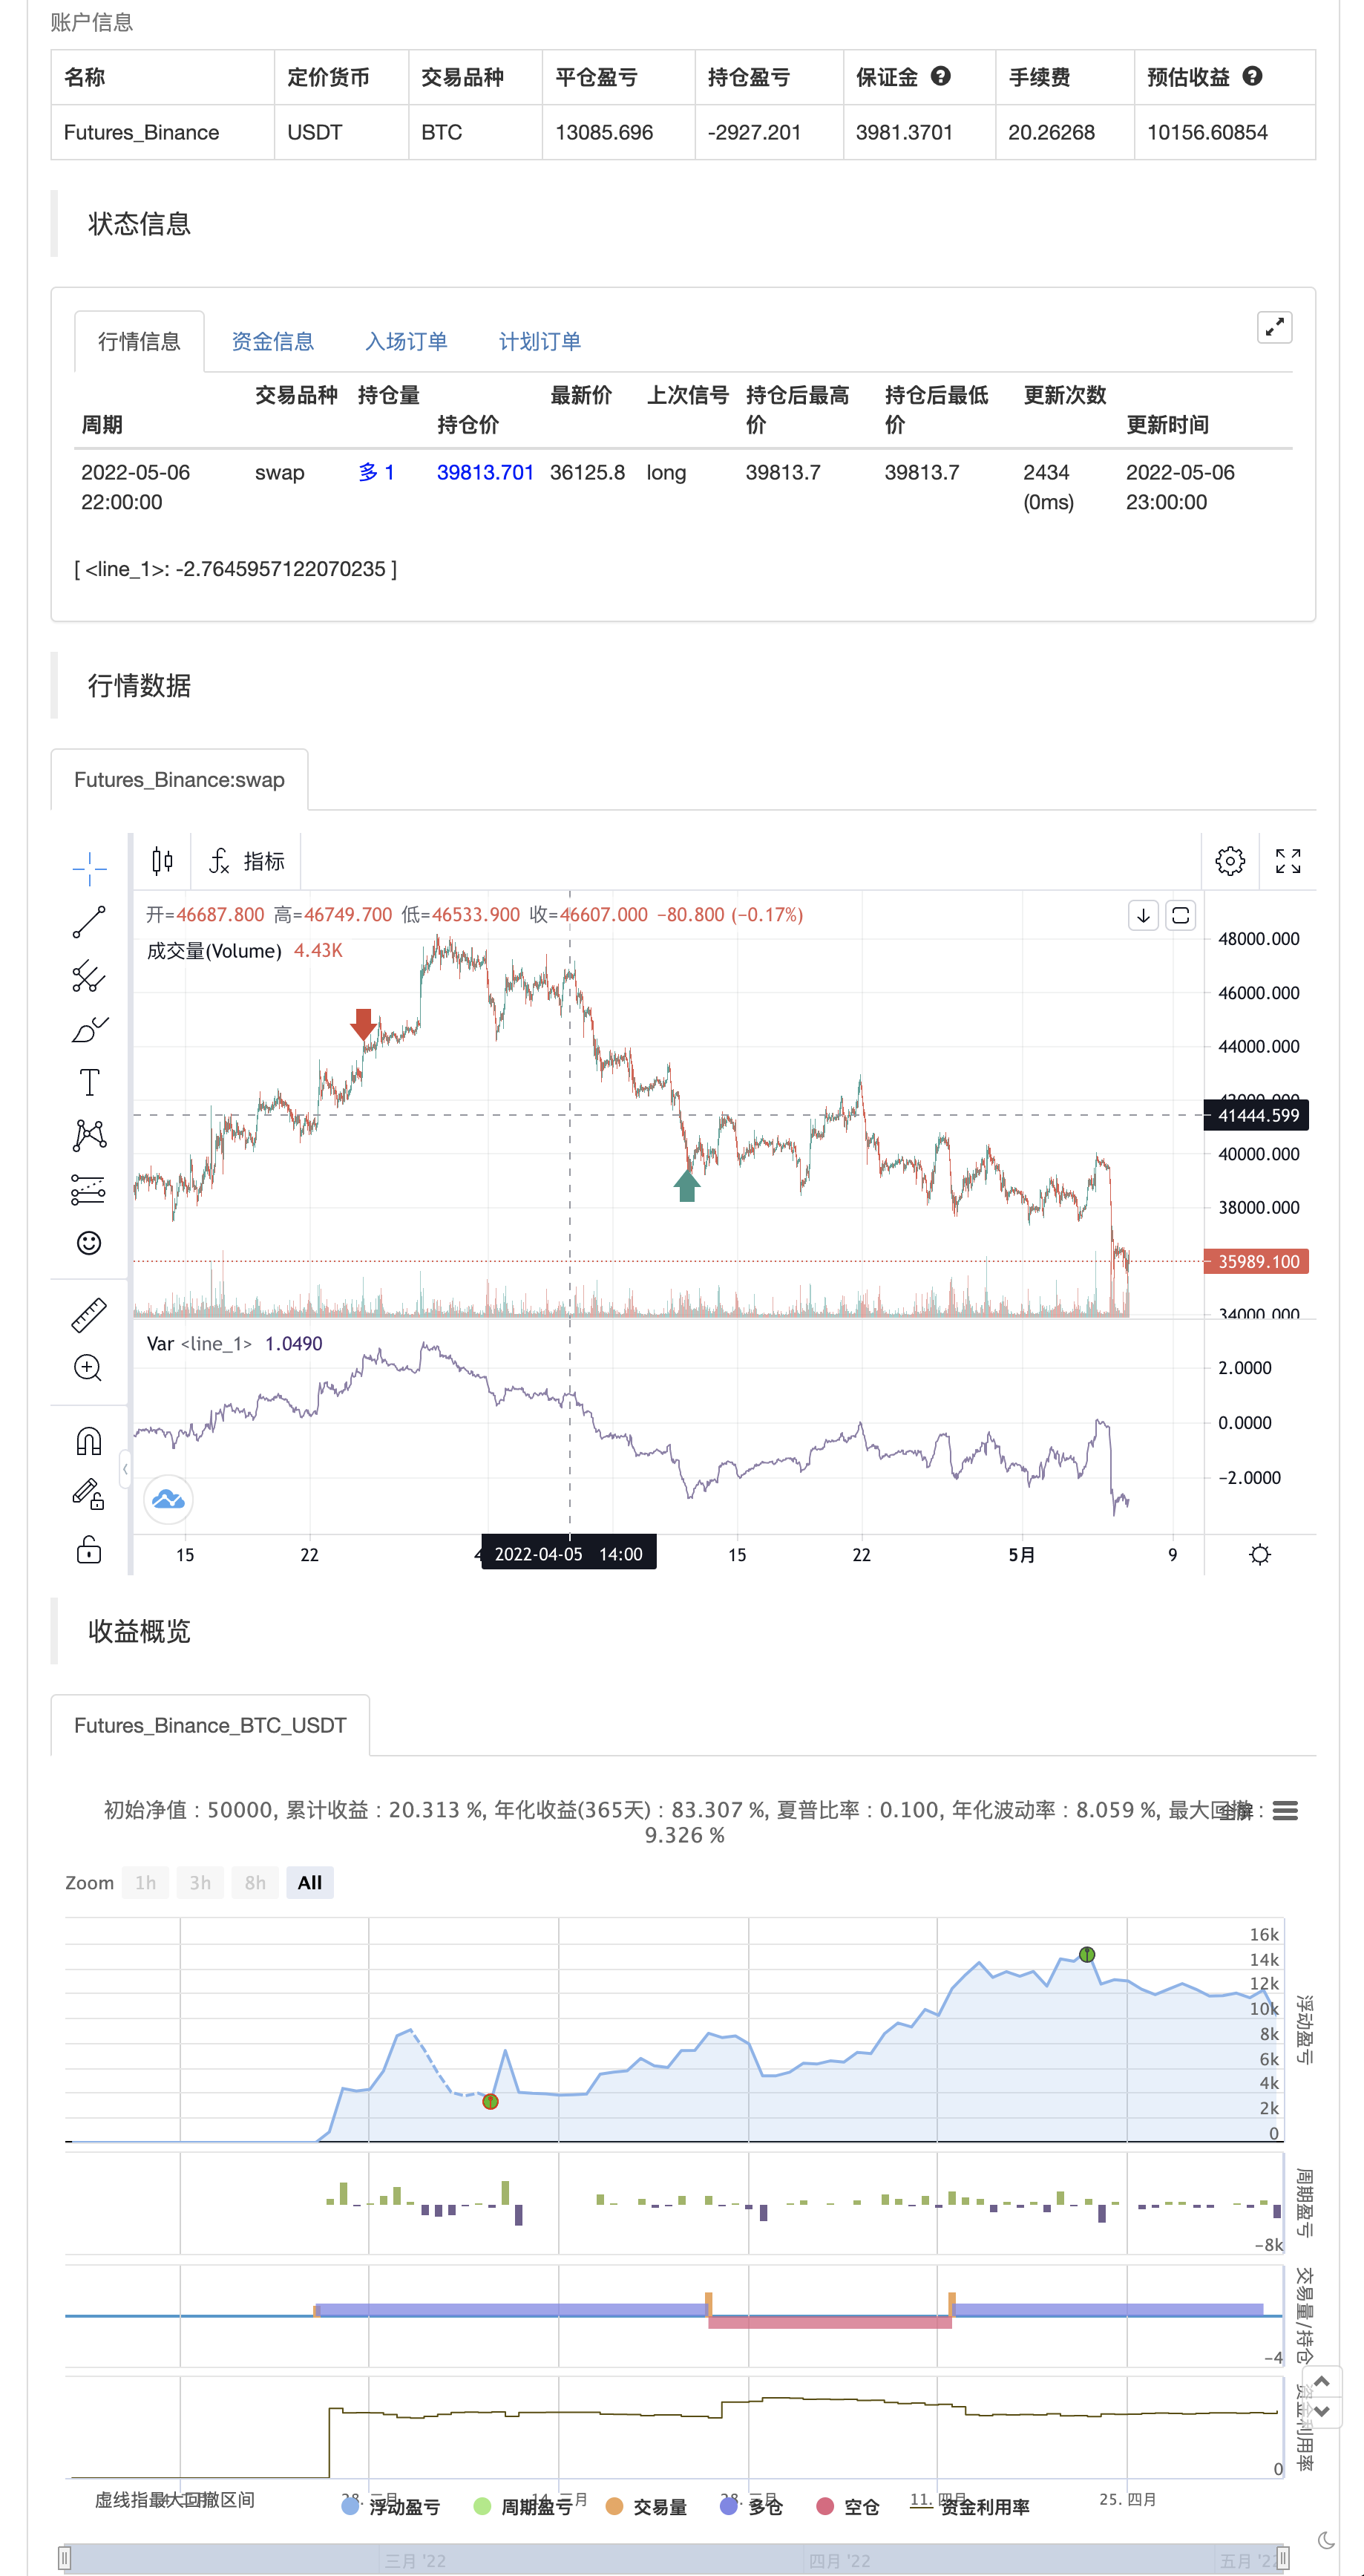
Z Score with Signals
Author: ChaoZhang, Date: 2022-05-08 16:25:46Tags: SMA
This is my open-source indicator of z-score with buy and sell indicators. I see there are other z-score indicators, I just am particular about how I like my z-scores calculated and so decided to make my own and add buy and sell signals to help guide me. And I figured I could share it openly here!
What is a Z-Score
A z-score is a statistical measures of the distance, in standard deviations, a value is from its given mean. It is expressed as a standard deviation (or SD ). The further a value (in this case, a stock) is from their mean, the more likely a regression to the mean is possible (i.e. a return to the average). So if a stock is trading at 3 standard deviations away from its mean, then we can anticipate it wanting to regress back towards 1 to 0 standard deviations from its mean (i.e. sell off back to a value that brings it closer to that SD ). The inverse is true if it is trading below.
Z-Scores and Stocks Stocks, like everything in nature, like to trade between -1 and +1 SD away from its mean. Anything above this, we can interpret that there is “stress” on the stock. Anything over 2.50 is tremendous stress on the stock and we can anticipate that it will want to revert to its mean in the near future and bring that value down to at least 1, ideally between the -0.5 and 0.5 range. Please note, I set the standard VERY high for the indicator to issue a buy and sell signal (</= -2.50 and >/=2.50). Lately with the volatility , stocks have been entering these ranges frequently and so there have been plenty of signals, but traditionally in a stable environment you may not get these signals. I set the bar extremely high because I want to avoid false buy and sell signals (you will still get them though, nothing is perfect!). So the value in this indicator is in interpreting the actual z-score itself, so please be sure you understand exactly what the Z-score is (see the description above).
How the indicator works The indicator works by calculating the average Z-Score between a stocks high and low. This indicator will present the average deviation a stock has from its high and low average. The higher the Z-Score, the more “overbought” the stock is. The lower the z-score, the more “oversold” the stock is. It uses the previous 500 candles worth of data to calculate its SMA and its Standard deviation in order to calculate the z-score.
Anytime a stock trades 2.50 SDs or more above or below its mean, you will be presented with a Buy or Sell signal, as generally, statistically speaking, after something has travelled 2.50 SDs aware from its mean, there is an increased probability of a reversion happening.
You can use this indicator to determine whether the stock is trading within normal parameters or not and to help you in your analysis as to whether or not a stock could be shorted or longed.
I personally like this for swing trading on the 1 hour chart; however, this can be used on any time from 1 minute to 1 hour. It also allows you to track a stocks progress in its reversion to the mean.
backtest

/*backtest
start: 2022-02-07 00:00:00
end: 2022-05-07 00:00:00
period: 1h
basePeriod: 15m
exchanges: [{"eid":"Futures_Binance","currency":"BTC_USDT"}]
*/

// This source code is subject to the terms of the Mozilla Public License 2.0 at https://mozilla.org/MPL/2.0/
// © Steversteves

//@version=5

indicator("Z Score with Signals", max_labels_count = 500)

// Calculating High Z Score

a = ta.sma(high, 500)
b = ta.stdev(high, 500)
c = (high - a) / b

// Calculating Low Z Score

d = ta.sma(low, 500)
e = ta.stdev(low, 500)
f = (low - d) / e

// Calculating High and Low Average

z = (c + f) / 2

plot (z)

// Condition Alerts

if (z < -2.50)
    strategy.entry("Enter Long", strategy.long)
else if (z > 2.50)
    strategy.entry("Enter Short", strategy.short)
- Multi-Dimensional Trend Analysis with ATR-Based Dynamic Stop Management Strategy
- Adaptive Bollinger Bands Mean-Reversion Trading Strategy
- Advanced Multi-Indicator Trend Confirmation Trading Strategy
- Dual Moving Average-RSI Multi-Signal Trend Trading Strategy
- Adaptive Trend Following and Multi-Confirmation Trading Strategy
- Dynamic Stop-Loss Adjustment Elephant Bar Trend Following Strategy
- Dynamic RSI Quantitative Trading Strategy with Multiple Moving Average Crossover
- Multi-Dimensional KNN Algorithm with Volume-Price Candlestick Pattern Trading Strategy
- SMA-Based Intelligent Trailing Stop Strategy with Intraday Pattern Recognition
- Adaptive Multi-Strategy Dynamic Switching System: A Quantitative Trading Strategy Combining Trend Following and Range Oscillation
- Advanced Multi-Indicator Multi-Dimensional Trend Cross Quantitative Strategy
- Heikin-Ashi Trend
- HA Market Bias
- Ichimoku Cloud Smooth Oscillator
- Williams %R - Smoothed
- QQE MOD + SSL Hybrid + Waddah Attar Explosion
- Buy/Sell Strat
- Triple Supertrend with EMA and ADX
- Tom DeMark Sequential Heat Map
- jma + dwma by multigrain
- MAGIC MACD
- This is a list of all the languages spoken in the world.
- 3EMA + Boullinger + PIVOT
- baguette by multigrain
- MilleMachine
- K's Reversal Indicator I
- Engulfing Candles
- MA Emperor insiliconot
- Demark Reversal Points
- Swing Highs/Lows & Candle Patterns
- TMA Overlay