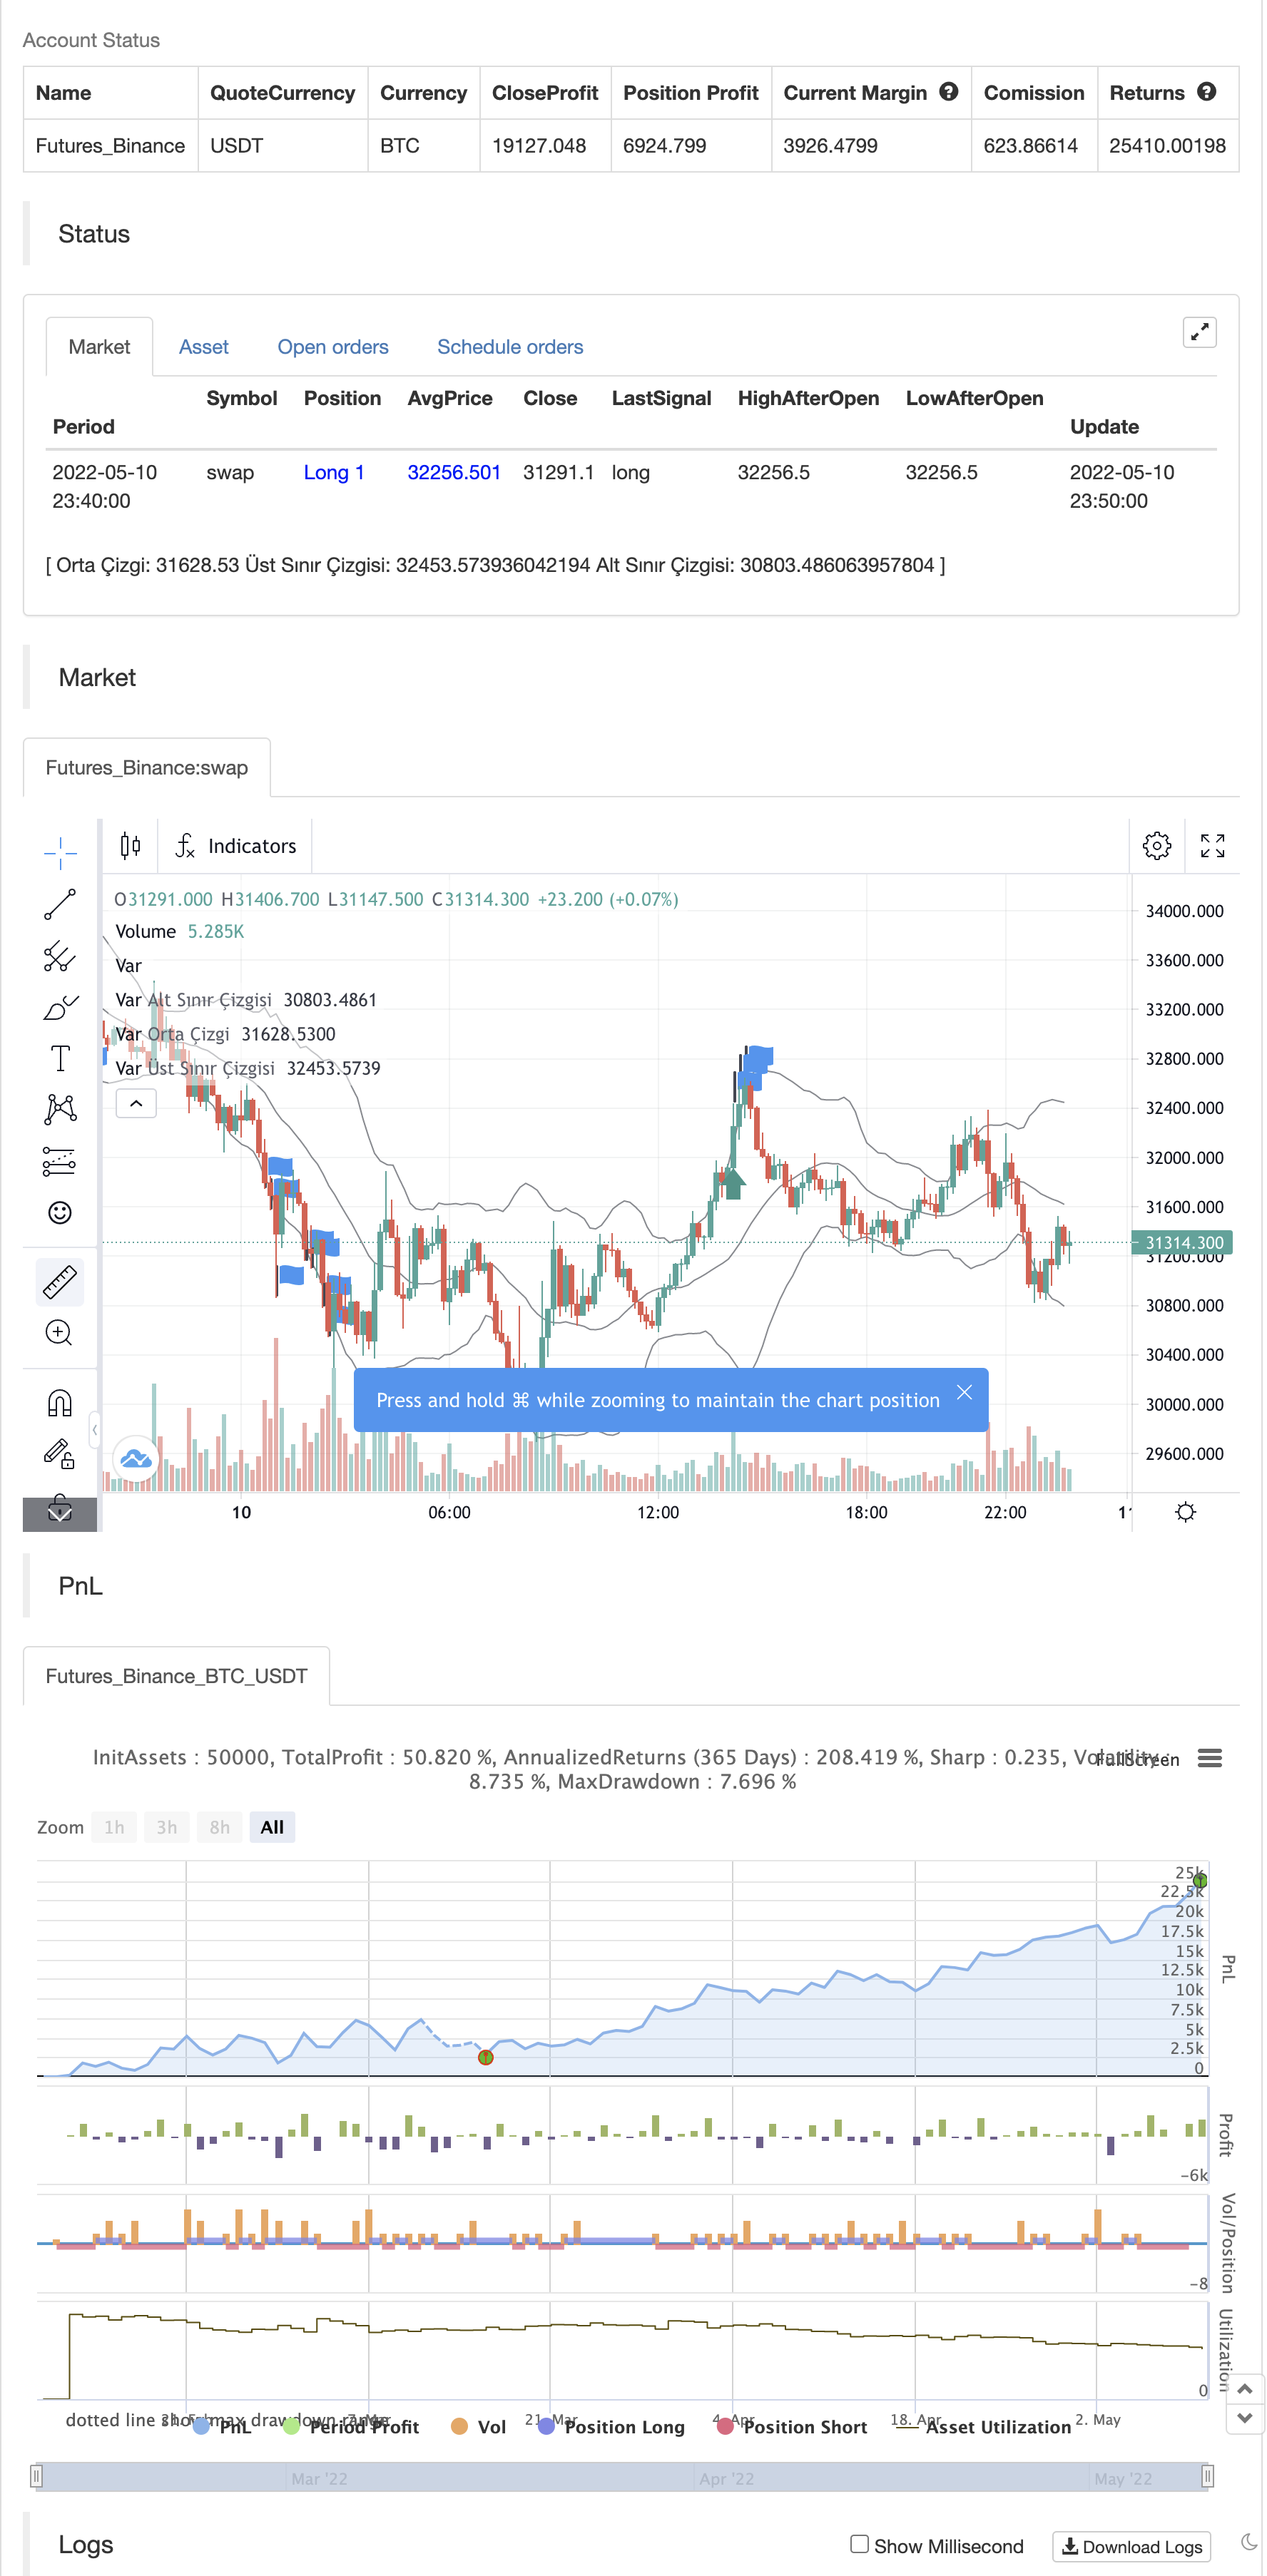
RSI and BBand simultaneously OverSold
Author: ChaoZhang, Date: 2022-05-12 16:49:09Tags: RSI
This indicator is created by combining the standard period RSI indicator with an Oversold limit of 32, an Overbought limit of 70 and a period of 14 (these values can be changed optionally from the entries and still tabs of the indicator settings) and the Bollinger Band . indicator with a standard deviation of 2 and a period of 20. Also, the RSI Oversold is an upward green triangle where the price simultaneously falls below the BB and the lower limit (Low) (i.e. below 32), where the RSI Overbought (i.e. above 70) at the same time the price rises above the BB and the upper limit (Upper) is a downward red triangle. is indicated by a triangle. An alarm condition is established on these conditions. Source codes are posted visually and written in clear language and with explanations for beginners to learn to pine.
backtest

/*backtest
start: 2022-02-11 00:00:00
end: 2022-05-11 00:00:00
period: 10m
basePeriod: 1m
exchanges: [{"eid":"Futures_Binance","currency":"BTC_USDT"}]
*/

//@version=4
study(title="RSI & BB'de aynı anda Oversold Yakalama", shorttitle="RSI&BB OS", overlay=true)


//RSI hesabı ile kaynak ve period seçimi için seçki kutusu ve değer giriş kutuları burada yapıldı
rsiKaynagi = input(title="RSI Kaynagi", type=input.source, defval=close)
rsiPeriodu = input(title="RSI Periodu", type=input.integer, defval=14)
rsiDegeri = rsi(rsiKaynagi, rsiPeriodu)
rsiTabanDegeri = input(title="RSI Taban Değerini gir", type=input.integer, defval=32) // defval: default value yani varsayılan değer
rsiTavanDegeri = input(title="RSI Taban Değerini gir", type=input.integer, defval=70)


// Bollinger Bandı hesabı ve kaynak ve period seçimi için seçki kutusu ve değer giriş kutuları burada yapıldı
bbPeriodu = input(20, minval=1)
bbKaynagi = input(close, title="Source")
standartSapmaDegeri = input(2.0, minval=0.001, maxval=50, title="Standart Sapma")
bandOrtasi = sma(bbKaynagi, bbPeriodu)
sapmaHesabi = standartSapmaDegeri * stdev(bbKaynagi, bbPeriodu)
bbUstSiniri = bandOrtasi + sapmaHesabi
bbAltsiniri = bandOrtasi - sapmaHesabi
bandOrtaCizgisi = plot(bandOrtasi, "Orta Çizgi", color=color.black)
ustSinirCizgisi = plot(bbUstSiniri, "Üst Sınır Çizgisi", color=color.black)
altSinirCizgisi = plot(bbAltsiniri, "Alt Sınır Çizgisi", color=color.black)
fill(ustSinirCizgisi, altSinirCizgisi, title = "Arka Plan", color=color.rgb(33, 150, 243, 95)) // arka plan renkleri RGB cinsinden

// RSI'nin değerinin 20 altındayken aynı anda fiyatın Bollinger Bandının altı sınırının altında olduğu durum için şart oluşturma
bullishkosulu = rsiDegeri<rsiTabanDegeri and low<bbAltsiniri
bearishkosulu = rsiDegeri>rsiTavanDegeri and high>bbUstSiniri

// bu kosulun sağlandığı yerleri belirtilen yazı ve / veya şekille gösterme
plotshape((bullishkosulu)? 1 : 0, style=shape.triangleup, text="Bullish", color=color.green, location=location.belowbar, size=size.small)
plotshape((bearishkosulu)? 1 : 0, style=shape.triangledown, text="Bearish", color=color.red, location=location.abovebar, size=size.small)
//triangleup: yukarı yönlü üçgen
//text: görünmesi istenen yazı
//color: yazı ve şekil rengi
//location: mumun altında mı üstünde mi görünsün
//belowbar: mumun yani barın altında görünsün
//size : büyüklük küçüklük ölçüsü (burada small ile küçük olsun istendi)
alertcondition(bullishkosulu, title="Bullish koşulu üzerine alarm kur", message="{{interval}} - RSI<33 ve Fiyat<BB Lower - {{ticker}} - En düşük fiyat:{{low}} - {{timenow}}")
alertcondition(bearishkosulu, title="Bearish koşulu üzerine alarm kur", message="{{interval}} - RSI>70 ve Fiyat>BB Upper - {{ticker}} - En yüksek fiyat:{{high}} - {{timenow}}")

if bearishkosulu
    strategy.entry("Enter Long", strategy.long)
else if bullishkosulu
    strategy.entry("Enter Short", strategy.short)
- Dynamic Dual-Indicator Momentum Trend Quantitative Strategy System
- Dual Moving Average-RSI Multi-Signal Trend Trading Strategy
- Dynamic EMA System Combined with RSI Momentum Indicator for Optimized Intraday Trading Strategy
- Multi-Technical Indicator Crossover Momentum Trend Following Strategy
- Dynamic Stop-Loss Adjustment Elephant Bar Trend Following Strategy
- Dual-Period RSI Trend Momentum Strategy with Pyramiding Position Management System
- Dynamic RSI Quantitative Trading Strategy with Multiple Moving Average Crossover
- Dynamic Trend RSI Indicator Crossing Strategy
- Multi-Dimensional KNN Algorithm with Volume-Price Candlestick Pattern Trading Strategy
- Adaptive Multi-Strategy Dynamic Switching System: A Quantitative Trading Strategy Combining Trend Following and Range Oscillation
- Advanced Multi-Indicator Multi-Dimensional Trend Cross Quantitative Strategy
- Crodl's Supertrend
- RSI by zdmre
- FTL - Range Filter X2 + EMA + UO
- BRAHMASTRA
- Mobo Bands
- SAR + 3SMMA with SL & TP
- SSS
- Moon Launch Alerts Template [Indicator]
- HALFTREND + HEMA + SMA (FALSE SIGNAL's STRATEGY)
- RSI Divergence with Pivot, BB, SMA, EMA, SMMA, WMA, VWMA
- Rolling Heikin Ashi Candles
- Combo 2/20 EMA & Bandpass Filter
- ESSMA
- 3EMA
- Pivot Order Blocks
- NMVOB-S
- Moving Average Colored EMA/SMA
- MAHL Band
- 3 Supertrend Add In This Single Script
- Swing High/Low Indicator w/ MACD and EMA Confirmations