Mobo Bands
Author: ChaoZhang, Date: 2022-05-13 14:27:58Tags: SMA
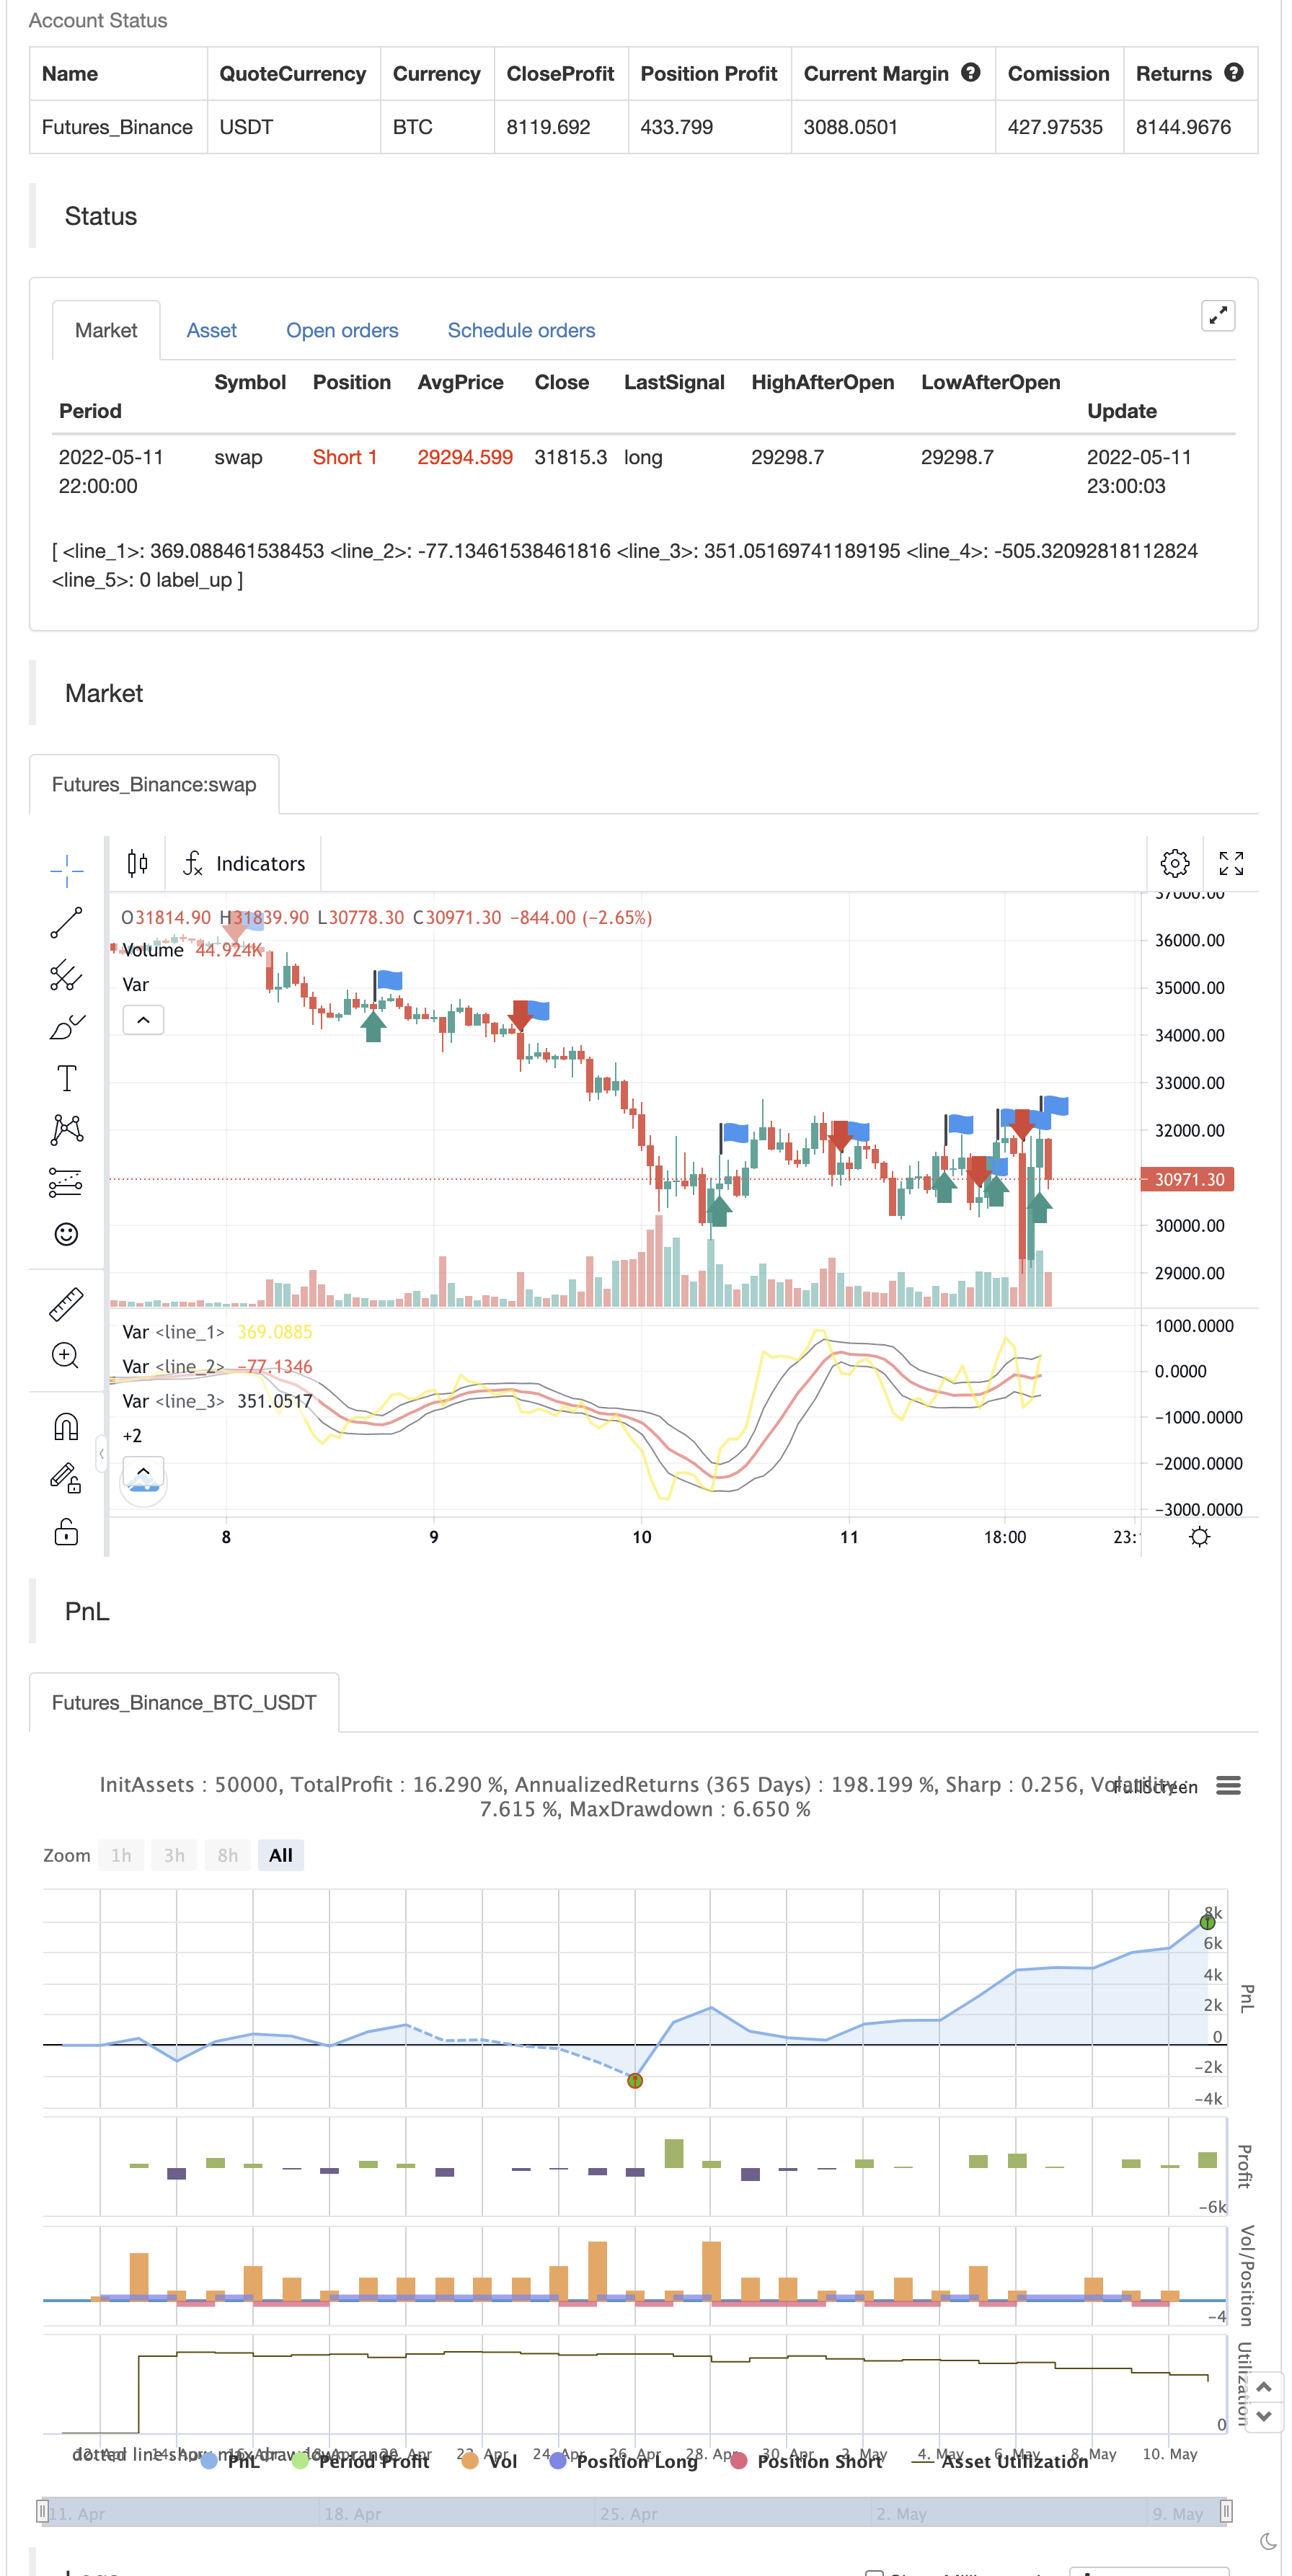
This indicator is the Mobo Bands (Momentum Breakout Bands). These bands are bollinger bands that have an adjusted standard deviation. There are Buy signals when it has momentum breakouts above the bands for moves to the upside and Sell signals when it has momentum breakouts below the bands for moves to the downside. The bands simply suggest that all markets have periods of chop which we all know to be true. While the price is inside the bands it is said to be trendless. Once the breakouts happen you can take trades in the breakout direction. I like to use these to swing trade options on the hourly timeframe but the bands should work on most instruments and timeframes. I like to use it to take swings on SPY on the 1 hour chart for entries and use the Daily chart for trend confirmation.
backtest

/*backtest
start: 2022-04-12 00:00:00
end: 2022-05-11 23:59:00
period: 1h
basePeriod: 15m
exchanges: [{"eid":"Futures_Binance","currency":"BTC_USDT"}]
*/

//@version=4
study("Mobo Bands", overlay=false)

price           = input(hl2, "Price")
colorNormLength = input(3, "colorNormLength", input.integer)
dpoLength       = input(13, "dpoLength", input.integer)
moboDisplace    = input(0, "moboDisplace", input.integer)
moboLength    = input(10, "moboLength", input.integer)

numDevDn  = input(-0.8, "numDevDn", input.float)
numDevUp  = input(0.8, "numDevUp", input.float)

coloredMobo     = input(true, "coloredMobo")
coloredFill     = input(true, "coloredFill")
breakArrows     = input(true, "breakArrows")
moboShowMid     = input(true, "moboShowMid")


//def DPO = price - Average(price[DPO_length / 2 + 1], DPO_length);
xsma = sma(price[int(dpoLength / 2 + 1)], dpoLength)
//alert(int(dpoLength / 2 + 1))
//xsma = sma(price, dpoLength)
DPO = price - xsma


Midline = sma(DPO, moboLength)

sDev = stdev(DPO, moboLength)

LowerBand = Midline + numDevDn * sDev
UpperBand = Midline + numDevUp * sDev

plot(DPO, color=color.yellow,linewidth=2)

plot(Midline, color=Midline > Midline[1] ? color.lime : color.red,linewidth=2)

Upper = plot(UpperBand, color=color.black,linewidth=1)
Lower = plot(LowerBand, color=color.black,linewidth=1)

plot(0, color=color.white,linewidth=1)

Signal1 = DPO > UpperBand and DPO[1] < UpperBand[1]
Signal2 = DPO < LowerBand and DPO[1] > LowerBand[1]

wasUp = 1
wasDn = 1

wasUp := Signal1 ? 1 : (Signal2 ? 0 : nz(wasUp[1]))
wasDn := Signal2 ? 1 : (Signal1 ? 0 : nz(wasDn[1]))

//plotshape(Signal1 and wasDn[1] ? UpperBand : na, style=shape.arrowup, location=location.absolute, size=size.normal, color=color.red)
//plotshape(Signal2 and wasUp[1] ? LowerBand : na, style=shape.arrowdown, location=location.absolute, size=size.normal, color=color.green)

plotshape(Signal1 and wasDn[1] ? UpperBand : na, style=shape.labelup, location=location.absolute, size=size.normal, color=color.green, text="Buy",textcolor=color.white)
plotshape(Signal2 and wasUp[1] ? LowerBand : na, style=shape.labeldown, location=location.absolute, size=size.normal, color=color.red, text="Sell",textcolor=color.white)


//fill(Upper, Lower, color=color.purple)

alertcondition(Signal1 and wasDn[1], "Break Out Arrow", "Break Out Arrow")
alertcondition(Signal2 and wasUp[1], "Break Down Arrow", "Break Down Arrow")


if Signal1 and wasDn[1]
    strategy.entry("Enter Long", strategy.long)
else if Signal2 and wasUp[1]
    strategy.entry("Enter Short", strategy.short)
- Multi-Dimensional Trend Analysis with ATR-Based Dynamic Stop Management Strategy
- Adaptive Bollinger Bands Mean-Reversion Trading Strategy
- Advanced Multi-Indicator Trend Confirmation Trading Strategy
- Dual Moving Average-RSI Multi-Signal Trend Trading Strategy
- Adaptive Trend Following and Multi-Confirmation Trading Strategy
- Dynamic Stop-Loss Adjustment Elephant Bar Trend Following Strategy
- Dynamic RSI Quantitative Trading Strategy with Multiple Moving Average Crossover
- Multi-Dimensional KNN Algorithm with Volume-Price Candlestick Pattern Trading Strategy
- SMA-Based Intelligent Trailing Stop Strategy with Intraday Pattern Recognition
- Adaptive Multi-Strategy Dynamic Switching System: A Quantitative Trading Strategy Combining Trend Following and Range Oscillation
- Advanced Multi-Indicator Multi-Dimensional Trend Cross Quantitative Strategy
- Ghost Trends is tracking a strategic business database
- How to track ghostly trends
- Rainbow Oscillator
- Trading the Equity Curve Position Sizing Example
- KLineChart Demo
- Villa Dinamic Pivot Supertrend Strategy
- Crodl's Supertrend
- RSI by zdmre
- FTL - Range Filter X2 + EMA + UO
- BRAHMASTRA
- SAR + 3SMMA with SL & TP
- SSS
- Moon Launch Alerts Template [Indicator]
- HALFTREND + HEMA + SMA (FALSE SIGNAL's STRATEGY)
- RSI Divergence with Pivot, BB, SMA, EMA, SMMA, WMA, VWMA
- RSI and BBand simultaneously OverSold
- Rolling Heikin Ashi Candles
- Combo 2/20 EMA & Bandpass Filter
- ESSMA
- 3EMA