EMA TREND CLOUD
Author: ChaoZhang, Date: 2022-05-18 15:32:51Tags: EMA
***THIS IS NOT TRADING ADVICE - THERE ARE NO GUARANTEES - USE AT YOUR OWN RISK***
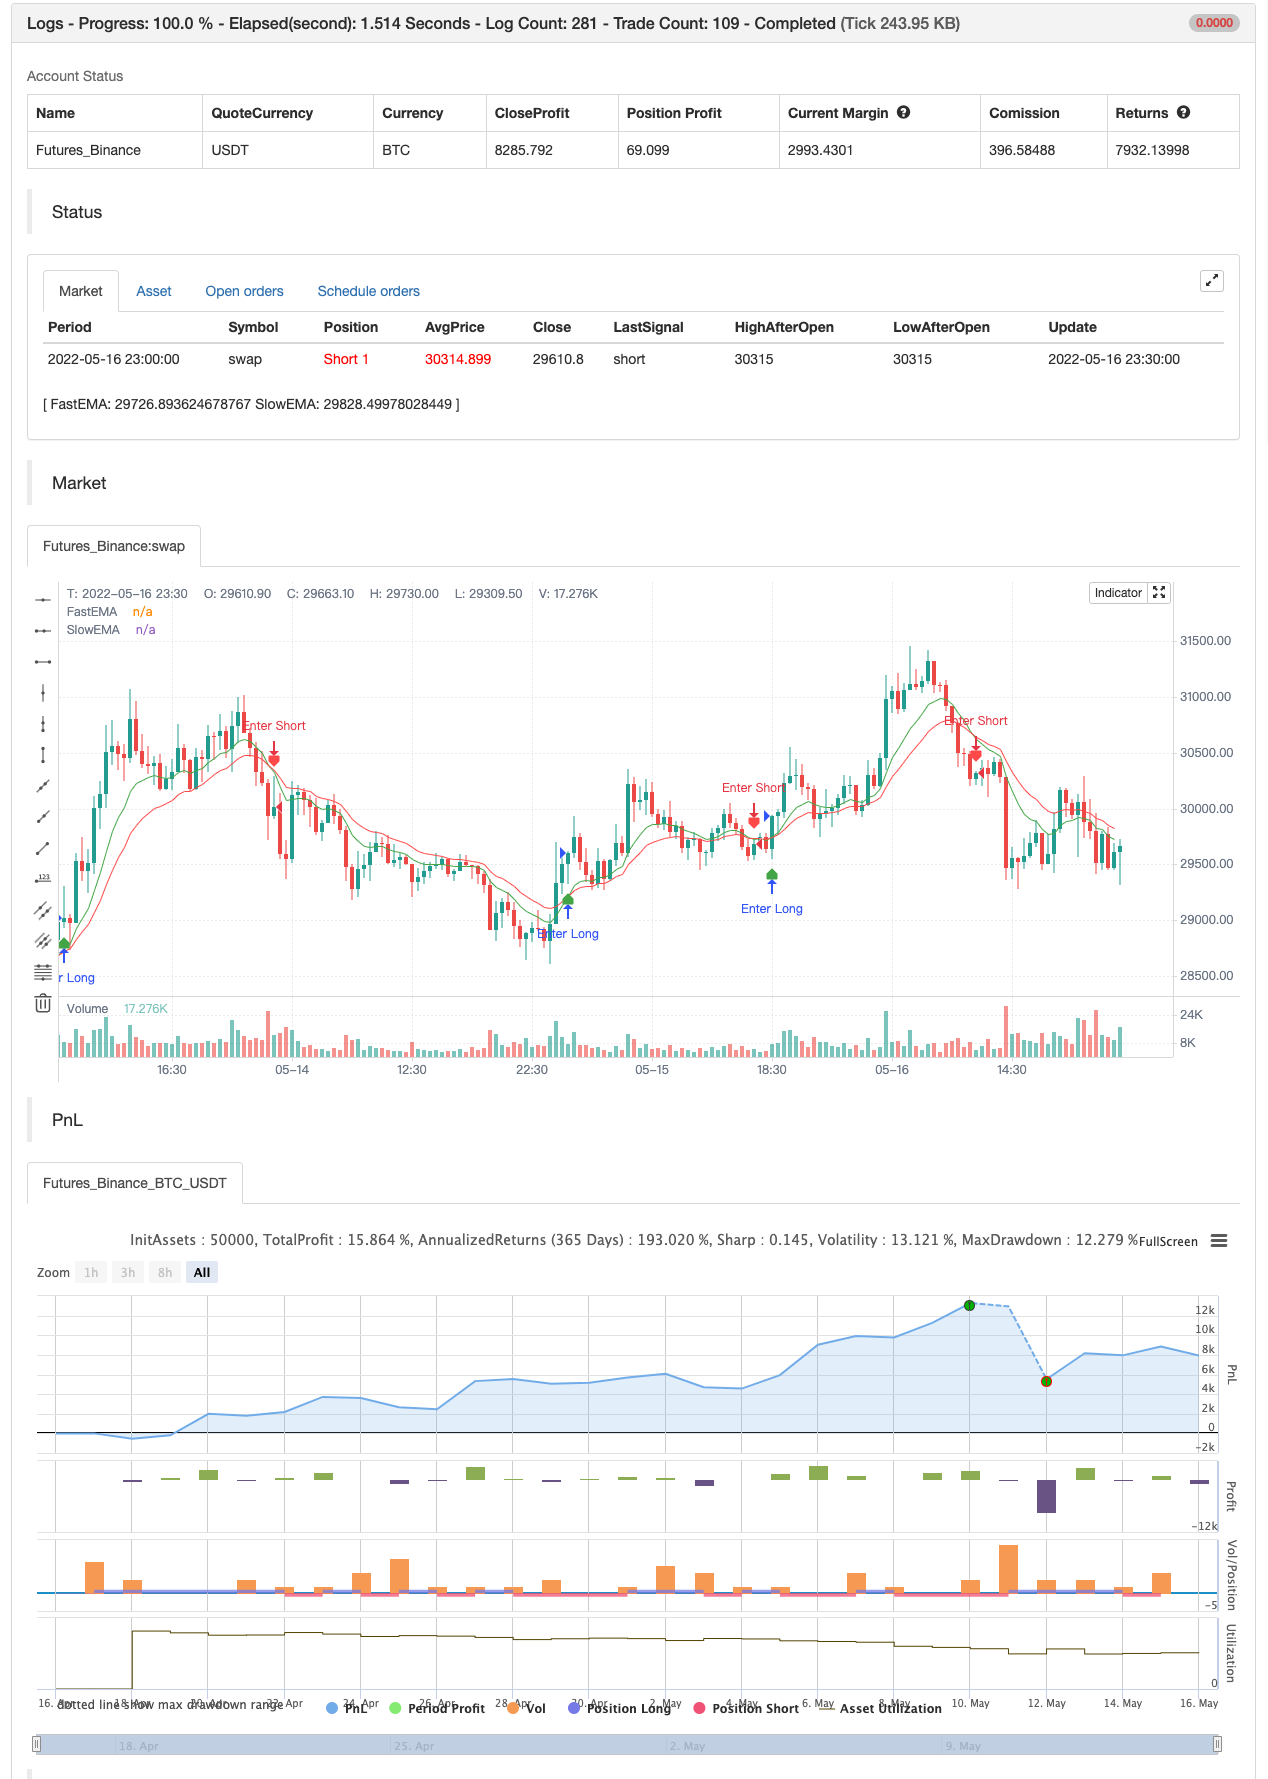
Plots the 9 and 20 period exponential moving averages ( EMA ) and paints a cloud between, visually identifiying the intraday trend and the strength of it. Green cloud for long, red cloud for short. The thicker the cloud the stronger the trend. Long play entry is when the 9 EMA crosses above the 20 EMA causing the cloud to turn green, opposite for short.
Aggressive entry is at the close of the bar that causes the cross to happen. Conservative entry is when the second bar after the cross closes above the 9 EMA and is in the direction of the play.
Exits can happen when price closes in the cloud or on the opposite side of the cloud or when the averages cross in the opposite direction of the trade depending on the individual’s risk tolerance.
***THIS IS NOT TRADING ADVICE - THERE ARE NO GUARANTEES - USE AT YOUR OWN RISK***
backtest

/*backtest
start: 2022-04-17 00:00:00
end: 2022-05-16 23:59:00
period: 30m
basePeriod: 15m
exchanges: [{"eid":"Futures_Binance","currency":"BTC_USDT"}]
args: [["v_input_1",10],["v_input_2",18]]
*/

// This source code is subject to the terms of the Mozilla Public License 2.0 at https://mozilla.org/MPL/2.0/
// © Ron Westbrook (discord: disturbinglymellow#4075)
// Date: 5/17/2021
// Description: Plots two exponential moving averages and places a colored cloud between to indicate trend direction. Default values of 9 and 20 periods have worked well for me, but inputs are available if you choose to change them. If you like my work and want to support more of it please consider leaving me a tip here. https://tinyurl.com/tipron


//@version=5
indicator(title='EMA TREND CLOUD', overlay=true)

fastLen = input(title='Fast EMA Length', defval=9)
slowLen = input(title='Slow EMA Length', defval=20)
useTextLabels = input.bool(true, title='Use Text-Based Crossover Labels?', group='Crossover Moving Averages')

fastEMA = ta.ema(close, fastLen)
slowEMA = ta.ema(close, slowLen)

fema = plot(fastEMA, title='FastEMA', color=color.new(color.green, 0), linewidth=1, style=plot.style_line)
sema = plot(slowEMA, title='SlowEMA', color=color.new(color.red, 0), linewidth=1, style=plot.style_line)

fill(fema, sema, color=fastEMA > slowEMA ? color.new(#417505, 50) : color.new(#890101, 50), title='Cloud')

// Bull and Bear Alerts
Bull = ta.crossover(fastEMA, slowEMA)
Bear = ta.crossunder(fastEMA, slowEMA)

plotshape(Bull, title='Calls Label', color=color.new(color.green, 25), textcolor=useTextLabels ? color.white : color.new(color.white, 100), style=useTextLabels ? shape.labelup : shape.triangleup, text='Calls', location=location.belowbar)

plotshape(Bear, title='Puts Label', color=color.new(color.red, 25), textcolor=useTextLabels ? color.white : color.new(color.white, 100), style=useTextLabels ? shape.labeldown : shape.triangledown, text='Puts', location=location.abovebar)


if Bull
    alert('Calls Alert: 9ema crossed over 20ema', alert.freq_once_per_bar_close)
if Bear
    alert('Puts Alert: 9ema crossed under 20ema', alert.freq_once_per_bar_close)


if Bull
    strategy.entry("Enter Long", strategy.long)
else if Bear
    strategy.entry("Enter Short", strategy.short)
- Multi-Dimensional Trend Analysis with ATR-Based Dynamic Stop Management Strategy
- Advanced Multi-Indicator Trend Confirmation Trading Strategy
- Adaptive Trend Following and Multi-Confirmation Trading Strategy
- Dynamic EMA System Combined with RSI Momentum Indicator for Optimized Intraday Trading Strategy
- Multi-Technical Indicator Crossover Momentum Trend Following Strategy
- EMA Trend with Round Number Breakout Trading Strategy
- Dynamic RSI Quantitative Trading Strategy with Multiple Moving Average Crossover
- Dynamic Trend RSI Indicator Crossing Strategy
- Dual Crossover Trend Following Strategy: EMA and MACD Synergistic Trading System
- Advanced Multi-Indicator Multi-Dimensional Trend Cross Quantitative Strategy
- Multi-Smoothed Moving Average Dynamic Crossover Trend Following Strategy with Multiple Confirmations
- ATR Smoothed
- Order Block Finder
- TrendScalp-FractalBox-3EMA
- QQE signals
- U-bit grid amplitude filtering
- CM MACD Custom Indicator - Multiple Time Frame - V2
- HODL LINE
- 2 Moving Average Color Direction Detection
- Scalping PullBack Tool R1
- Buy&Sell Strategy depends on AO+Stoch+RSI+ATR
- RedK Volume-Accelerated Directional Energy Ratio
- Donchian Breakout no repaint
- RedK Momentum Bars
- SuperJump Turn Back Bollinger Band
- Fukuiz Trend
- Johny's BOT
- SSL Hybrid
- Chandelier Exit
- RISOTTO
- EMA Cloud Intraday Strategy
bwxiaokI can't understand English.