Bollinger Bands Stochastic RSI Extreme
Author: ChaoZhang, Date: 2022-05-31 19:16:17Tags: RSIBoll
This is the finalized code released to the public that I created in a video linked here.
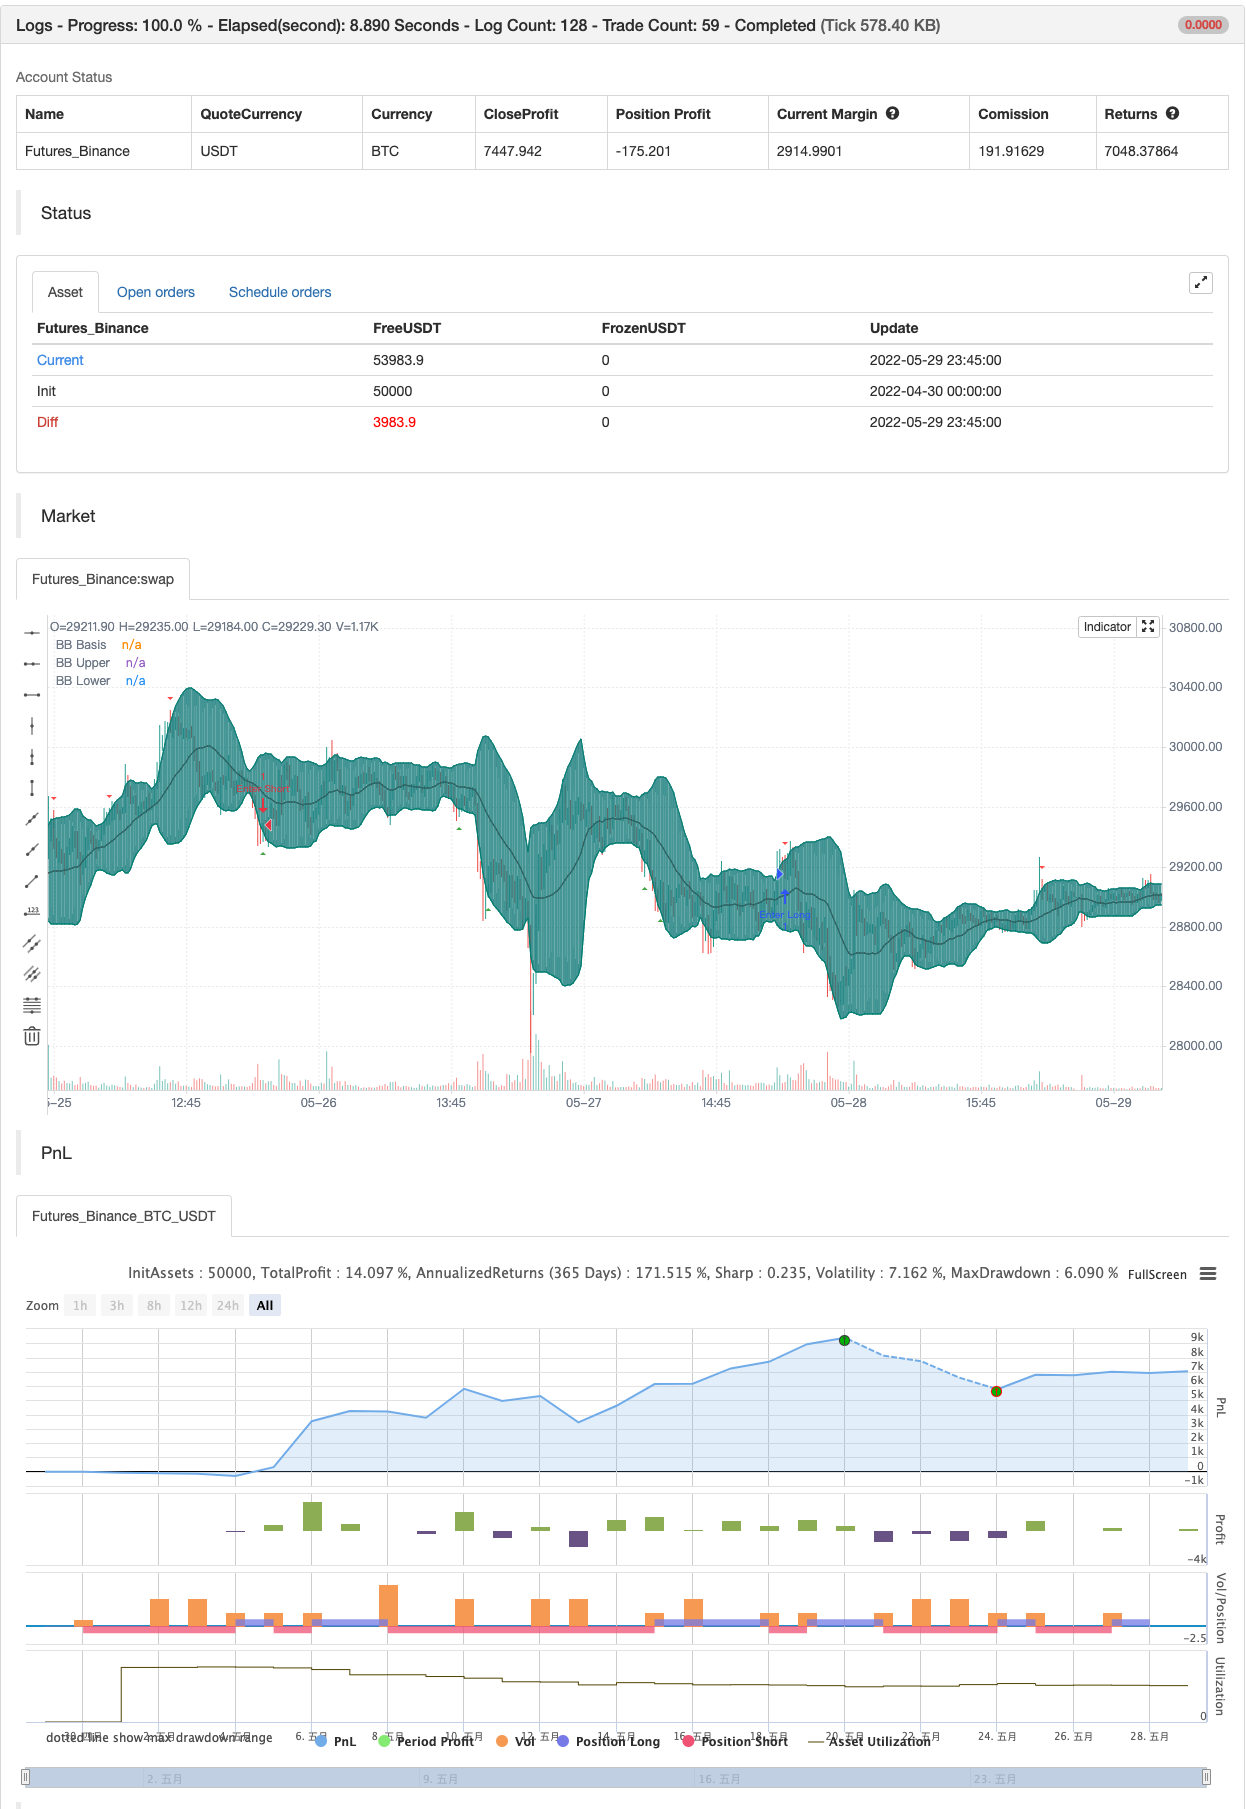
This indicators combines a Bollinger Band and Stochastic RSI to produce signals for possible price reversal. The signals are displayed by default as green arrows for bullish and red arrows for bearish .
To trigger a signal the indicator checks for the following:
( Bullish ) A candle closes above the upper Bollinger Band The following candle closes within the upper Bollinger Band The RSI Stochastic is below the set threshold (10 by default)
( Bearish ) A candle closes below the lower Bollinger Band The following candle closes within the lower Bollinger Band The RSI Stochastic is above the set threshold (90 by default)
backtest

/*backtest
start: 2022-04-30 00:00:00
end: 2022-05-29 23:59:00
period: 15m
basePeriod: 5m
exchanges: [{"eid":"Futures_Binance","currency":"BTC_USDT"}]
*/

//@version=4
study(shorttitle="BBSR Extreme", title="Bollinger Bands Stochastic RSI Extreme Signal", overlay=true, resolution="")

//General Inputs
src = input(close, title="Source")
offset = input(0, "Offset", type = input.integer, minval = -500, maxval = 500)

//Bollinger Inputs
length = input(20, title="Bollinger Band Length", minval=1)
mult = input(2.0, minval=0.001, maxval=50, title="StdDev")

//Bollinger Code
basis = sma(src, length)
dev = mult * stdev(src, length)
upper = basis + dev
lower = basis - dev
plot(basis, "BB Basis", color=#872323, offset = offset)
p1 = plot(upper, "BB Upper", color=color.teal, offset = offset)
p2 = plot(lower, "BB Lower", color=color.teal, offset = offset)
fill(p1, p2, title = "BB Background", color=#198787, transp=95)


//Stoch Inputs
smoothK = input(3, "K", minval=1)
smoothD = input(3, "D", minval=1)
lengthRSI = input(14, "RSI Length", minval=1)
lengthStoch = input(14, "Stochastic Length", minval=1)

upperlimit = input(90, "Upper Limit", minval=0.01)
lowerlimit = input(10, "Upper Limit", minval=0.01)

//Stochastic Code
rsi1 = rsi(src, lengthRSI)
k = sma(stoch(rsi1, rsi1, rsi1, lengthStoch), smoothK)
d = sma(k, smoothD)

//Evaluation
Bear = close[1] > upper[1] and close < upper
     and k[1] > upperlimit and d[1] > upperlimit
Bull = close[1] < lower[1] and close > lower
     and k[1] < lowerlimit and d[1] < lowerlimit


//Plots
plotshape(Bear, style=shape.triangledown, location=location.abovebar,
     color=color.red, size=size.tiny)
plotshape(Bull, style=shape.triangleup, location=location.belowbar,
     color=color.green, size=size.tiny)

// Alert Functionality
alertcondition(Bear or Bull, title="Any Signal", message="{{exchange}}:{{ticker}}" + " {{interval}}" + " BB Stochastic Extreme!")
alertcondition(Bear, title="Bearish Signal", message="{{exchange}}:{{ticker}}" + " {{interval}}" + " Bearish BB Stochastic Extreme!")
alertcondition(Bull, title="Bullish Signal", message="{{exchange}}:{{ticker}}" + " {{interval}}" + " Bullish BB Stochastic Extreme!")


if Bear
    strategy.entry("Enter Long", strategy.long)
else if Bull
    strategy.entry("Enter Short", strategy.short)
Related
- Multi-Indicator Intelligent Pyramiding Strategy
- Multi-Period EMA Trend Following with RSI Overbought/Oversold Dynamic Optimization Strategy
- Nifty 50 3-Minute Opening Range Breakout Strategy
- Elliott Wave Theory 4-9 Impulse Wave Automatic Detection Trading Strategy
- High-Frequency Reversal Trading Strategy Based on Momentum RSI Indicator
- Relative Strength Index - Divergences - Libertus
- RSI Dynamic Range Reversal Quantitative Strategy with Volatility Optimization Model
- RSI Direction Change Strategy
- RSI+Supertrend Trend-Following Trading Strategy
- RSI Relative Strength Index Strategy
More
- Range Filter Buy and Sell 5min [Strategy]
- Inverted Hammer - Extended Options
- TUE ADX/MACD Confluence V1.0
- Twin Range Filter
- SAR -high and low
- Accurate Swing Trading System
- Linear trend
- Fibonacci Timing Pattern
- Darvas Box Buy Sell
- Demark Setup Indicator
- AK MACD BB INDICATOR V 1.00
- Parabolic SAR
- RSI Divergence Indicator
- OBV MACD Indicator
- Pivot Trend
- Price Divergence Strategy v1.0
- Support-Resistance breakout
- Slope Adaptive Moving Average
- Delta-RSI Oscillator Strategy
- Low Scanner strategy crypto