short-term trading strategy
Author: ChaoZhang, Date: 2023-10-25 14:40:21Tags:

Overview
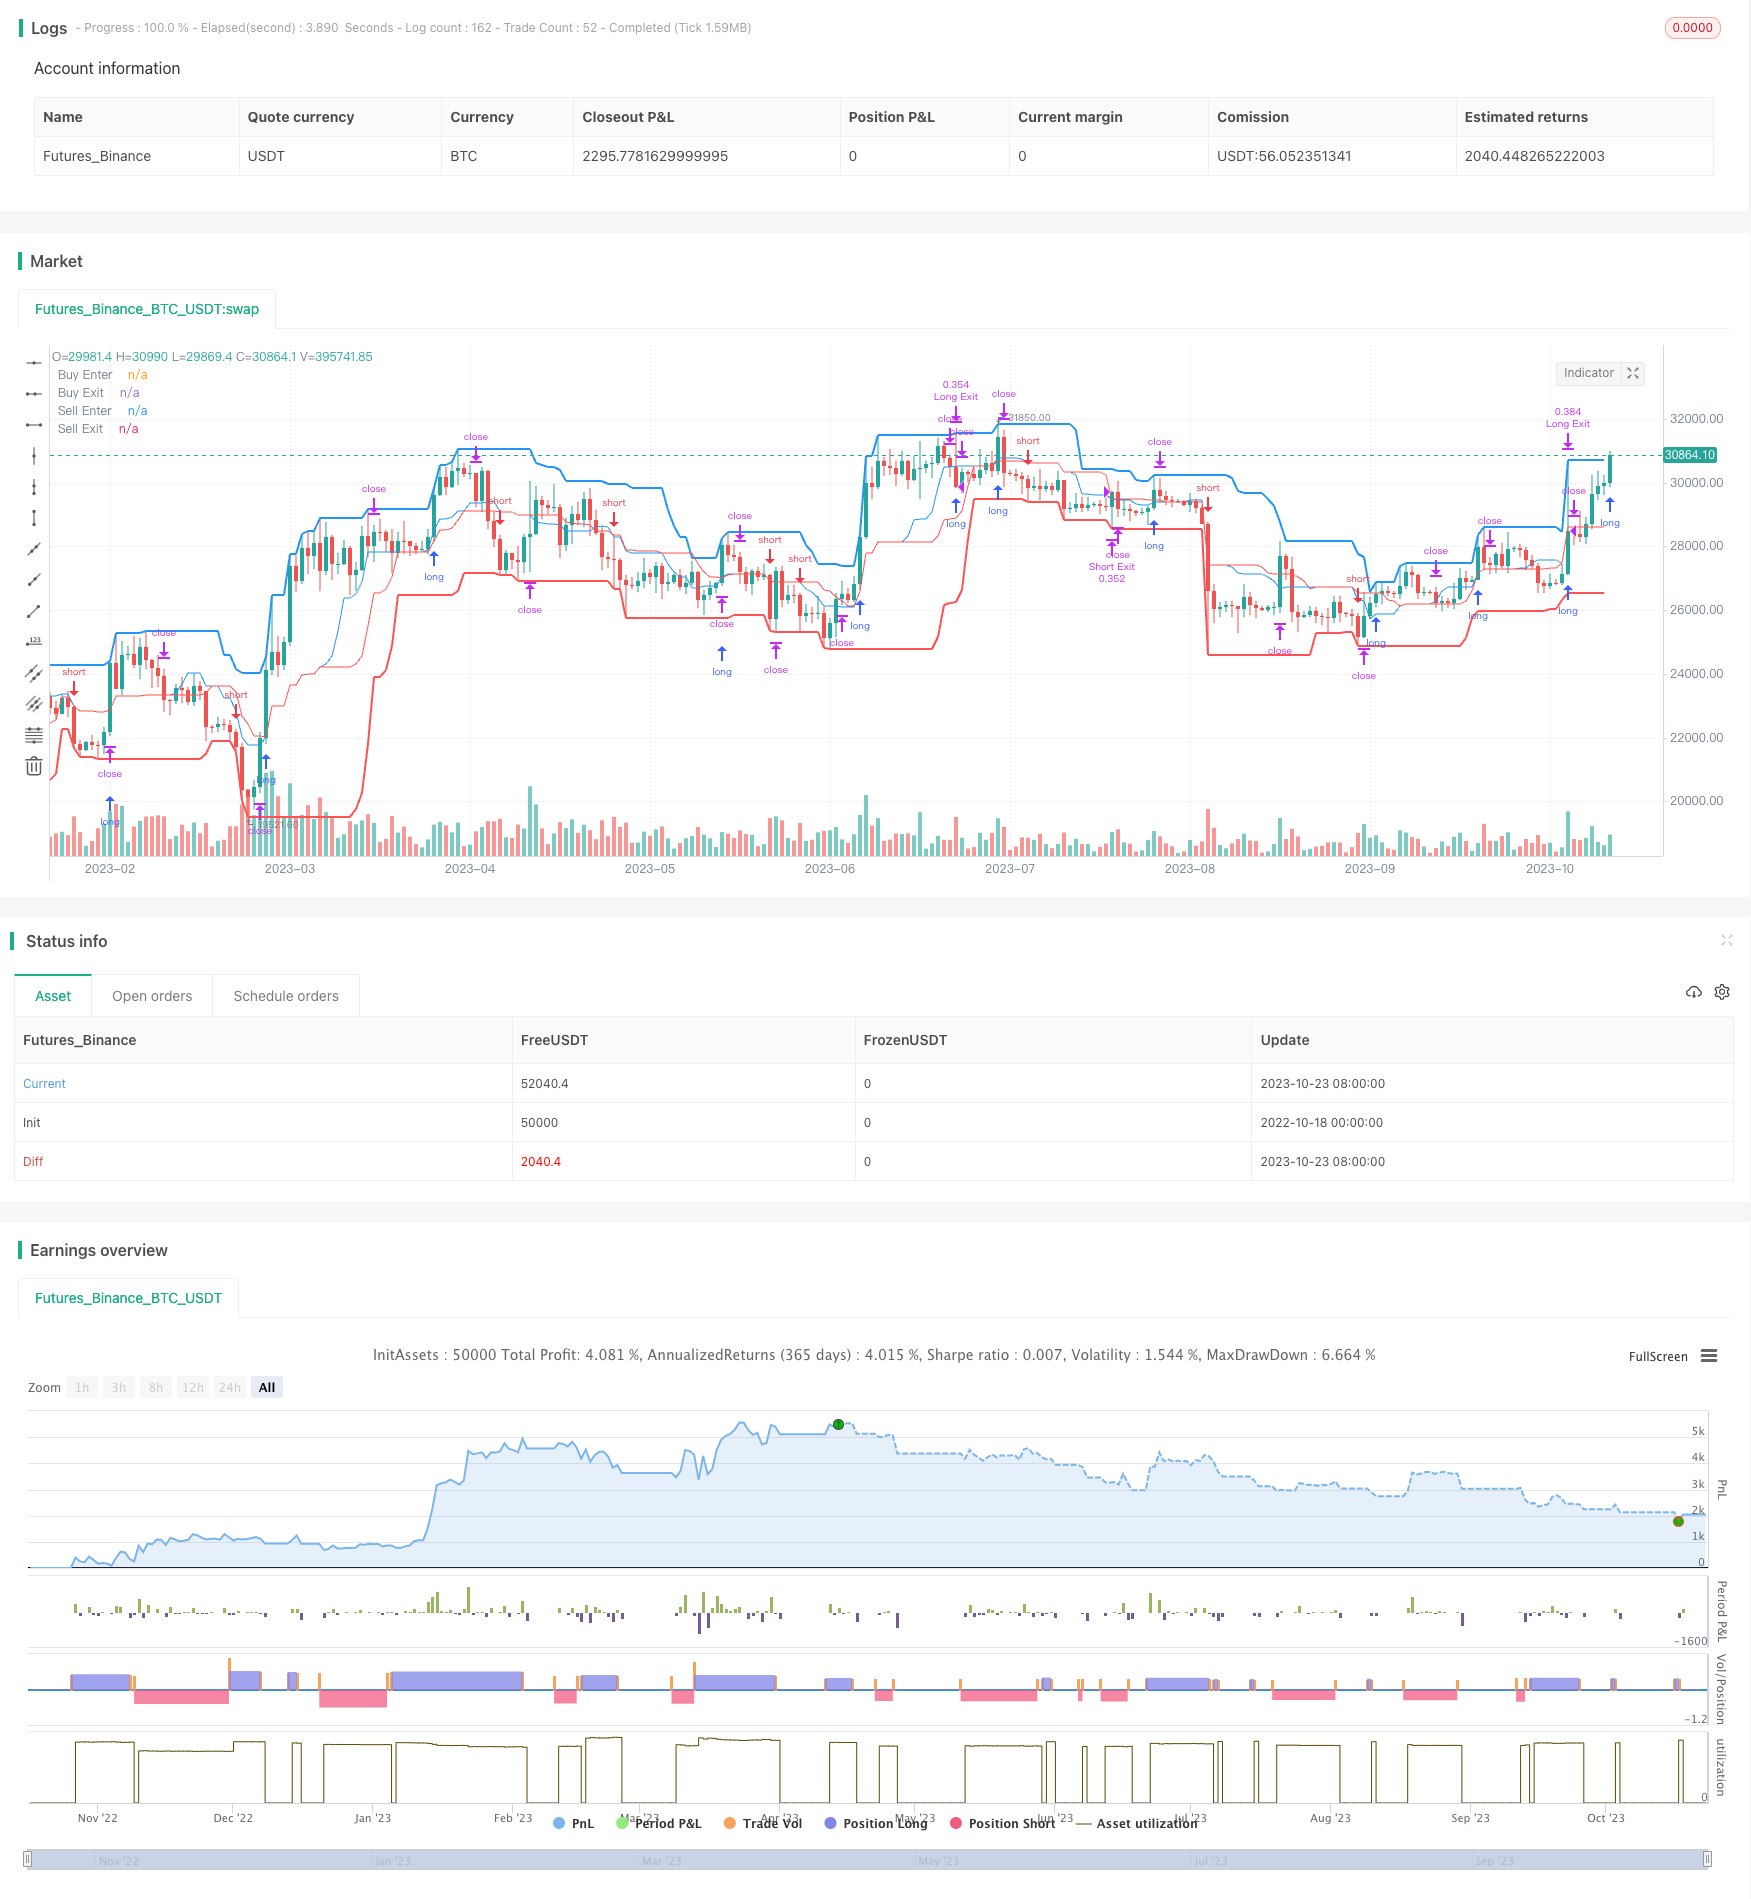
This is a short-term trading strategy based on channel breakouts. It uses the breakouts of channel’s upper and lower rail to determine the start and end of trends, and make trading decisions accordingly. In strong trending markets, this breakout strategy can generate decent profits.
Strategy Logic
The strategy first calculates the highest high and lowest low over a certain period to build the upper and lower rail of the channel.
If price breaks out above the upper rail, go long. If price breaks below the lower rail, go short.
Use a moving stop loss to control risks. The stop loss is set at the middle line of the channel.
There are two optional exit rules: revert to the middle line or follow the moving stop loss. The former realizes profit quickly while the latter controls risks.
The channel period and other parameters can be tuned to optimize the strategy for different market conditions.
Advantage Analysis
Simple to implement. Just monitor the price-channel relationship and follow the rules to trade.
Trade along the trend, no counter-trend risks.
Clear and intuitive channel gives explicit entry signals.
Good profit margin, can achieve satisfactory returns in most cases.
Many adjustable parameters for optimization across different markets.
Risk Analysis
Breakout may fail, risks of being trapped exist. Timely stop loss needed.
Channel needs a period to form, not suitable for range-bound markets.
Revert to middle stop loss may be too conservative, unable to hold trends.
Parameter optimization needs historical data, overfitting possible in live trading.
Mechanical trading of breakout points may increase trade frequency and slippage costs.
Optimization Directions
Evaluate channels of different periods and select the optimal one.
Test reverting to middle and moving stop loss to find a better exit mechanism.
Optimize the stop loss percentage to reduce chances of being stopped out.
Add trend filter to avoid inappropriate breakout trades.
Consider increasing position size but control risks.
Summary
Overall this is a mature short-term breakout strategy. It has clear entry rules, proper risk control, and works well in general. Further improvement can be achieved through parameter tuning. But inherent limitations should be noted, adjustments needed for different markets. If used systematically, it should deliver consistent overall profits.
/*backtest
start: 2022-10-18 00:00:00
end: 2023-10-24 00:00:00
period: 1d
basePeriod: 1h
exchanges: [{"eid":"Futures_Binance","currency":"BTC_USDT"}]
*/

// This source code is subject to the terms of the Mozilla Public License 2.0 at https://mozilla.org/MPL/2.0/
// Strategy testing and optimisation for free Bitmex trading bot
// © algotradingcc

//@version=4
strategy("Channel Break [for free bot]", overlay=true, default_qty_type= strategy.percent_of_equity, initial_capital = 1000, default_qty_value = 20, commission_type=strategy.commission.percent, commission_value=0.075)

//Options
buyPeriod = input(13, "Channel Period for Long position")
sellPeriod = input(18, "Channel Period for Short position")
isMiddleExit = input(true, "Is exit on Base Line?")
takeProfit = input(46, "Take Profit (%) for position")
stopLoss = input(9, "Stop Loss (%) for position")

// Test Start
startYear = input(2005, "Test Start Year")
startMonth = input(1, "Test Start Month")
startDay = input(1, "Test Start Day")
startTest = timestamp(startYear,startMonth,startDay,0,0)

//Test End
endYear = input(2050, "Test End Year")
endMonth = input(12, "Test End Month")
endDay = input(30, "Test End Day")
endTest = timestamp(endYear,endMonth,endDay,23,59)

timeRange = time > startTest and time < endTest ? true : false

// Long&Short Levels
BuyEnter = highest(buyPeriod)
BuyExit = isMiddleExit ? (highest(buyPeriod) + lowest(buyPeriod)) / 2: lowest(buyPeriod)

SellEnter = lowest(sellPeriod)
SellExit = isMiddleExit ? (highest(sellPeriod) + lowest(sellPeriod)) / 2: highest(sellPeriod)

// Plot Data
plot(BuyEnter, style=plot.style_line, linewidth=2, color=color.blue, title="Buy Enter")
plot(BuyExit, style=plot.style_line, linewidth=1, color=color.blue, title="Buy Exit", transp=50)
plot(SellEnter, style=plot.style_line, linewidth=2, color=color.red, title="Sell Enter")
plot(SellExit, style=plot.style_line, linewidth=1, color=color.red, title="Sell Exit", transp=50)

// Calc Take Profits & Stop Loss
TP = 0.0
SL = 0.0
if strategy.position_size > 0
    TP := strategy.position_avg_price*(1 + takeProfit/100)
    SL := strategy.position_avg_price*(1 - stopLoss/100)

if strategy.position_size > 0 and SL > BuyExit
    BuyExit := SL

if strategy.position_size < 0
    TP := strategy.position_avg_price*(1 - takeProfit/100)
    SL := strategy.position_avg_price*(1 + stopLoss/100)

if strategy.position_size < 0 and SL < SellExit
    SellExit := SL


// Long Position
if timeRange and strategy.position_size <= 0
    strategy.entry("Long", strategy.long, stop = BuyEnter)
strategy.exit("Long Exit", "Long", stop=BuyExit, limit = TP, when = strategy.position_size > 0)


// Short Position
if timeRange and strategy.position_size >= 0
    strategy.entry("Short", strategy.short, stop = SellEnter)

strategy.exit("Short Exit", "Short", stop=SellExit, limit = TP, when = strategy.position_size < 0)

// Close & Cancel when over End of the Test
if time > endTest
    strategy.close_all()
    strategy.cancel_all()
- Gradual Accumulation Breakout Trading Strategy
- Dynamic Candle Direction Strategy
- RSI Divergence Trading Strategy
- Multi-indicator Decision Based Short Term Trend Strategy
- Multi Timeframe MACD Heatmap Strategy
- Double Moving Average Crossover Strategy
- ATR Adjustable Trailing Stop Loss Strategy
- Bollinger Band Width Scaling Double Moving Average Trend Filter Strategy
- Gradient Trailing Stop Loss Strategy
- Bollinger Bands and RSI indicators strategy
- Ichimoku Balance Line trend following Strategy
- Dual EMA Spread Breakout Strategy
- Contrarian Breakout Trading Strategy
- Williams VIX Fix Strategy
- RSI Dual-rail Oscillation Line Long and Short Bi-directional Trading Strategy
- Multi-factor Momentum Rotation Strategy
- RSI EMA Crossover Strategy
- Trend Following Dual Moving Average Strategy
- Glory Hole Breakout Strategy
- Heiken Ashi Moving Average Crossover Strategy with MACD Filter V3