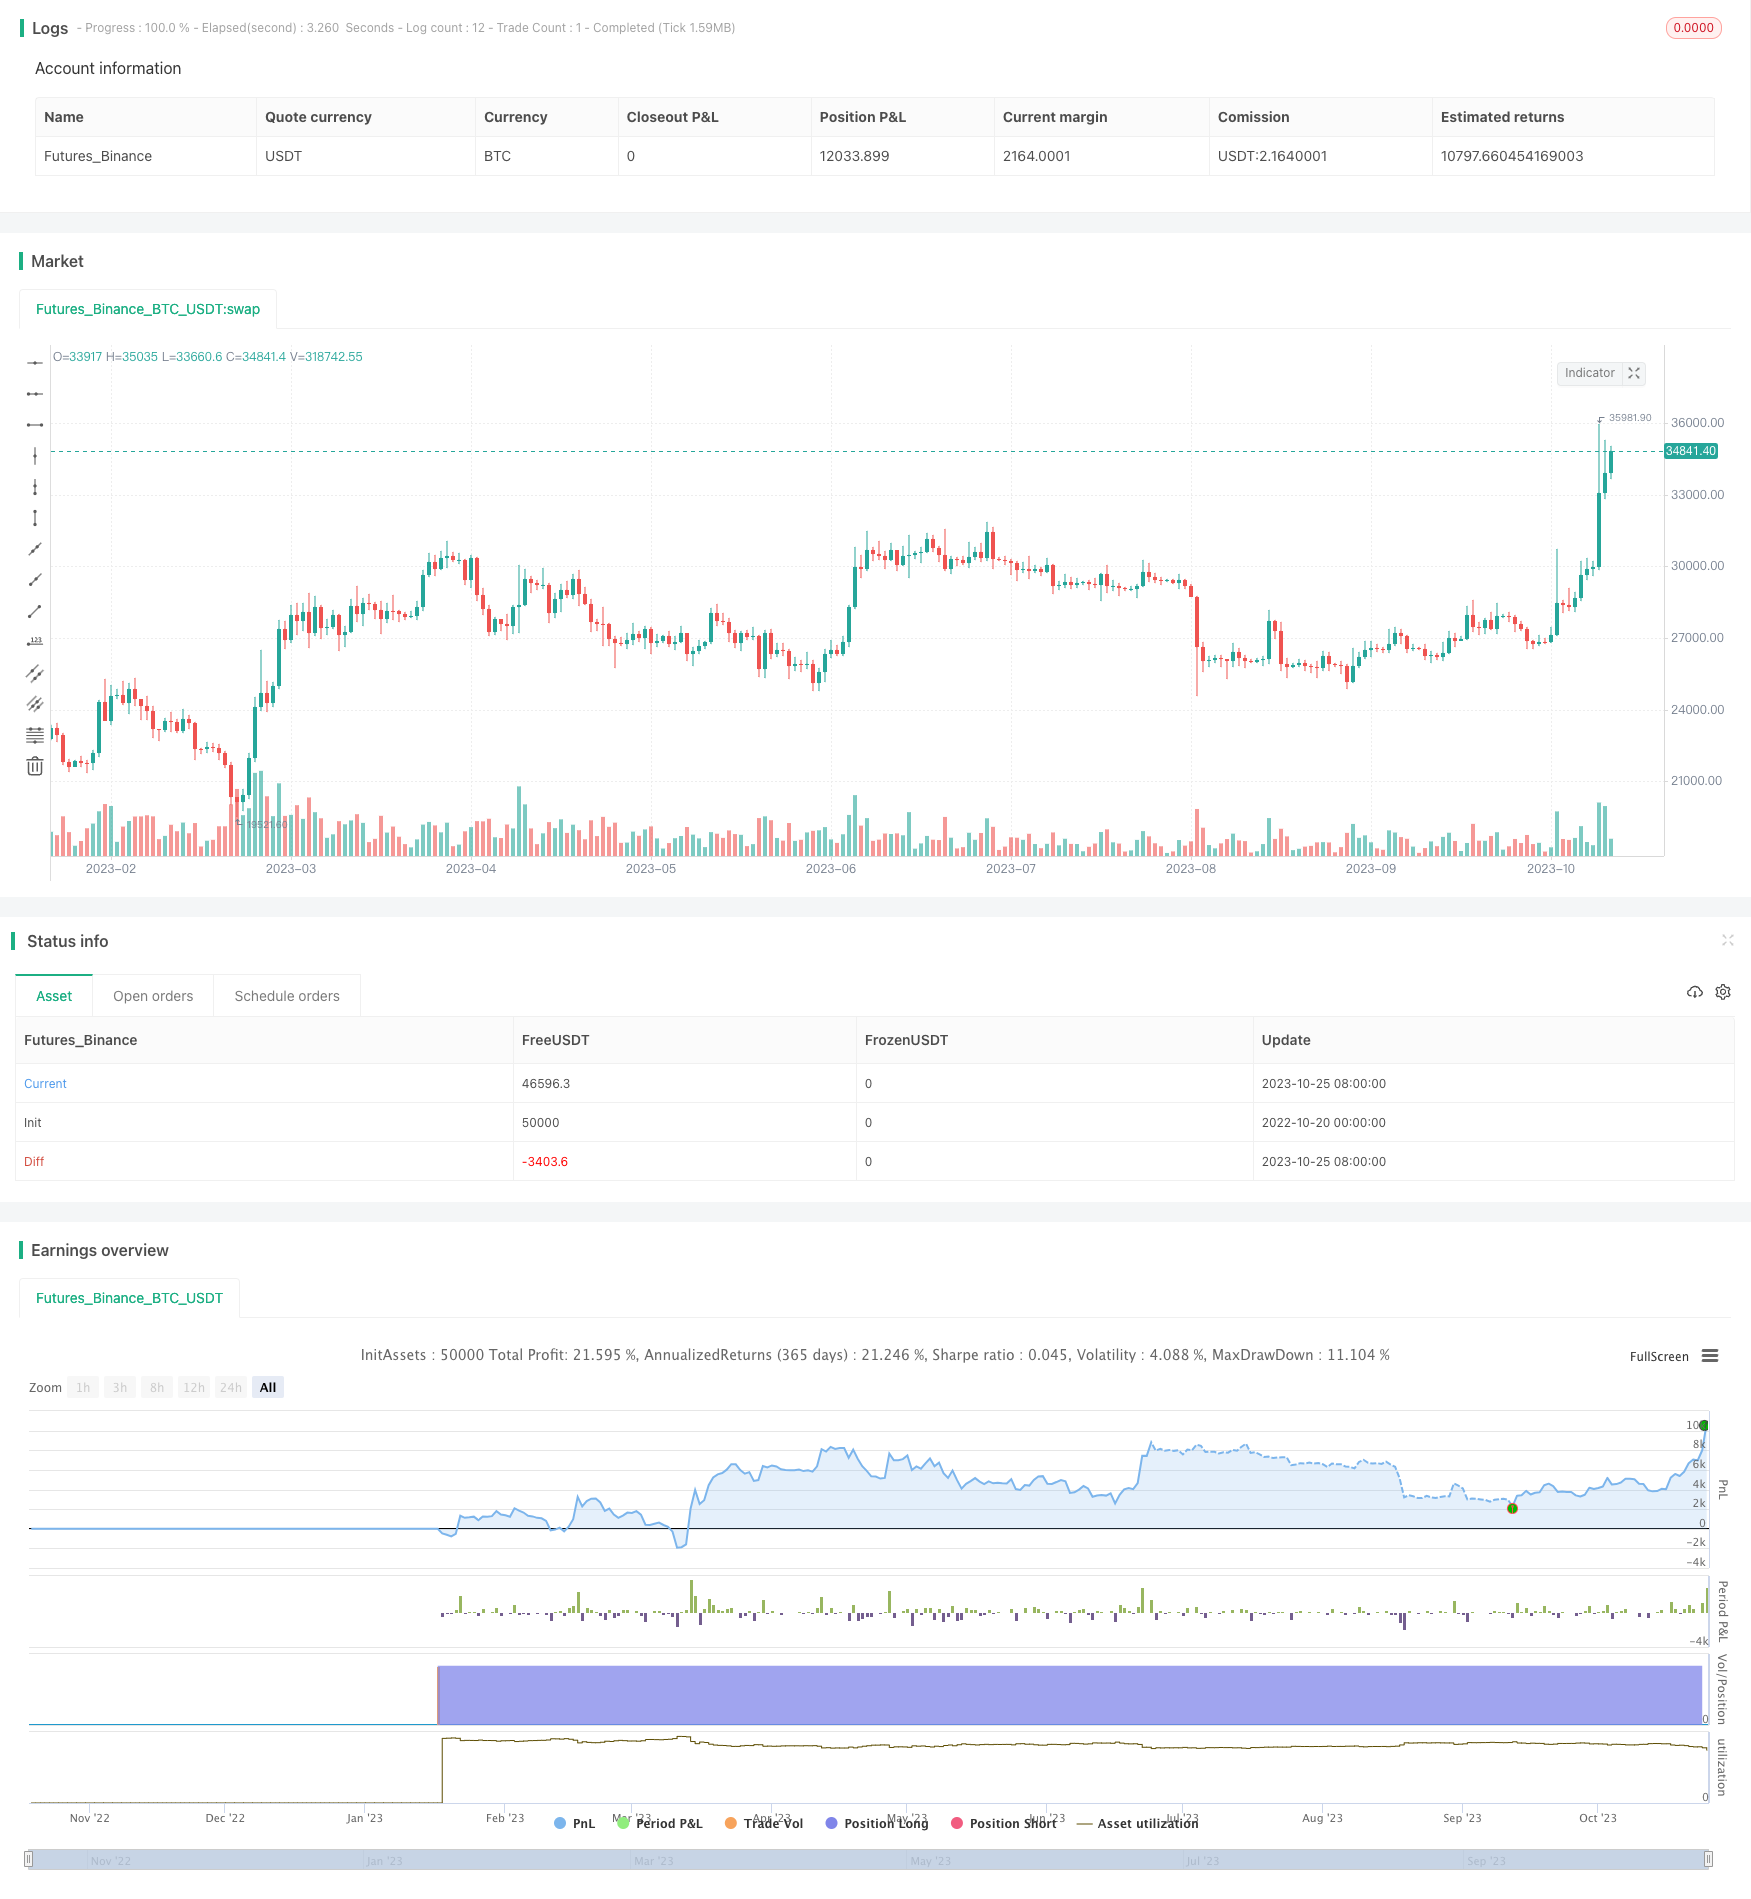
ICHIMOKU KUMO TWIST STRATEGY
Author: ChaoZhang, Date: 2023-10-27 16:36:59Tags:

Overview
The Ichimoku Kumo Twist strategy utilizes the conversion line, baseline, and leading span lines of the Ichimoku indicator to construct trading signals as a trend following strategy. It identifies short-term and medium-term trend reversal points by watching for twists in the Ichimoku clouds to find lower risk breakout points and overbought/oversold opportunities. The strategy can be used for intraday trading as well as multi-week intermediate-term trading.
Strategy Logic
The strategy primarily uses three Ichimoku lines – the conversion line, baseline, and leading span 1, along with the high and low prices of the candlesticks to calculate the upper and lower cloud boundaries. The conversion line calculates the midpoint of the high and low over the past 9 candles, representing the short-term mean. The baseline calculates the midpoint of the high and low over the past 26 candles as the long-term mean. Leading span 1 is the average of the conversion and baseline lines. Leading span 2 is the midpoint price of the past 52 candles.
Buy signals are generated when the leading span 1 crosses over leading span 2, while sell signals are generated when leading span 1 crosses under leading span 2. The trading strategy simply tracks the bullish and bearish crosses of the short and medium-term means to capture trend changes.
Advantage Analysis
The Ichimoku cloud twist strategy combines both short-term and medium-term trends, which can effectively identify trend reversal points.
Mean reversion based strategies have some lag built in to filter out noise.
Using the clouds to gauge trend strength allows for improved entries and exits.
No parameter optimization needed - the standard Ichimoku parameters work well.
Risk Analysis
Ichimoku has fairly complex internals and is not very sensitive to parameter tweaks making overoptimization difficult.
There can be multiple false signals during range-bound markets.
Divergence between short and medium-term trends can cause strategy breakdowns.
Stop losses are essential to control risk, otherwise large drawdowns are possible.
Improvement Opportunities
Test different combinations of conversion and baseline periods to find optimal balance.
Add filters with other indicators to avoid taking signals in unfavorable formations.
Incorporate stop loss strategies like dynamic or trailing stops.
Optimize position sizing based on market conditions.
Add trading commissions in backtests for more realistic results.
Summary
Overall, the Ichimoku cloud twist strategy is a moderate trend following strategy. It can effectively identify turns in trend and take positions in alignment with the trend direction. But monitoring is required and strict risk controls are necessary for long-term use. Continued improvements in parameter tuning, entry filters, stop loss mechanics, and more can further enhance this strategy’s stability and profitability.
/*backtest
start: 2022-10-20 00:00:00
end: 2023-10-26 00:00:00
period: 1d
basePeriod: 1h
exchanges: [{"eid":"Futures_Binance","currency":"BTC_USDT"}]
*/

//@version=3
strategy(title="Ichimoku Kumo Twist Strategy (Presets)", shorttitle="Kumo Twist Strategy", overlay=true)

xlowest_(src, len) =>
    x = src
    for i = 1 to len - 1
        v = src[i]
        if (na(v))
            break
        x := min(x, v)
    x

xlowest(src, len) =>
    na(src[len]) ? xlowest_(src, len) : lowest(src, len)

xhighest_(src, len) =>
    x = src
    for i = 1 to len - 1
        v = src[i]
        if (na(v))
            break
        x := max(x, v)
    x

xhighest(src, len) =>
    na(src[len]) ? xhighest_(src, len) : highest(src, len)

dropn(src, n) =>
    na(src[n]) ? na : src

ichiConversionPeriods(presets) =>
    if presets == "Crypto Doubled"
        20
    else
        if presets == "Crypto Singled"
            10
        else
            if presets == "Standard Doubled"
                18
            else
                9

ichiBasePeriods(presets) =>
    if presets == "Crypto Doubled"
        60
    else
        if presets == "Crypto Singled"
            30
        else
            if presets == "Standard Doubled"
                52
            else
                26

ichiLaggingSpan2Periods(presets) =>
    if presets == "Crypto Doubled"
        120
    else
        if presets == "Crypto Singled"
            60
        else
            if presets == "Standard Doubled"
                104
            else
                52

ichiDisplacement(presets) =>
    if presets == "Crypto Doubled"
        30
    else
        if presets == "Crypto Singled"
            30
        else
            if presets == "Standard Doubled"
                26
            else
                26

scaling = input(title="Scaling", options=["Linear", "Log"], defval="Linear")
presets = input(title="Presets",  options=["Crypto Doubled", "Crypto Singled", "Standard Doubled", "Standard Singled"], defval="Crypto Doubled")
dropCandles = input(1, minval=0, title="Drop first N candles")
showClouds = input(false, "Show Clouds")
stoploss = input(true, title="Stop Loss")

conversionPeriods = ichiConversionPeriods(presets)
basePeriods = ichiBasePeriods(presets)
laggingSpan2Periods = ichiLaggingSpan2Periods(presets)
displacement = ichiDisplacement(presets)
logScaling = scaling == "Log"

lows = dropn(low, dropCandles)
highs = dropn(high, dropCandles)

lowsp = logScaling ? log(lows) : lows
highsp = logScaling ? log(highs) : highs

donchian(len) =>
    avg(xlowest(lowsp, len), xhighest(highsp, len))

conversionLine = donchian(conversionPeriods)
baseLine = donchian(basePeriods)
leadLine1 = avg(conversionLine, baseLine)
leadLine2 = donchian(laggingSpan2Periods)

golong = crossover(leadLine1, leadLine2)
goshort = crossunder(leadLine1, leadLine2)

strategy.entry("Buy", strategy.long, when=golong, stop=(stoploss ? high+syminfo.mintick : na))
strategy.entry("Sell", strategy.short, when=goshort, stop=(stoploss ? low-syminfo.mintick : na))

conversionLinep = logScaling ? exp(conversionLine) : conversionLine
baseLinep = logScaling ? exp(baseLine) : baseLine
leadLine1p = logScaling ? exp(leadLine1) : leadLine1
leadLine2p = logScaling ? exp(leadLine2) : leadLine2

plot(showClouds ? conversionLinep : na, color=#0496ff, title="Conversion Line")
plot(showClouds ? baseLinep : na, color=#991515, title="Base Line")

p1 = plot(showClouds ? leadLine1p : na, offset = displacement, color=green, title="Lead 1")
p2 = plot(showClouds ? leadLine2p : na, offset = displacement, color=red, title="Lead 2")
fill(p1, p2, color = showClouds ? (leadLine1p > leadLine2p ? green : red) : na)
- Momentum Reversal Multi Timeframe Strategy
- Multi-Indicator Bitcoin Daily Trading Strategy
- Dual Balanced Bulls and Bears Strategy
- Gandalf Mean Reversion Quantitative Trading Strategy
- Momentum Breakout Reversal Trading Strategy
- Intraday Stochastic Oscillator with Double Moving Average Crossover Strategy
- Multi Timeframe Buy the Dip Strategy
- Bollinger Breakout Stop-loss Strategy
- Classic Dual Moving Average Crossover Strategy
- Fast Slow Dual Moving Average Trading Strategy
- Oscillation Breakthrough Strategy
- Breakout Swing Strategy
- A Powerful System Combining Reversal and Trend-Following Strategies
- Moving Average Crossover Strategy
- Reversal Breakout Strategy
- Multi-Period Dynamic Moving Average Strategy
- Seasonal Range Moving Average RSI Strategy
- 1-3-1 Red Green Candlestick Reversal Strategy
- Momentum Tracking Stop Loss Strategy
- Cumulative RSI Breakout Strategy